FHC P VEGAS M 2017
•
0 gefällt mir•85 views

YOUR BUSINESS IS YOUR PROFITABILITY IN CONCEPT HOTEL FUTURIST. SEE YOUR FUTURE AS YOUR PRESENT AND INVEST IN CREATIVITY THAT MAKES SENSE AND REALITY FOR BOTH GUESTS, MANAGEMENT AND STAFF. A NEW VISION AT SHORT TERM, MID TERM OR LONG TERM QUALITY AND TECHNOLOGY HOSPITALITY INDUSTRY.

Empfohlen
Weitere ähnliche Inhalte
Was ist angesagt?
Was ist angesagt? (17)
Ähnlich wie FHC P VEGAS M 2017
Ähnlich wie FHC P VEGAS M 2017 (20)
Mehr von Fabrice CLAMAGIRAND
Mehr von Fabrice CLAMAGIRAND (20)
Kürzlich hochgeladen
Kürzlich hochgeladen (20)
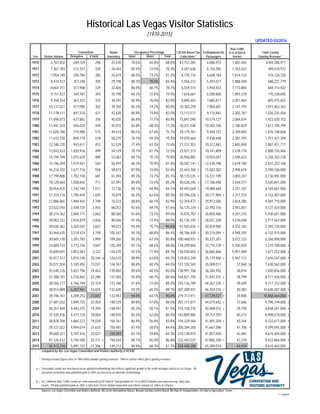
FHC P VEGAS M 2017
- 1. UPDATED 03/2016 Convention Occupancy Percentage Year Delegates # Held Hotel Motel Total 1970 6,787,650 269,129 296 25,430 70.0% 65.0% 68.0% $3,751,265 4,086,973 1,687,445 $369,286,977 1971 7,361,783 312,347 320 26,044 82.5% 72.0% 78.3% 4,241,630 4,102,285 1,763,432 399,410,972 1972 7,954,748 290,794 385 26,619 86.5% 73.2% 81.2% 4,770,716 4,608,764 1,814,133 476,126,720 1973 8,474,727 357,248 305 29,198 88.3% 78.5% 84.4% 5,556,312 5,397,017 1,888,949 588,221,779 1974 8,664,751 311,908 339 32,826 86.0% 68.7% 78.7% 6,559,315 5,944,433 1,773,806 684,714,502 1975 9,151,427 349,787 393 35,190 84.2% 72.8% 79.5% 7,616,661 6,500,806 1,893,378 770,336,695 1976 9,769,354 367,322 325 36,245 85.9% 76.0% 82.0% 8,890,463 7,685,817 2,051,464 845,975,652 1977 10,137,021 417,090 352 39,350 85.3% 74.2% 80.8% 10,383,259 7,964,687 2,147,793 1,015,463,342 1978 11,178,111 607,318 421 42,620 86.9% 74.8% 82.0% 13,113,511 9,110,842 2,303,767 1,236,235,456 1979 11,696,073 637,862 356 45,035 86.8% 71.7% 80.9% 15,847,040 10,574,127 2,064,874 1,423,620,102 1980 11,941,524 656,024 449 45,815 82.8% 68.3% 77.2% 18,231,548 10,302,106 2,185,829 1,617,194,799 1981 11,820,788 719,988 515 49,614 80.5% 67.6% 75.7% 18,179,761 9,469,727 2,369,850 1,676,148,606 1982 11,633,728 809,779 518 50,270 76.1% 59.3% 70.3% 19,070,664 9,438,648 2,381,705 1,751,421,394 1983 12,348,270 943,611 453 52,529 77.4% 63.3% 72.6% 21,731,353 10,312,842 2,465,848 1,887,451,717 1984 12,843,433 1,050,916 499 54,129 78.1% 61.7% 72.5% 23,921,313 10,141,809 2,518,718 2,008,155,460 1985 14,194,189 1,072,629 480 53,067 84.7% 70.1% 79.8% 26,956,881 10,924,047 2,596,633 2,256,762,736 1986 15,196,284 1,519,421 564 56,494 86.3% 70.9% 81.4% 30,587,141 r 12,428,748 2,679,180 2,431,237,168 1987 16,216,102 1,677,716 556 58,474 87.0% 74.0% 83.4% 34,443,765 r 15,582,302 2,908,674 2,789,336,000 1988 17,199,808 1,702,158 681 61,394 89.3% 73.7% 85.1% 38,175,535 r 16,231,199 3,003,247 3,136,901,000 1989 18,129,684 1,508,842 711 67,391 89.8% 72.5% 85.2% 40,528,245 r 17,106,948 3,444,577 3,430,851,000 1990 20,954,420 1,742,194 1,011 73,730 89.1% 69.8% 84.7% 49,493,569 r 19,089,684 3,751,181 4,104,001,000 1991 21,315,116 1,794,444 1,655 76,879 85.2% 62.6% 80.3% 49,396,226 r 20,171,969 r 3,757,233 4,152,407,000 1992 21,886,865 1,969,435 2,199 76,523 88.8% 66.1% 83.9% 52,259,477 r 20,912,585 3,824,286 4,381,710,000 1993 23,522,593 2,439,734 2,443 86,053 92.6% 69.7% 87.6% 56,125,234 r 22,492,156 3,943,857 4,727,424,000 1994 28,214,362 2,684,171 2,662 88,560 92.6% 73.2% 89.0% 76,876,787 r 26,850,486 4,201,310 5,430,651,000 1995 29,002,122 2,924,879 2,826 90,046 91.4% 72.4% 88.0% 82,135,745 r 28,027,239 4,276,658 5,717,567,000 1996 29,636,361 3,305,507 3,827 99,072 93.4% 75.7% 90.4% 91,565,876 r 30,459,965 4,552,183 5,783,735,000 1997 30,464,635 3,519,424 3,749 105,347 90.3% 68.8% 86.4% 98,186,440 r 30,315,094 r 4,948,355 6,152,415,000 1998 30,605,128 3,301,705 3,999 109,365 90.3% 67.3% 85.8% 100,468,931 r 30,227,287 5,072,233 6,346,958,000 1999 33,809,134 3,772,726 3,847 120,294 92.1% 68.6% 88.0% 118,299,856 33,715,129 r 5,705,929 7,210,700,000 r 2000 35,849,691 3,853,363 3,722 124,270 92.5% 71.9% 89.1% 130,550,852 r 36,865,866 5,951,009 7,671,252,000 r 2001 35,017,317 5,014,240 20,346 a 126,610 88.9% 63.8% 84.7% 129,053,244 35,179,960 r 5,967,112 7,636,547,000 r 2002 35,071,504 5,105,450 23,031 126,787 88.8% 60.2% 84.0% 127,102,165 35,009,011 37,868 b 7,630,562,000 r 2003 35,540,126 5,657,796 24,463 130,482 89.6% 60.5% 85.0% 138,941,106 36,265,932 38,074 7,830,856,000 r 2004 37,388,781 5,724,864 22,286 131,503 92.0% 68.7% 88.6% 164,821,755 41,441,531 r 38,799 8,711,426,000 r 2005 38,566,717 6,166,194 22,154 133,186 91.8% 72.0% 89.2% 193,136,789 44,267,370 r 39,649 9,717,322,000 r 2006 38,914,889 6,307,961 23,825 132,605 93.2% 65.2% 89.7% 207,289,931 46,304,376 r 40,383 10,630,387,000 r 2007 39,196,761 6,209,253 23,847 132,947 94.0% 64.5% 90.4% 219,713,911 47,729,527 r 39,808 10,868,464,000 r 2008 37,481,552 5,899,725 22,454 140,529 89.8% 57.8% 86.0% 207,117,817 44,074,642 r 37,686 9,796,749,000 r 2009 36,351,469 4,492,275 19,394 148,941 85.3% 50.1% 81.5% 153,150,310 40,469,012 r 39,199 8,838,261,000 r 2010 37,335,436 4,473,134 18,004 148,935 83.5% 52.0% 80.4% 163,809,985 39,757,359 40,213 8,908,574,000 r 2011 38,928,708 4,865,272 19,029 150,161 86.9% 56.0% 83.8% 194,329,584 41,481,204 r 40,344 9,222,677,000 r 2012 39,727,022 4,944,014 21,615 150,481 87.4% 58.0% 84.4% 200,384,250 41,667,596 41,706 r 9,399,845,000 r 2013 39,668,221 5,107,416 22,027 150,593 87.1% 59.8% 84.3% 210,138,974 41,857,059 42,485 9,674,404,000 r 2014 41,126,512 5,194,580 22,111 r 150,544 89.1% 65.0% 86.8% 232,443,537 42,885,350 r 42,318 9,553,864,000 r 2015 42,312,216 5,891,151 21,306 149,213 89.8% 68.3% 87.7% 254,438,208 45,389,074 44,419 9,616,463,000 Compiled by the Las Vegas Convention and Visitors Authority (LVCVA) * a = b = Sources: Las Vegas Convention and Visitors Authority; McCarran International Airport; Nevada Gaming Control Board; NV Dept of Transportation; CA Dept of Agriculture, Yermo r= revised So. California Auto Traffic counts are now reported by NV Dept of Transportation at I-15 at NV/CA Border and represent avg. daily auto counts. All data published prior to 2002 is data from Yermo Station Inspection and reflects annual est. tallies of vehicles. LVCVA Room Tax Collections * Gaming revenue figures prior to 1984 reflect taxable gaming revenues; 1984 to current reflect gross gaming revenues. Historical Las Vegas Visitor Statistics (1970-2015) Auto Traffic (I-15 at NV/CA Border) Convention counts are now based on an updated methodology that reflects significant growth in the small meetings market in Las Vegas. All unrevised convention data published prior to 2001 are based on an alternate methodology. En/Deplaned Air Passengers Room InventoryVisitor Volume Clark County Gaming Revenue *