1. An Phríomh-Oifig Staidrimh
Central Statistics Office
15 June 2010
Quarterly National Household Survey
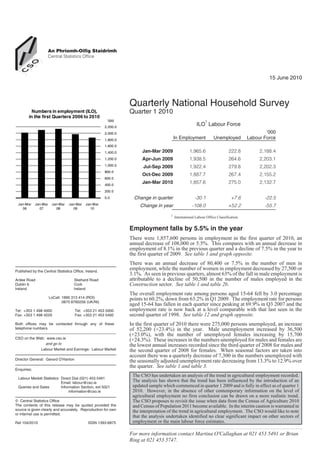
Numbers in employment (ILO), Quarter 1 2010
in the first Quarters 2006 to 2010
'000 1
2,200.0
ILO Labour Force
2,000.0 '000
1,800.0
In Employment Unemployed Labour Force
1,600.0
1,400.0 Jan-Mar 2009 1,965.6 222.8 2,188.4
1,200.0 Apr-Jun 2009 1,938.5 264.6 2,203.1
1,000.0 Jul-Sep 2009 1,922.4 279.8 2,202.3
800.0
Oct-Dec 2009 1,887.7 267.4 2,155.2
600.0
400.0
Jan-Mar 2010 1,857.6 275.0 2,132.7
200.0
0.0 Change in quarter -30.1 +7.6 -22.5
Jan-Mar Jan-Mar Jan-Mar Jan-Mar Jan-Mar
Change in year -108.0 +52.2 -55.7
06 07 08 09 10
1 International Labour Office Classification.
Employment falls by 5.5% in the year
There were 1,857,600 persons in employment in the first quarter of 2010, an
annual decrease of 108,000 or 5.5%. This compares with an annual decrease in
employment of 8.1% in the previous quarter and a decline of 7.5% in the year to
the first quarter of 2009. See table 1 and graph opposite.
There was an annual decrease of 80,400 or 7.5% in the number of men in
Published by the Central Statistics Office, Ireland.
employment, while the number of women in employment decreased by 27,500 or
3.1%. As seen in previous quarters, almost 63% of the fall in male employment is
Ardee Road Skehard Road attributable to a decline of 50,500 in the number of males employed in the
Dublin 6 Cork Construction sector. See table 1 and table 2b.
Ireland Ireland
The overall employment rate among persons aged 15-64 fell by 3.0 percentage
LoCall: 1890 313 414 (ROI) points to 60.2%, down from 63.2% in Q1 2009. The employment rate for persons
0870 8760256 (UK/NI)
aged 15-64 has fallen in each quarter since peaking at 69.9% in Q3 2007 and the
Tel: +353 1 498 4000 Tel: +353 21 453 5000 employment rate is now back at a level comparable with that last seen in the
Fax: +353 1 498 4229 Fax: +353 21 453 5492 second quarter of 1998. See table 12 and graph opposite.
Both offices may be contacted through any of these In the first quarter of 2010 there were 275,000 persons unemployed, an increase
telephone numbers. of 52,200 (+23.4%) in the year. Male unemployment increased by 36,500
(+23.0%), with the number of unemployed females increasing by 15,700
CSO on the Web: www.cso.ie (+24.3%). These increases in the numbers unemployed for males and females are
and go to the lowest annual increases recorded since the third quarter of 2008 for males and
Labour Market and Earnings: Labour Market the second quarter of 2008 for females. When seasonal factors are taken into
account there was a quarterly decrease of 7,300 in the numbers unemployed with
Director General: Gerard O'Hanlon the seasonally adjusted unemployment rate decreasing from 13.3% to 12.9% over
the quarter. See table 1 and table 3.
Enquiries:
The CSO has undertaken an analysis of the trend in agricultural employment recorded.
Labour Market Statistics Direct Dial (021) 453 5491
Email: labour@cso.ie
The analysis has shown that the trend has been influenced by the introduction of an
Queries and Sales Information Section, ext 5021 updated sample which commenced in quarter 1 2009 and is fully in effect as of quarter 1
information@cso.ie 2010. However, in the absence of other contemporary information on the level of
agricultural employment no firm conclusion can be drawn on a more realistic trend.
ã Central Statistics Office The CSO proposes to revisit the issue when data from the Census of Agriculture 2010
The contents of this release may be quoted provided the and Census of Population 2011 become available. In the interim caution is warranted in
source is given clearly and accurately. Reproduction for own the interpretation of the trend in agricultural employment. The CSO would like to note
or internal use is permitted.
that the analysis undertaken identified no clear significant impact on other sectors of
Ref 104/2010 ISSN 1393-6875 employment or the main labour force estimates.
For more information contact Martina O'Callaghan at 021 453 5491 or Brian
Ring at 021 453 5747.
2. The long-term unemployment rate in the first quarter of 2010 was 5.3% compared
Persons aged 15 years and over in with 2.2% in the first quarter of 2009. See table 16 and table 17.
employment (ILO) classified
by NACE Economic Sector, The total number of persons in the labour force in the first quarter of 2010 was
Quarter 1 2008 and Quarter 1 2010 2,132,700, representing a decrease of 55,700 or 2.5% over the year. This
'000 compares with an annual labour force decrease of 2.0% or 45,100 in the first
350.0 quarter of 2009. The overall participation rate declined from 62.0% in Q1 2009 to
60.7% in Q1 2010. See table 1 and table 9.
300.0
Employment fell on an annual basis in 9 of the 14 economic sectors. The largest
250.0 decline in employment was again recorded in the Construction sector where the
numbers employed fell by 50,800 (-28.2%) over the year. Employment in the
200.0 construction sector has now fallen by over 50% since its peak in the second half of
2007. The next largest annual decreases in employment were recorded in the
150.0 Agriculture, forestry and fishing and Industry sectors where the numbers employed
fell by 20,900 (-20.6%) and 20,300 (-7.7%) respectively. It should be noted that
100.0 the CSO suggests caution in interpretation of the trend in the Agriculture, forestry
and fishing sector at this time. See table 2b, graph opposite and additional note
50.0 regarding Agriculture, forestry and fishing employment on page 1.
0.0 The latest available figures for all EU-27 member states, which are for the fourth
1 2 3 4 5 6 7 8 9 10 11 12 13 14 quarter of 2009, show that between the fourth quarters of 2008 and 2009 Ireland’s
NACE Economic Sector employment level fell by 8.3% while its labour force declined by 3.3%. This
Q1 2008 Q1 2010
compares with a decline in employment of 2.0% in the EU-27 countries while the
size of the EU-27 labour force increased by 0.1% in the year to Q4 2009. Ireland’s
KEY unemployment rate of 12.3% was 3.1 percentage points higher than the EU-27
1- A Agriculture, forestry and fishing average unemployment rate of 9.2%. The estimated EU unemployment rate for
2- B-E Industry
February 2010 was 9.6% compared with a seasonally adjusted rate of 12.9% in
3- F Construction
Ireland for Q1 2010. See table 25.
4- G Wholesale and retail trade; repair of
motor vehicles and motorcycles
Full-time employment declines by 115,700 over the year
5- H Transportation and storage Full-time employment fell by 115,700 on an annual basis with declines in both
6- I Accommodation and food service activities male (-91,800) and female (-23,900) full-time employment. The largest
7- J Information and communication decreases in full-time employment occurred in the Construction (-53,600) and
8- K-L Financial, insurance and real estate activities Industry (-19,500) sectors. In the first quarter of 2010, the Construction sector
9- M Professional, scientific and technical activities accounted for 11.9% of all male full-time employment compared with 16.1% for
10- N Administrative and support service activities the first quarter of 2009. See table 1, table 2b and graph opposite.
11- O Public administration and defence;
There was an increase of 7,700 in the numbers employed part-time, with male
compulsory social security
part-time employment increasing 11,400 over the year while female part-time
12- P Education employment decreased by 3,600 over the same period. See table 1.
13- Q Human health and social work activities
14- R-U Other NACE activities With the exception of Professional (+6,200) all occupational groups showed a
decline in employment over the year. The largest decreases were in the Craft and
related (-44,800), Other (-21,200) and Plant and machine operatives (-16,400)
groups. Since quarter 1 2008 employment in the Craft and related occupational
group has fallen by 101,100 or 35.0%. See table 4.
Employment trends in the
first Quarters 2006 to 2010
There were 1,535,900 employees in the first quarter of 2010 representing an
classified by full-time and part-time annual decrease of 81,900 or 5.1%. Almost two thirds of the decrease in the
'000 number of employees is attributable to males (-53,400) with females decreasing
100.0 by 28,500. See table 6.
75.0
50.0
The estimated number of self-employed persons in Q1 2010 was 307,800, a
25.0
decrease of 25,100 or 7.5% over the year. See table 6.
0.0
- 25.0 Number of unemployed increases to 275,000
- 50.0
- 75.0
There were 194,900 males and 80,200 females unemployed in the first quarter of
-100.0
2010, bringing the total number of unemployed up to 275,000, an increase of
-125.0
52,200 (+23.4%) in the year. The number of unemployed males increased by
-150.0
36,500 (+23.0%), with female unemployment increasing by 15,700 (+24.3%).
-175.0
See table 1 and table 13.
-200.0
On a seasonally adjusted basis the number of persons unemployed decreased by
-225.0
2006-2007 2007-2008 2008-2009 2009-2010
7,300 between Q4 2009 and Q1 2010. See table 3.
full-time part-time The unemployment rate increased from 10.2% to 12.9% over the year. This
brings the unemployment rate to a level comparable with that of 1994 and 1995
when the unemployment rates were 14.7% and 12.2% respectively. The male
unemployment rate was 16.4% and the female unemployment rate was 8.5% in
Q1 2010.
Seasonally adjusted, the male and female unemployment rates stood at 16.3% and
8.8% respectively in the first quarter of 2010. See table 3.
2
3. In the first quarter of 2010 the unemployment rate among persons aged 15-19 was
Employment rates for persons aged 15 to 64 30.0% while for persons aged 20-24 a rate of 24.9% was recorded. This compares
classified by sex, with 25.6% and 17.8% for 15-19 year olds and 20-24 year olds respectively in Q1
in the first Quarters 1999 to 2010
%
2009 and rates of 13.5% and 8.3% respectively in Q1 2008. Significantly lower
unemployment rates were recorded among older age groups with all age groups
100.0 over 44 years having unemployment rates below ten percent. Unemployment rates
90.0 did increase however for all age groups over the year and this pattern was seen for
80.0 both males and females. See table 1, table 14 and table 16.
70.0
60.0
Long-term unemployment rate increases to 5.3%
50.0 In the year to Q1 2010, the number of long-term unemployed persons increased by
40.0 63,500, bringing total long-term unemployment to 112,600. The long-term
30.0 unemployment rate now stands at 5.3% compared with 2.2% in the first quarter of
20.0
2009 and 1.3% in the first quarter of 2008. As of Q1 2010, long-term
unemployment accounted for 40.9% of total unemployment compared with 22.0%
10.0
a year earlier. See table 16, table 17, table 18 and graph opposite.
0.0
Jan- Jan- Jan- Jan- Jan- Jan- Jan- Jan- Jan- Jan- Jan- Jan- Total short-term unemployment was 160,200 in the first quarter of 2010, a
Mar Mar Mar Mar Mar Mar Mar Mar Mar Mar Mar Mar decrease of 13,000 on an annual basis. This was the first such annual decrease
99 00 01 02 03 04 05 06 07 08 09 10
since Q1 2005. In the year to Q1 2009, short-term unemployment increased by
Males Females All persons 93,600. See table 16, table 17, table 18 and graph opposite.
Decline in labour force driven by falling participation
There were 2,132,700 persons in the labour force in the first quarter of 2010, an
annual decrease of 2.5% (-55,700). Almost 70% of the decline in the size of the
Number of persons unemployed labour market is attributable to a decline in participation of 38,800. See table 1,
by duration of unemployment, Q1 table 8 and table 9.
2008 to Q1 2010 000's
300
In addition to changes in participation, the labour force is also affected by changes
in the number of persons of working age in the State (demographic effect). Up to
1 year and over the start of 2008 this demographic effect had been adding 60,000 or more to the
Less than 1 year 250 labour force on an annual basis, primarily driven by net inward migration. With the
decline in inward migration the demographic effect declined through 2008 and
became negative in Q3 2009. In Q1 2010 this negative demographic effect
200 contributed just under 17,000 to the overall decline in the labour force.
The broadest survey-based labour supply indicator, S3, which included persons
150 outside the labour force who show some interest in obtaining work as well as the
unemployed increased from 14.0% in the first quarter of 2009 to 17.0% in the first
quarter of 2010. See table 19 and table 20.
100
Overall participation rate continues to fall
50
The overall participation rate declined from 62.0% in Q1 2009 to 60.7% in Q1
2010. The male participation rate decreased from 70.8% to 68.8% in the year while
0 the female participation rate declined from 53.3% to 52.7% over the same period.
Q108 Q308 Q109 Q309 Q110
The greatest fall in participation rates were seen among persons in the youngest age
groups. See table 8, table 9 and graph opposite.
¨ The participation rate among 20-24 year olds fell by 5.3 percentage
ILO participation rates classified points from 70.8% to 65.5% over the year. A rate of 74.2% had been
by age group, recorded in Q1 2008;
Quarter 1 2009 and
Quarter 1 2010 % ¨ Among 15-19 year olds a fall of 4.4 percentage points was recorded
(from 19.7% to 15.3%). The participation rate among 15-19 year olds
100.0
had been 24.8% in Q1 2008;
90.0
¨ The only other age group where a change in participation of more than
80.0 one percentage point was recorded over the year was 60-64 year olds
70.0 with a decrease of 1.1 percentage points.
60.0
Number of people not in the labour force grows by 3%
50.0
40.0 In the year to Q1 2010 the number of people defined as not in the labour force grew
by 40,200 to 1,383,300 (+3.0%), while in the year to Q1 2009 the number of people
30.0 not in the labour force increased by 56,900 (+4.4%). See table 1.
20.0
10.0 Non-Irish national labour force declines by almost 16%
0.0 Broad indicative estimates of the labour force status of non-Irish nationals are
15-19 20-24 25-34 35-44 45-54 55-59 60-64 65+ presented in the annex. There were an estimated 402,700 non-Irish nationals aged
15 years and over in the State in the first quarter of 2010, a decrease of 59,600 or
Age group
12.9% over the year. This compares with a decrease of 20,800 or 4.3% in the first
Q1 2009 Q1 2010
quarter of 2009. The number of non-Irish nationals aged 15 and over in the State
3
4. ILO Economic Status has declined by 82,600 or 17.0% since the number peaked at 485,300 in Q4 2007.
classified by nationality, See table A1 in the annex.
Quarter 1 2010 % In the first quarter of 2010 the estimated number of non-Irish nationals in the
100.0
labour force was 282,900, a decrease of 53,500 or 15.9% in the year. A decrease of
29,700 had been recorded in the year to Q1 2009. The number of Irish nationals in
90.0 the labour force was almost static in the year, decreasing by 2,300 to 1,849,700.
80.0 See table A1 in the annex.
70.0
According to ILO criteria, 237,400 non-Irish nationals were in employment in Q1
60.0 2010 representing a decrease of 49,600 (-17.3%) over the year. A further 45,500
50.0 were unemployed, a decrease of 3,900 in the year to Q1 2010. Nationals of the
40.0
EU15 to EU27 States showed a decline in employment of 12,800 (-10.0%) and a
decrease in unemployment of 2,300 over the year. See table A1 in the annex and
30.0 graph opposite.
20.0
10.0
In the first quarter of 2010 non-Irish nationals accounted for 12.8% of all persons
aged 15 and over in employment. This compares with 14.6% in Q1 2009 and
0.0 16.1% in Q1 2008. Non-Irish nationals accounted for 31.1% of workers in
Irish nationals Non-Irish nationals Accommodation and food service activities, 22.5% in Administrative and support
service activities and 17.3% in Information and communication. The largest
decreases in employment for non-Irish nationals occurred in the Construction
(-12,100) and Human health and social work activities (-4,500) sectors. See table
In employment
Unemployed
A2 in the annex.
Not in labour force
Educational Attainment
The unemployment rate among persons with a third level honours degree or above
was 6.1% in Q1 2010 compared with 9.1% for persons with a third level
ILO Economic Status classified by non-honours degree and rates of 13.7% or higher among persons with lower levels
highest level of educational of educational attainment. The participation rate among persons with a third level
attainment, honours degree or above was 88.3% in Q1 2010 falling to 37.7% for persons with
Quarter 1 2010 primary or below as their highest level of education. See table 23a and graph
%
opposite.
100.0
A new table, table 23c, has been included in the release focussing on the labour
90.0 market status of those who left school with a highest level of education of lower
secondary or below. The table also presents comparative information for other
80.0 groups in the labour market by age and educational attainment.
70.0 In Q1 2010, 29% of all persons aged 18-24 who had left education with a highest
level of educational attainment of lower secondary or below (the group known as
60.0 early school leavers by international convention) were in employment compared
with 39% in Q1 2009. The employment rate for such persons was 56% in Q1 2007.
50.0 In addition, 30% of all early school leavers aged 18-24 were classified as
unemployed in the first quarter of 2010, almost double the comparable figure of
40.0
16% in Q1 2007. A higher employment rate (43%) and a lower unemployment rate
30.0
(13%) was recorded for other persons aged 18-24 in Q1 2010 (i.e. persons who had
completed higher secondary education or above) and this was seen in each period
20.0
covered. However a greater rate of decline in the employment rate of early school
leavers was recorded over time than other persons aged 18-24. As a result, the
10.0 level of the gap in employment rates increased from 9 percentage points in Q1 2007
to 14 percentage points in Q1 2010. See table 23c.
0.0
Almost half (47%) of those persons aged 25-64 whose highest educational
1 2 3 4 5 6
attainment level was lower secondary or below were in employment in Q1 2010,
In employment compared with three quarters (74%) of other persons aged 25-64. See table 23c.
Unemployed
Not in labour force Regional Comparisons
KEY Employment fell by 21,400 (-4.3%) in the Border, Midland and Western region
1- Primary or below and by 86,500 (-5.9%) in the Southern and Eastern region in the year to the first
quarter of 2010. There were increases of 6,100 (+9.4%) and 46,200 (+29.2%) in
2- Lower secondary
the numbers unemployed in the Border, Midland and Western and Southern and
3- Higher secondary Eastern regions respectively. See table 7a.
4- Post leaving cert
The participation rate in the Border, Midland and Western region was 58.0%
5- Third level non-honours degree compared with a participation rate of 61.6% in the Southern and Eastern region.
6- Third level honours degree or above See table 7a.
At NUTS3 level, employment fell in all regions with the South-East (-10.6%) and
the Mid-West (-7.0%) regions showing the largest percentage decreases. This
equated to an annual decrease of 22,600 in the numbers in employment in the
South-East and an annual decrease of 11,200 in the Mid-West region. All regional
data is based on the location of the respondents’ usual address. See table 7b.
4
5. Contents Page no
Table 1 Persons aged 15 years and over classified by sex and ILO Economic Status 6
Table 2a Persons aged 15 years and over in employment (ILO) classified by sex and Broad NACE Rev. 2 Economic Sector 7
Table 2b Persons aged 15 years and over in employment (ILO) classified by sex and NACE Rev. 2 Economic Sector 7
Table 3 Seasonally Adjusted Series of persons aged 15 years and over classified by sex, ILO Economic Status and
NACE Rev. 2 Economic Sector 8
Table 4 Persons aged 15 years and over in employment (ILO) classified by sex and occupation 9
Table 5 Persons aged 15 years and over in employment (ILO) classified by sex and usual hours of work 10
Table 6 Persons aged 15 years and over in employment (ILO) classified by employment status 11
Table 7a Persons aged 15 years and over classified by NUTS2 regions and ILO Economic Status 11
Table 7b Persons aged 15 years and over classified by NUTS3 regions and ILO Economic Status 12
Table 8 Labour force participation rates (ILO) classified by sex, age group and marital status,
January-March 2010 13
Table 9 Labour force participation rates (ILO) classified by sex and age group 13
Table 10 Number of persons in the labour force (ILO) classified by sex and age group 14
Table 11 Number of persons in employment (ILO) classified by sex and age group 14
Table 12 Employment rates (ILO) for persons aged 15 to 64, classified by sex and age group 15
Table 13 Number of persons unemployed (ILO) classified by sex and age group 15
Table 14 Unemployment rates (ILO) classified by sex and age group 16
Table 15 Labour force situation of married females classified by age group 16
Table 16 Persons aged 15 years and over classified by labour force, employment, unemployment and
long-term unemployment (ILO) 17
Table 17 Persons aged 15 years and over classified by sex and duration of unemployment (ILO) 18
Table 18 Persons aged 15 years and over classified by sex, age group and duration of unemployment (ILO) 18
Table 19 Persons aged 15 years and over classified by detailed ILO Economic Status 19
Table 20 Indicators of potential labour supply 20
Table 21 Persons aged 15 years and over classified by Principal Economic Status 20
Table 22 Persons aged 15 years and over classified by ILO Economic Status and by Principal Economic Status,
January-March 2010 21
Table 23a Persons aged 15 to 64, classified by the highest level of education attained, ILO Economic Status
and sex, January-March 2010 22
Table 23b Persons aged 15 to 64, classified by the highest level of education attained, ILO Economic Status
and sex, January-March 2009 23
Table 23c Persons aged 18 to 64, classified by ILO Economic Status, age, highest level of educational attainment
and sex, Quarter 1 2007 to Quarter 1 2010 24
Table 24 Estimated adult members of family units classified by composition of family unit, ILO Economic Status
and sex, January-March 2010 25
Table 25 Labour Force Survey results classified by ILO Economic Status for persons aged 15 or over in EU
member states 26
6. Table 1 Persons aged 15 years and over classified by sex and ILO Economic Status
'000
ILO Economic Status Jan- Oct- Jan- Apr- Jul- Oct- Jan-
Mar 08 Dec 08 Mar 09 Jun 09 Sep 09 Dec 09 Mar 10
Males
In labour force 1,272.0 1,260.5 1,235.0 1,238.9 1,232.0 1,205.3 1,191.1
In employment: 1,198.9 1,143.4 1,076.7 1,052.0 1,040.0 1,016.2 996.3
full-time 1,110.5 1,050.8 973.4 943.4 923.5 898.3 881.6
part-time: 88.5 92.5 103.2 108.5 116.5 117.8 114.6
of which: part-time, not underemployed 1 86.5 86.0 94.9 102.0 108.0 110.4 106.9
part-time, underemployed 1 2.0 6.5 8.3 6.5 8.6 7.4 7.7
Unemployed: 73.1 117.1 158.4 186.9 192.0 189.1 194.9
seeking full-time work 70.0 112.7 153.5 181.1 185.7 183.8 190.6
seeking part-time work 3.1 4.4 4.8 5.8 6.3 5.3 4.2
Not in labour force 475.8 485.3 508.4 498.1 506.4 528.6 539.4
Marginally attached to the Labour Force 8.2 7.2 10.2 10.2 12.6 15.8 16.3
Others 467.6 478.1 498.2 488.0 493.9 512.8 523.1
Total males aged 15 or over 1,747.8 1,745.8 1,743.5 1,737.0 1,738.4 1,733.8 1,730.6
Unemployment rate % 5.7 9.3 12.8 15.1 15.6 15.7 16.4
Participation rate % 72.8 72.2 70.8 71.3 70.9 69.5 68.8
Females
In labour force 961.5 963.8 953.4 964.2 970.3 949.9 941.5
In employment: 925.2 911.2 888.9 886.5 882.4 871.6 861.4
full-time 626.0 610.7 586.8 588.7 586.9 569.9 562.9
part-time: 299.2 300.6 302.1 297.8 295.6 301.6 298.5
of which: part-time, not underemployed 1 297.4 293.1 294.0 290.8 288.8 293.9 292.2
part-time, underemployed 1 1.9 7.4 8.1 7.0 6.7 7.8 6.3
Unemployed: 36.3 52.6 64.5 77.7 87.9 78.4 80.2
seeking full-time work 24.0 37.3 49.3 62.9 70.7 63.9 65.6
seeking part-time work 12.3 15.3 15.1 14.8 17.2 14.4 14.5
Not in labour force 810.4 824.2 834.6 822.6 817.5 837.2 843.9
Marginally attached to the Labour Force 3.7 4.2 5.4 5.1 7.1 6.1 7.0
Others 806.7 820.1 829.3 817.6 810.4 831.1 836.9
Total females aged 15 or over 1,771.9 1,788.0 1,788.0 1,786.8 1,787.8 1,787.2 1,785.4
Unemployment rate % 3.8 5.5 6.8 8.1 9.1 8.3 8.5
Participation rate % 54.3 53.9 53.3 54.0 54.3 53.2 52.7
All persons
In labour force 2,233.5 2,224.3 2,188.4 2,203.1 2,202.3 2,155.2 2,132.7
In employment: 2,124.1 2,054.6 1,965.6 1,938.5 1,922.4 1,887.7 1,857.6
full-time 1,736.4 1,661.5 1,560.2 1,532.1 1,510.3 1,468.3 1,444.5
part-time: 387.7 393.1 405.4 406.4 412.1 419.5 413.1
of which: part-time, not underemployed 1 383.9 379.2 388.9 392.8 396.8 404.3 399.1
part-time, underemployed 1 3.8 13.9 16.5 13.6 15.3 15.2 14.0
Unemployed: 109.4 169.7 222.8 264.6 279.8 267.4 275.0
seeking full-time work 94.0 150.0 202.9 244.0 256.4 247.7 256.3
seeking part-time work 15.4 19.7 19.9 20.6 23.5 19.7 18.8
Not in labour force 1,286.2 1,309.5 1,343.1 1,320.8 1,323.9 1,365.8 1,383.3
Marginally attached to the Labour Force 11.9 11.4 15.6 15.2 19.7 21.9 23.3
Others 1,274.3 1,298.1 1,327.5 1,305.6 1,304.2 1,343.9 1,360.0
Total persons aged 15 or over 3,519.7 3,533.9 3,531.5 3,523.8 3,526.2 3,521.0 3,516.0
Unemployment rate % 4.9 7.6 10.2 12.0 12.7 12.4 12.9
Participation rate % 63.5 62.9 62.0 62.5 62.5 61.2 60.7
1
See Background Notes.
6
7. Table 2a Persons aged 15 years and over in employment (ILO) classified by sex and
Broad NACE Rev. 2 Economic Sector '000
Broad economic sector Jan- Oct- Jan- Apr- Jul- Oct- Jan-
(NACE Rev. 2) Mar 08 Dec 08 Mar 09 Jun 09 Sep 09 Dec 09 Mar 10
Males
A Agriculture 102.9 102.7 91.2 87.3 86.7 81.2 72.7
B-F Industry 442.5 405.4 356.5 328.3 320.9 304.9 295.5
G-U Services 653.5 635.3 628.9 636.4 632.4 630.1 628.2
Females
A Agriculture 12.9 13.5 10.3 9.9 9.2 8.3 8.0
B-F Industry 91.9 87.7 86.0 85.5 82.7 78.7 76.0
G-U Services 820.4 810.1 792.6 791.0 790.6 784.6 777.4
All persons
A Agriculture 115.8 116.2 101.5 97.2 95.9 89.5 80.6
B-F Industry 534.4 493.1 442.6 413.8 403.6 383.6 371.5
G-U Services 1,473.8 1,445.3 1,421.5 1,427.5 1,423.0 1,414.6 1,405.6
Total persons 2,124.1 2,054.6 1,965.6 1,938.5 1,922.4 1,887.7 1,857.6
Table 2b Persons aged 15 years and over in employment (ILO) classified by sex and
NACE Rev. 2 Economic Sector '000
Economic sector Jan- Oct- Jan- Apr- Jul- Oct- Jan-
(NACE Rev. 2) Mar 08 Dec 08 Mar 09 Jun 09 Sep 09 Dec 09 Mar 10
Males
A Agriculture, forestry and fishing 102.9 102.7 91.2 87.3 86.7 81.2 72.7
B-E Industry 203.4 201.2 187.2 184.3 179.6 178.4 176.7
F Construction 239.1 204.2 169.3 143.9 141.2 126.5 118.8
G Wholesale and retail trade; repair of motor vehicles and motorcycles 156.0 140.0 135.8 134.2 130.6 128.8 131.1
H Transportation and storage 76.9 74.5 76.7 78.1 79.3 76.0 75.4
I Accommodation and food service activities 55.8 49.7 51.9 54.5 55.6 55.5 55.9
J Information and communication 49.8 47.1 51.2 51.0 50.1 50.3 52.6
K-L Financial, insurance and real estate activities 42.9 46.5 44.6 48.3 47.8 49.8 48.6
M Professional, scientific and technical activities 63.2 67.0 64.1 63.4 62.3 62.4 60.5
N Administrative and support service activities 42.7 35.1 32.7 33.3 33.2 30.2 29.2
O Public administration and defence; compulsory social security 51.1 52.6 53.9 53.0 52.9 54.5 53.3
P Education 36.9 41.9 40.5 39.9 37.8 39.2 40.3
Q Human health and social work activities 36.8 39.7 37.4 41.2 40.7 42.7 42.1
R-U Other NACE activities 41.5 41.1 40.2 39.6 42.1 40.7 39.2
Total males 1,198.9 1,143.4 1,076.7 1,052.0 1,040.0 1,016.2 996.3
Females
A Agriculture, forestry and fishing 12.9 13.5 10.3 9.9 9.2 8.3 8.0
B-E Industry 78.9 75.5 75.5 74.0 72.5 68.5 65.7
F Construction 13.0 12.2 10.5 11.5 10.3 10.2 10.3
G Wholesale and retail trade; repair of motor vehicles and motorcycles 158.3 150.3 148.1 143.5 141.2 136.8 135.7
H Transportation and storage 17.1 15.8 16.6 16.5 16.8 17.2 17.5
I Accommodation and food service activities 74.9 65.6 66.2 65.4 67.7 65.0 67.8
J Information and communication 21.9 21.5 21.5 22.5 22.4 22.2 21.5
K-L Financial, insurance and real estate activities 60.4 62.2 58.9 60.5 61.8 56.6 54.9
M Professional, scientific and technical activities 47.7 44.7 39.7 39.2 38.9 41.5 41.4
N Administrative and support service activities 39.5 31.5 33.8 32.7 34.0 32.0 29.8
O Public administration and defence; compulsory social security 51.6 53.8 51.8 54.7 52.5 52.7 52.6
P Education 102.1 112.0 110.0 110.5 101.4 108.7 107.3
Q Human health and social work activities 183.5 189.6 185.1 186.6 192.8 191.1 189.9
R-U Other NACE activities 63.4 63.1 60.9 59.1 61.1 60.7 59.0
Total females 925.2 911.2 888.9 886.5 882.4 871.6 861.4
All persons
A Agriculture, forestry and fishing 115.8 116.2 101.5 97.2 95.9 89.5 80.6
B-E Industry 282.3 276.7 262.7 258.3 252.1 246.9 242.4
F Construction 252.1 216.3 179.9 155.4 151.5 136.7 129.1
G Wholesale and retail trade; repair of motor vehicles and motorcycles 314.2 290.3 283.9 277.7 271.8 265.6 266.8
H Transportation and storage 94.0 90.3 93.3 94.6 96.1 93.2 92.8
I Accommodation and food service activities 130.7 115.3 118.2 119.8 123.3 120.4 123.7
J Information and communication 71.7 68.6 72.7 73.5 72.5 72.5 74.1
K-L Financial, insurance and real estate activities 103.3 108.8 103.5 108.7 109.6 106.4 103.5
M Professional, scientific and technical activities 110.9 111.7 103.8 102.6 101.2 103.9 101.9
N Administrative and support service activities 82.2 66.7 66.5 65.9 67.2 62.2 59.1
O Public administration and defence; compulsory social security 102.7 106.3 105.7 107.7 105.3 107.2 106.0
P Education 139.1 153.9 150.5 150.4 139.2 148.0 147.5
Q Human health and social work activities 220.3 229.3 222.4 227.8 233.5 233.7 232.0
R-U Other NACE activities 104.9 104.2 101.1 98.7 103.3 101.4 98.2
Total persons 2,124.1 2,054.6 1,965.6 1,938.5 1,922.4 1,887.7 1,857.6
7
8. Table 3 Seasonally Adjusted Series1 of persons aged 15 years and over classified by sex,
ILO Economic Status and NACE Rev. 2 Economic Sector
ILO Economic Status/ Jan- Oct- Jan- Apr- Jul- Oct- Jan-
NACE Rev. 2 Economic Sector Mar 08 Dec 08 Mar 09 Jun 09 Sep 09 Dec 09 Mar 10
Males
In labour force 1,279.5 1,263.2 1,242.6 1,240.8 1,220.2 1,207.6 1,198.7
In employment: 1,207.1 1,141.8 1,084.5 1,056.8 1,029.6 1,014.4 1,003.7
A Agriculture, forestry and fishing 104.1 102.0 92.6 88.3 85.2 80.3 74.0
B-E Industry 206.7 200.8 190.2 184.5 177.1 178.0 179.6
F Construction 240.9 201.5 170.6 146.8 139.3 124.6 119.8
G Wholesale and retail trade; repair of motor vehicles and motorcycles 156.5 140.8 136.2 133.3 130.4 129.6 131.5
H Transportation and storage 77.7 74.6 77.5 78.2 78.2 76.1 76.2
I Accommodation and food service activities 55.6 50.8 51.7 54.8 54.2 56.8 55.7
J Information and communication 49.2 47.1 50.4 50.5 51.3 50.5 51.7
K-L Financial, insurance and real estate activities 43.7 46.1 45.5 48.1 47.6 49.3 49.6
M Professional, scientific and technical activities 63.4 66.5 64.5 63.6 62.2 61.9 61.1
N Administrative and support service activities 43.5 35.6 33.4 33.1 32.3 30.6 29.9
O Public administration and defence; compulsory social security 51.1 52.4 53.9 53.7 52.5 54.3 53.2
P Education 36.5 41.1 40.0 39.1 39.8 38.5 39.8
Q Human health and social work activities 37.7 39.2 38.4 41.0 40.4 42.1 43.3
R-U Other NACE activities 41.5 41.4 40.4 40.3 40.9 40.9 39.6
Unemployed 72.6 123.6 157.8 181.6 188.5 199.1 194.7
Unemployment rate % 5.6 9.8 12.7 14.6 15.5 16.5 16.3
Participation rate % 73.3 72.4 71.3 71.2 70.2 69.7 69.4
Females
In labour force 968.5 968.2 960.8 963.2 959.5 954.0 949.3
In employment: 930.2 911.0 893.9 887.0 877.4 871.1 866.5
A Agriculture, forestry and fishing 12.9 13.6 10.3 9.9 9.1 8.3 8.1
B-E Industry 79.8 76.9 76.4 73.6 70.7 69.9 66.5
F Construction 13.1 12.2 10.6 11.4 10.3 10.2 10.4
G Wholesale and retail trade; repair of motor vehicles and motorcycles 157.8 150.6 147.6 145.2 139.8 137.0 135.2
H Transportation and storage 16.7 16.2 16.3 16.4 16.9 17.5 17.2
I Accommodation and food service activities 75.5 66.9 66.5 65.9 65.5 66.4 68.1
J Information and communication 22.1 21.7 21.8 21.9 22.6 22.3 21.8
K-L Financial, insurance and real estate activities 61.6 61.3 60.3 60.4 61.4 55.7 56.3
M Professional, scientific and technical activities 48.3 44.3 40.4 38.8 39.1 40.9 42.3
N Administrative and support service activities 39.8 31.8 34.2 32.9 33.1 32.3 30.2
O Public administration and defence; compulsory social security 52.7 53.9 52.8 54.2 52.0 52.8 53.5
P Education 100.9 109.5 109.0 108.7 106.6 106.1 106.4
Q Human health and social work activities 184.4 189.2 186.1 187.8 191.0 190.6 191.0
R-U Other NACE activities 63.8 62.5 61.2 60.1 60.4 60.0 59.3
Unemployed 37.6 56.8 67.0 75.4 81.5 84.2 83.5
Unemployment rate % 3.9 5.9 7.0 7.8 8.5 8.9 8.8
Participation rate % 54.7 54.2 53.7 53.9 53.7 53.5 53.2
All persons
In labour force 2,247.5 2,231.1 2,202.9 2,204.8 2,179.7 2,161.3 2,147.6
In employment: 2,136.3 2,053.4 1,977.1 1,944.5 1,906.9 1,885.9 1,868.6
A Agriculture, forestry and fishing 117.1 115.3 103.1 98.2 94.4 88.4 82.2
B-E Industry 286.2 277.0 266.3 258.8 248.1 247.2 245.6
F Construction 254.4 213.4 181.7 158.7 149.1 134.6 130.5
G Wholesale and retail trade; repair of motor vehicles and motorcycles 313.8 291.5 283.3 278.7 270.3 266.8 266.2
H Transportation and storage 94.4 91.0 93.8 94.4 95.1 93.9 93.3
I Accommodation and food service activities 130.9 117.9 118.2 120.7 119.6 123.3 123.6
J Information and communication 71.4 69.0 72.3 72.3 73.6 73.2 73.6
K-L Financial, insurance and real estate activities 105.3 108.5 105.8 108.1 108.1 106.1 106.0
M Professional, scientific and technical activities 111.6 110.7 104.9 102.6 101.2 102.7 103.3
N Administrative and support service activities 82.5 68.0 66.7 66.1 65.6 63.4 59.3
O Public administration and defence; compulsory social security 103.9 106.0 106.9 107.5 104.7 106.8 107.2
P Education 137.5 150.6 149.0 148.0 146.3 144.7 146.1
Q Human health and social work activities 221.8 228.6 224.1 228.8 231.4 232.9 233.9
R-U Other NACE activities 105.3 103.9 101.7 100.5 101.2 101.0 99.0
Unemployed 110.4 181.2 224.7 256.8 269.2 284.7 277.4
Unemployment rate % 4.9 8.1 10.2 11.6 12.3 13.3 12.9
Participation rate % 63.9 63.2 62.5 62.4 61.9 61.5 61.2
1
See Background Notes.
8
9. Table 4 Persons aged 15 years and over in employment (ILO) classified by sex and occupation
'000
Broad occupational group Jan- Oct- Jan- Apr- Jul- Oct- Jan-
Mar 08 Dec 08 Mar 09 Jun 09 Sep 09 Dec 09 Mar 10
Males
1. Managers and administrators 229.1 223.5 215.7 219.1 217.6 212.6 202.3
2. Professional 120.0 128.5 122.4 122.4 121.2 125.5 127.5
3. Associate professional and technical 78.6 80.6 82.9 81.2 80.0 83.1 82.0
4. Clerical and secretarial 61.1 59.5 60.8 59.4 59.1 59.8 60.0
5. Craft and related 275.8 249.9 221.6 202.4 199.0 181.4 178.1
6. Personal and protective service 87.5 86.1 88.1 88.5 89.2 86.1 85.8
7. Sales 75.4 71.6 64.8 64.7 66.3 66.2 66.8
8. Plant and machine operatives 150.5 140.0 124.7 118.5 119.5 117.1 113.7
9. Other 121.0 103.7 95.6 95.8 88.1 84.4 80.1
Total males 1,198.9 1,143.4 1,076.7 1,052.0 1,040.0 1,016.2 996.3
Females
1. Managers and administrators 105.4 105.2 101.9 104.1 110.0 105.3 105.2
2. Professional 121.4 129.9 123.6 123.6 121.1 126.5 124.6
3. Associate professional and technical 117.4 119.4 111.8 111.1 113.7 111.8 112.1
4. Clerical and secretarial 194.5 189.4 188.5 187.4 182.6 182.8 183.4
5. Craft and related 12.8 11.6 10.8 8.2 8.6 9.2 9.3
6. Personal and protective service 155.7 152.9 156.3 153.5 156.7 151.7 150.1
7. Sales 118.4 111.0 106.6 106.4 104.2 101.6 98.0
8. Plant and machine operatives 25.7 25.2 25.0 21.7 21.6 20.7 19.6
9. Other 73.8 66.7 64.5 70.4 63.8 62.0 58.9
Total females 925.2 911.2 888.9 886.5 882.4 871.6 861.4
All persons
1. Managers and administrators 334.6 328.7 317.6 323.2 327.6 317.9 307.5
2. Professional 241.5 258.4 245.9 246.0 242.3 252.0 252.1
3. Associate professional and technical 196.0 200.1 194.7 192.3 193.7 194.8 194.1
4. Clerical and secretarial 255.6 248.9 249.3 246.8 241.8 242.6 243.4
5. Craft and related 288.6 261.5 232.3 210.6 207.6 190.7 187.5
6. Personal and protective service 243.1 239.0 244.5 242.0 245.9 237.8 235.9
7. Sales 193.8 182.6 171.4 171.1 170.5 167.8 164.9
8. Plant and machine operatives 176.2 165.2 149.7 140.2 141.1 137.8 133.3
9. Other 194.7 170.3 160.2 166.2 151.9 146.4 139.0
Total persons 2,124.1 2,054.6 1,965.6 1,938.5 1,922.4 1,887.7 1,857.6
9