Book Paid Saswad Call Girls Pune 8250192130Low Budget Full Independent High P...
Cifras sobre desempleo mundial mayo 2012 OCDE
1. Paris, 15 May 2012
OECD Harmonised Unemployment Rates
News Release: March 2012
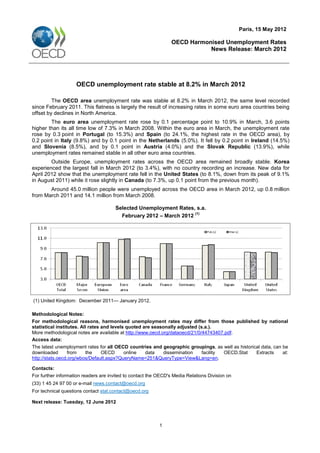
OECD unemployment rate stable at 8.2% in March 2012
The OECD area unemployment rate was stable at 8.2% in March 2012, the same level recorded
since February 2011. This flatness is largely the result of increasing rates in some euro area countries being
offset by declines in North America.
The euro area unemployment rate rose by 0.1 percentage point to 10.9% in March, 3.6 points
higher than its all time low of 7.3% in March 2008. Within the euro area in March, the unemployment rate
rose by 0.3 point in Portugal (to 15.3%) and Spain (to 24.1%, the highest rate in the OECD area), by
0.2 point in Italy (9.8%) and by 0.1 point in the Netherlands (5.0%). It fell by 0.2 point in Ireland (14.5%)
and Slovenia (8.5%), and by 0.1 point in Austria (4.0%) and the Slovak Republic (13.9%), while
unemployment rates remained stable in all other euro area countries.
Outside Europe, unemployment rates across the OECD area remained broadly stable. Korea
experienced the largest fall in March 2012 (to 3.4%), with no country recording an increase. New data for
April 2012 show that the unemployment rate fell in the United States (to 8.1%, down from its peak of 9.1%
in August 2011) while it rose slightly in Canada (to 7.3%, up 0.1 point from the previous month).
Around 45.0 million people were unemployed across the OECD area in March 2012, up 0.8 million
from March 2011 and 14.1 million from March 2008.
Selected Unemployment Rates, s.a.
(1)
February 2012 – March 2012
(1) United Kingdom: December 2011— January 2012.
Methodological Notes:
For methodological reasons, harmonised unemployment rates may differ from those published by national
statistical institutes. All rates and levels quoted are seasonally adjusted (s.a.).
More methodological notes are available at http://www.oecd.org/dataoecd/21/0/44743407.pdf.
Access data:
The latest unemployment rates for all OECD countries and geographic groupings, as well as historical data, can be
downloaded from the OECD online data dissemination facility OECD.Stat Extracts at:
http://stats.oecd.org/wbos/Default.aspx?QueryName=251&QueryType=View&Lang=en.
Contacts:
For further information readers are invited to contact the OECD's Media Relations Division on
(33) 1 45 24 97 00 or e-mail news.contact@oecd.org
For technical questions contact stat.contact@oecd.org
Next release: Tuesday, 12 June 2012
1
2. Paris, 15 May 2012
OECD Harmonised Unemployment Rates
News Release: March 2012
OECD Unemployment Rates, s.a.
Percentage of labour force
2009 2010 2011 2011 2012 2011 2012
Q2 Q3 Q4 Q1 Oct Nov Dec Jan Feb Mar
OECD - Total 8.4 8.6 8.2 8.2 8.2 8.2 8.2 8.2 8.2 8.2 8.2 8.2 8.2
Major Seven 8.1 8.2 7.7 7.7 7.7 7.6 7.5 7.7 7.6 7.6 7.5 7.5 7.4
European Union 9.0 9.7 9.7 9.5 9.7 10.0 10.2 9.9 10.0 10.0 10.1 10.2 10.2
Euro area 9.6 10.1 10.2 10.0 10.2 10.5 10.8 10.4 10.6 10.6 10.8 10.8 10.9
Australia 5.6 5.2 5.1 4.9 5.2 5.2 5.2 5.2 5.2 5.2 5.1 5.2 5.2
Austria 4.8 4.4 4.2 4.1 3.9 4.3 4.1 4.3 4.4 4.1 4.1 4.1 4.0
Belgium 7.9 8.3 7.2 7.1 7.3 7.2 7.3 7.2 7.2 7.1 7.3 7.3 7.3
(1)
Canada 8.3 8.0 7.4 7.5 7.2 7.4 7.4 7.4 7.5 7.5 7.6 7.4 7.2
Chile 10.8 8.2 7.1 6.9 7.2 7.0 6.6 7.4 7.0 6.9 6.8 6.6
Czech Republic 6.7 7.3 6.7 6.9 6.6 6.6 6.7 6.5 6.6 6.7 6.7 6.8 6.7
Denmark 6.1 7.5 7.6 7.5 7.5 7.8 8.0 7.7 7.8 7.8 7.9 7.9 8.1
Estonia 13.9 16.9 12.5 13.1 11.4 11.7 11.7 11.7 11.7
Finland 8.2 8.4 7.8 7.8 7.7 7.6 7.5 7.6 7.6 7.6 7.5 7.5 7.5
France 9.5 9.8 9.7 9.6 9.7 9.8 10.0 9.8 9.8 9.9 10.0 10.0 10.0
Germany 7.8 7.1 5.9 6.0 5.8 5.6 5.6 5.7 5.6 5.6 5.6 5.6 5.6
Greece 9.5 12.6 17.7 16.7 18.4 20.5 19.7 20.6 21.2 21.7
Hungary 10.0 11.2 10.9 10.9 10.9 10.9 11.2 10.9 10.9 11.0 11.3 11.1 11.2
Iceland 7.2 7.5 7.1 6.9 7.2 6.7 6.8
Ireland 11.9 13.7 14.5 14.2 14.7 14.7 14.6 14.7 14.8 14.7 14.7 14.7 14.5
(3)
Israel 7.5 6.7 5.6 5.6 5.6 5.4
Italy 7.8 8.4 8.5 8.2 8.4 9.1 9.6 8.8 9.2 9.3 9.5 9.6 9.8
Japan 5.1 5.1 4.6 4.6 4.4 4.5 4.6 4.4 4.5 4.5 4.6 4.5 4.5
Korea 3.6 3.7 3.4 3.4 3.2 3.1 3.5 3.1 3.1 3.1 3.2 3.7 3.4
Luxembourg 5.2 4.6 4.8 4.8 5.0 5.0 5.2 4.9 4.9 5.1 5.1 5.2 5.2
Mexico 5.5 5.3 5.2 5.5 5.3 5.0 5.0 4.8 5.1 5.0 4.8 5.2 5.1
Netherlands 3.7 4.5 4.4 4.2 4.4 4.9 5.0 4.8 4.9 4.9 5.0 4.9 5.0
New Zealand 6.1 6.5 6.5 6.5 6.6 6.4 6.7
Norway 3.1 3.5 3.3 3.3 3.2 3.4 3.4 3.4 3.3 3.2
Poland 8.2 9.6 9.7 9.6 9.7 10.0 10.1 9.9 10.0 10.0 10.1 10.1 10.1
Portugal 10.6 12.0 12.9 12.6 12.7 14.1 15.0 13.6 14.0 14.6 14.8 15.0 15.3
Slovak Republic 12.0 14.4 13.6 13.3 13.5 14.0 14.0 13.9 14.0 14.1 14.0 14.0 13.9
Slovenia 5.9 7.3 8.2 8.0 8.2 8.7 8.6 8.6 8.7 8.7 8.7 8.7 8.5
Spain 18.0 20.1 21.7 20.9 22.0 23.0 23.8 22.7 23.0 23.2 23.5 23.8 24.1
Sweden 8.3 8.4 7.5 7.5 7.3 7.5 7.5 7.5 7.4 7.5 7.6 7.5 7.3
Switzerland 4.1 4.2 3.8 3.4 3.9 3.8
Turkey 12.5 10.6 8.8 9.1 8.6 8.3 8.4 8.2 8.3
United Kingdom 7.6 7.8 8.0 7.9 8.2 8.3 8.3 8.3 8.3 8.2
(2)
United States 9.3 9.6 9.0 9.0 9.1 8.7 8.3 8.9 8.7 8.5 8.3 8.3 8.2
Notes:
(1) Canada: Unemployment rate for April 2012 was 7.3%
(2) United States: Unemployment rate for April 2012 was 8.1%
(3) The statistical data for Israel are supplied by and under the responsibility of the relevant Israeli authorities. The use of such
data by the OECD is without prejudice to the status of the Golan Heights, East Jerusalem and Israeli settlements in the West
Bank under the terms of international law.
2
3. Paris, 15 May 2012
OECD Harmonised Unemployment Rates
News Release: March 2012
OECD Unemployment Rates, s.a.
Change of rates over the same period of the previous year
2009 2010 2011 2011 2012 2011 2012
Q2 Q3 Q4 Q1 Oct Nov Dec Jan Feb Mar
OECD - Total 2.3 0.2 -0.4 -0.4 -0.3 -0.3 0.0 -0.3 -0.3 -0.2 -0.1 0.0 0.0
Major Seven 2.2 0.1 -0.5 -0.5 -0.4 -0.5 -0.2 -0.4 -0.6 -0.4 -0.3 -0.2 -0.3
European Union 1.9 0.7 0.0 -0.2 0.1 0.4 0.7 0.3 0.4 0.4 0.6 0.7 0.8
Euro area 2.0 0.5 0.1 -0.2 0.1 0.4 0.8 0.3 0.5 0.6 0.8 0.8 1.0
Australia 1.4 -0.4 -0.1 -0.4 0.0 0.1 0.2 -0.1 0.0 0.3 0.0 0.2 0.3
Austria 1.0 -0.4 -0.2 -0.4 -0.5 0.1 -0.2 0.1 0.3 -0.1 -0.3 -0.3 -0.2
Belgium 0.9 0.4 -1.1 -1.4 -1.0 -0.6 0.2 -0.8 -0.7 -0.5 0.0 0.2 0.3
(1)
Canada 2.2 -0.3 -0.6 -0.5 -0.8 -0.3 -0.3 -0.4 -0.1 -0.1 -0.1 -0.3 -0.4
Chile 3.0 -2.6 -1.1 -1.2 -0.6 -0.5 -0.7 0.0 -0.5 -0.8 -0.9 -0.7
Czech Republic 2.3 0.6 -0.6 -0.4 -0.5 -0.5 -0.2 -0.5 -0.4 -0.5 -0.2 -0.1 -0.2
Denmark 2.7 1.4 0.1 -0.1 0.2 0.2 0.5 0.1 0.1 0.2 0.3 0.4 0.6
Estonia 8.3 3.0 -4.4 -5.3 -4.9 -2.2 -2.2 -2.2 -2.2
Finland 1.8 0.2 -0.6 -0.7 -0.6 -0.5 -0.5 -0.5 -0.5 -0.4 -0.5 -0.5 -0.4
France 1.7 0.3 -0.1 -0.1 -0.1 0.1 0.4 0.1 0.1 0.2 0.4 0.4 0.4
Germany 0.3 -0.7 -1.2 -1.2 -1.1 -1.1 -0.7 -1.1 -1.1 -1.0 -0.8 -0.7 -0.6
Greece 1.8 3.1 5.1 4.6 5.5 6.4 5.9 6.6 6.7 7.0
Hungary 2.2 1.2 -0.3 -0.3 -0.2 -0.2 0.2 -0.3 -0.2 -0.1 0.0 0.2 0.5
Iceland 4.2 0.3 -0.4 -0.1 -0.6 -1.6 -0.6
Ireland 5.6 1.8 0.8 0.7 1.0 0.2 0.4 0.3 0.3 0.1 0.4 0.5 0.4
(3)
Israel 1.4 -0.8 -1.1 -1.0 -1.0 -1.0
Italy 1.1 0.6 0.1 -0.3 0.1 0.8 1.5 0.3 1.0 1.0 1.3 1.5 1.7
Japan 1.1 0.0 -0.5 -0.5 -0.6 -0.5 -0.2 -0.7 -0.5 -0.4 -0.3 -0.2 -0.2
Korea 0.4 0.1 -0.3 -0.1 -0.4 -0.3 -0.3 -0.4 -0.1 -0.4 -0.4 -0.2 -0.6
Luxembourg 0.3 -0.6 0.2 0.3 0.5 0.3 0.5 0.3 0.2 0.3 0.5 0.5 0.5
Mexico 1.5 -0.2 -0.1 0.0 0.1 -0.4 0.2 -0.6 -0.4 -0.5 -0.5 0.0 0.0
Netherlands 0.6 0.8 -0.1 -0.3 -0.1 0.5 0.7 0.4 0.5 0.6 0.7 0.6 0.8
New Zealand 1.9 0.4 0.0 -0.4 0.2 -0.3 0.1
Norway 0.6 0.4 -0.2 -0.3 -0.2 -0.1 -0.1 -0.2 -0.1 -0.2
Poland 1.0 1.4 0.1 0.0 0.2 0.4 0.7 0.3 0.4 0.4 0.7 0.8 0.7
Portugal 2.1 1.4 0.9 0.6 0.4 1.8 2.7 1.3 1.8 2.3 2.5 2.7 2.9
Slovak Republic 2.5 2.4 -0.8 -1.2 -0.9 0.1 0.6 -0.2 0.1 0.4 0.5 0.6 0.6
Slovenia 1.5 1.4 0.9 0.6 0.9 1.0 0.6 1.1 1.1 0.7 0.7 0.7 0.4
Spain 6.6 2.1 1.6 0.8 1.7 2.5 3.1 2.2 2.5 2.7 2.9 3.1 3.3
Sweden 2.1 0.1 -0.9 -1.1 -1.0 -0.4 -0.2 -0.5 -0.4 -0.3 -0.2 -0.1 -0.4
Switzerland 0.9 0.1 -0.4 -0.7 -0.5 -0.2
Turkey 2.8 -1.9 -1.8 -1.5 -1.9 -1.6 -1.9 -1.6 -1.4
United Kingdom 2.0 0.2 0.2 0.1 0.5 0.5 0.5 0.6 0.5 0.4
(2)
United States 3.5 0.3 -0.6 -0.6 -0.4 -0.9 -0.7 -0.6 -1.1 -0.9 -0.8 -0.7 -0.7
Notes:
(1) Canada: For April 2012 the change was -0.3
(2) United States: For April 2012 the change was -0.9
(3) The statistical data for Israel are supplied by and under the responsibility of the relevant Israeli authorities. The use of such
data by the OECD is without prejudice to the status of the Golan Heights, East Jerusalem and Israeli settlements in the West
Bank under the terms of international law.
3