1. Sample Project: 188888 PES Cost Report 7/18/2015
CONSTRUCTION BASELINE
Baseline Planned Progress $$
Jan 2015 Feb 2015 Mar 2015 Apr 2015 May 2015 June 2015 July 2015 Aug 2015 Sept 2015 Oct 2015 Nov 2015 Dec 2015 Jan 2016 Feb 2016 March 2016 Apr 2016 May 2016
Grand Total -$ 185,738.10$ 132,874.90$ 56,578.21$ 134,663.97$ 108,369.41$ 79,725.65$ 94,511.96$ 93,218.45$ 6,478.35$ 18,934.55$ -$
Cum Baseline Planned $$ Jan 2015 Feb 2015 Mar 2015 Apr 2015 May 2015 June 2015 July 2015 Aug 2015 Sept 2015 Oct 2015 Nov 2015 Dec 2015 Jan 2016 Feb 2016 Mar 2016 Apr 2016 May 2016
-$ -$ -$ -$ -$ 185,738.10$ 318,613.00$ 375,191.21$ 509,855.18$ 618,224.59$ 697,950.24$ 792,462.20$ 885,680.65$ 892,158.99$ 911,093.55$ 911,093.55$ 911,093.55$
Jan 2015 Feb 2015 Mar 2015 Apr 2015 May 2015 June 2015 July 2015 Aug 2015 Sept 2015 Oct 2015 Nov 2015 Dec 2015 Jan 2016 Feb 2016 Mar 2016 Apr 2016 May 2016
Earned $$ -$ -$ -$ -$ -$
**This information is pasted from FPMS**
Cum Baseline Plan % Jan 2015 Feb 2015 Mar 2015 Apr 2015 May 2015 June 2015 July 2015 Aug 2015 Sept 2015 Oct 2015 Nov 2015 Dec 2015 Jan 2016 Feb 2016 Mar 2016 Apr 2016 May 2016
*** Paste plan to Client Report 0.00% 0.00% 0.00% 0.00% 0.00% 20.39% 34.97% 41.18% 55.96% 67.86% 76.61% 86.98% 97.21% 97.92% 100.00% 100.00% 100.00%
Cum Complete % Jan 2015 Feb 2015 Mar 2015 Apr 2015 May 2015 June 2015 July 2015 Aug 2015 Sept 2015 Oct 2015 Nov 2015 Dec 2015 Jan 2016 Feb 2016 Mar 2016 Apr 2016 May 2016
*** Paste updates to Client Report 0.00% 0.00% 0.00% 0.00% 0.00%
ENGINEERING BASELINE
Baseline Planned Progress $$
Jan 2015 Feb 2015 Mar 2015 Apr 2015 May 2015 June 2015 July 2015 Aug 2015 Sept 2015 Oct 2015 Nov 2015 Dec 2015 Jan 2016 Feb 2016 Mar 2016 Apr 2016 May 2016
Grand Total 1,664.00$ 8,120.32$ 48,189.44$ 125,998.08$ 68,556.80$ 60,170.24$ 17,971.20$ 7,321.60$ 6,855.68$ 8,652.80$ 6,256.64$ 6,123.52$ 8,253.44$ 6,789.12$ 5,724.16$ 6,988.80$ 1,397.76$
Cum Baseline Planned $$ Jan 2015 Feb 2015 Mar 2015 Apr 2015 May 2015 June 2015 July 2015 Aug 2015 Sept 2015 Oct 2015 Nov 2015 Dec 2015 Jan 2016 Feb 2016 Mar 2016 Apr 2016 May 2016
1,664.00$ 9,784.32$ 57,973.76$ 183,971.84$ 252,528.64$ 312,698.88$ 330,670.08$ 337,991.68$ 344,847.36$ 353,500.16$ 359,756.80$ 365,880.32$ 374,133.76$ 380,922.88$ 386,647.04$ 393,635.84$ 395,033.60$
Jan 2015 Feb 2015 Mar 2015 Apr 2015 May 2015 June 2015 July 2015 Aug 2015 Sept 2015 Oct 2015 Nov 2015 Dec 2015 Jan 2016 Feb 2016 Mar 2016 Apr 2016 May 2016
Earned $$ 1,730.56$ 8,719.36$ 51,251.20$ 90,321.92$ 90,321.32$
Cum Baseline Plan % Jan 2015 Feb 2015 Mar 2015 Apr 2015 May 2015 June 2015 July 2015 Aug 2015 Sept 2015 Oct 2015 Nov 2015 Dec 2015 Jan 2016 Feb 2016 Mar 2016 Apr 2016 May 2016
*** Paste plan to Client Report 0.42% 2.48% 14.68% 46.57% 63.93% 79.16% 83.71% 85.56% 87.30% 89.49% 91.07% 92.62% 94.71% 96.43% 97.88% 99.65% 100.00%
Cum Complete % Jan 2015 Feb 2015 Mar 2015 Apr 2015 May 2015 June 2015 July 2015 Aug 2015 Sept 2015 Oct 2015 Nov 2015 Dec 2015 Jan 2016 Feb 2016 Mar 2016 Apr 2016 May 2016
*** Paste updates to Client Report 0.44% 2.21% 12.97% 22.86%
PROCUREMENT BASELINE
Baseline Planned Progress $$
Jan 2015 Feb 2015 Mar 2015 Apr 2015 May 2015 June 2015 July 2015 Aug 2015 Sept 2015 Oct 2015 Nov 2015 Dec 2015 Jan 2016 Feb 2016 March 2016 Apr 2016 March 2016
Grand Total 214,800.00$ 655,778.60$ 104,352.17$ 149,112.64$ 35,228.97$ 951,025.20$ 1,547,133.36$ 311,574.08$ 996,464.00$ 260,483.18$ 9,742.00$ 120,535.45$ -$ -$
Cum Baseline Planned $$ Jan 2015 Feb 2015 Mar 2015 Apr 2015 May 2015 June 2015 July 2015 Aug 2015 Sept 2015 Oct 2015 Nov 2015 Dec 2015 Jan 2016 Feb 2016 Mar 2016 Apr 2016 May 2016
-$ -$ 214,800.00$ 870,578.60$ 974,930.77$ 1,124,043.42$ 1,159,272.39$ 2,110,297.59$ 3,657,430.95$ 3,969,005.03$ 4,965,469.03$ 5,225,952.21$ 5,235,694.21$ 5,356,229.66$ 5,356,229.66$ 5,356,229.66$ 5,356,229.66$
Jan 2015 Feb 2015 Mar 2015 Apr 2015 May 2015 June 2015 July 2015 Aug 2015 Sept 2015 Oct 2015 Nov 2015 Dec 2015 Jan 2016 Feb 2016 Mar 2016 Apr 2016 May 2016
Cum Earned $$ -$ -$ 214,800.00$ 870,578.60$ 974,930.77$
Cum Baseline Plan % Jan 2015 Feb 2015 Mar 2015 Apr 2015 May 2015 June 2015 July 2015 Aug 2015 Sept 2015 Oct 2015 Nov 2015 Dec 2015 Jan 2016 Feb 2016 Mar 2016 Apr 2016 May 2016
*** Paste plan to Client Report 0.00% 0.00% 4.01% 16.25% 18.20% 20.99% 21.64% 39.40% 68.28% 74.10% 92.70% 97.57% 97.75% 100.00% 100.00% 100.00% 100.00%
Cum Complete % Jan 2015 Feb 2015 Mar 2015 Apr 2015 May 2015 June 2015 July 2015 Aug 2015 Sept 2015 Oct 2015 Nov 2015 Dec 2015 Jan 2016 Feb 2016 Mar 2016 Apr 2016 May 2016
*** Paste updates to Client Report 0.00% 0.00% 4.01% 16.25% 18.20%
TOTAL
Cum Baseline Planned $$ Jan 2015 Feb 2015 Mar 2015 Apr 2015 May 2015 June 2015 July 2015 Aug 2015 Sept 2015 Oct 2015 Nov 2015 Dec 2015 Jan 2016 Feb 2016 Mar 2016 Apr 2016 May 2016
1,664.00$ 9,784.32$ 272,773.76$ 1,054,550.44$ 1,227,459.41$ 1,622,480.40$ 1,808,555.47$ 2,823,480.48$ 4,512,133.48$ 4,940,729.78$ 6,023,176.07$ 6,384,294.73$ 6,495,508.61$ 6,629,311.53$ 6,653,970.25$ 6,660,959.05$ 6,662,356.81$
Jan 2015 Feb 2015 Mar 2015 Apr 2015 May 2015 June 2015 July 2015 Aug 2015 Sept 2015 Oct 2015 Nov 2015 Dec 2015 Jan 2016 Feb 2016 Mar 2016 Apr 2016 May 2016
Earned $$ 1,730.56$ 8,719.36$ 266,051.20$ 960,900.52$ 1,065,252.09$ -$ -$ -$ -$ -$ -$ -$ -$ -$ -$ -$
Cum Baseline Plan % Jan 2015 Feb 2015 Mar 2015 Apr 2015 May 2015 June 2015 July 2015 Aug 2015 Sept 2015 Oct 2015 Nov 2015 Dec 2015 Jan 2016 Feb 2016 Mar 2016 Apr 2016 May 2016
*** Paste plan to Client Report 0.02% 0.15% 4.09% 15.83% 18.42% 24.35% 27.15% 42.38% 67.73% 74.16% 90.41% 95.83% 97.50% 99.50% 99.87% 99.98% 100.00%
Cum Complete % Jan 2015 Feb 2015 Mar 2015 Apr 2015 May 2015 June 2015 July 2015 Aug 2015 Sept 2015 Oct 2015 Nov 2015 Dec 2015 Jan 2016 Feb 2016 Mar 2016 Apr 2016 May 2016
*** Paste updates to Client Report 0.03% 0.13% 3.99% 14.42% 15.99%
Weighted % Jan 2015 Feb 2015 Mar 2015 Apr 2015 May 2015 June 2015 July 2015 Aug 2015 Sept 2015 Oct 2015 Nov 2015 Dec 2015 Jan 2016 Feb 2016 Mar 2016 Apr 2016 Mar 2016
Construction - Plan % 0.00% 0.00% 0.00% 0.00% 0.00% 2.79% 4.78% 5.63% 7.65% 9.28% 10.48% 11.89% 13.29% 13.39% 13.68% 13.68% 13.68%
Construction - Complete % 0.00% 0.00% 0.00% 0.00% 0.00% 0.00% 0.00% 0.00% 0.00% 0.00% 0.00% 0.00% 0.00% 0.00% 0.00% 0.00% 0.00%
Weighted % Jan 2015 Feb 2015 Mar 2015 Apr 2015 May 2015 June 2015 July 2015 Aug 2015 Sept 2015 Oct 2015 Nov 2015 Dec 2015 Jan 2016 Feb 2016 Mar 2016 Apr 2016 Mar 2016
Engineering - Plan % 0.02% 0.15% 0.87% 2.76% 3.79% 4.69% 4.96% 5.07% 5.18% 5.31% 5.40% 5.49% 5.62% 5.72% 5.80% 5.91% 5.93%
Engineering - Complete % 0.03% 0.13% 0.77% 1.36% 1.36% 0.00% 0.00% 0.00% 0.00% 0.00% 0.00% 0.00% 0.00% 0.00% 0.00% 0.00% 0.00%
Weighted % Jan 2015 Feb 2015 Mar 2015 Apr 2015 May 2015 June 2015 July 2015 Aug 2015 Sept 2015 Oct 2015 Nov 2015 Dec 2015 Jan 2016 Feb 2016 Mar 2016 Apr 2016 Mar 2016
Procurement - Plan % 0.00% 0.00% 3.22% 13.07% 14.63% 16.87% 17.40% 31.67% 54.90% 59.57% 74.53% 78.44% 78.59% 80.40% 80.40% 80.40% 80.40%
Procurement - Complete % 0.00% 0.00% 3.22% 13.07% 14.63% 0.00% 0.00% 0.00% 0.00% 0.00% 0.00% 0.00% 0.00% 0.00% 0.00% 0.00% 0.00%
TOTAL Weighted %
(check against "Cum Complete %") 0.03% 0.13% 3.99% 14.42% 15.99% 0.00% 0.00% 0.00% 0.00% 0.00%
**This information is pasted from BV Engineering plan/earn file**
**This information is pasted from the FPMS**
May 2015 June 2015 July 2015 Aug 2015 Sept 2015 Oct 2015 Nov 2015 Dec 2015 Jan 2016 Feb 2016 Mar 2016 Apr 2016 May 2016
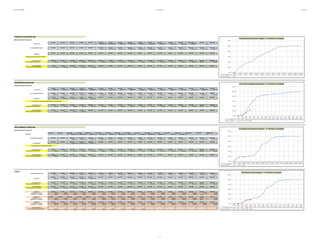
Cum Baseline Plan % 0.00% 20.39% 34.97% 41.18% 55.96% 67.86% 76.61% 86.98% 97.21% 97.92% 100.00% 100.00% 100.00%
Cum Complete % 0.00%
0.00%
20.00%
40.00%
60.00%
80.00%
100.00%
120.00%
Cumulative Construction Progress - % Planned vs Complete
Jan
2015
Feb
2015
Mar
2015
Apr
2015
May
2015
June
2015
July
2015
Aug
2015
Sept
2015
Oct
2015
Nov
2015
Dec
2015
Jan
2016
Feb
2016
Mar
2016
Apr
2016
May
2016
Cum Baseline Plan % 0.42% 2.48% 14.68% 46.57% 63.93% 79.16% 83.71% 85.56% 87.30% 89.49% 91.07% 92.62% 94.71% 96.43% 97.88% 99.65% 100.00%
Cum Complete % 0.44% 2.21% 12.97% 22.86%
0.00%
20.00%
40.00%
60.00%
80.00%
100.00%
120.00%
Cumulative Engingeering Progress - % Planned vs Complete
Mar 2015 Apr 2015 May 2015 June 2015 July 2015 Aug 2015 Sept 2015 Oct 2015 Nov 2015 Dec 2015 Jan 2016 Feb 2016 Mar 2016 Apr 2016 May 2016
Cum Baseline Plan % 4.01% 16.25% 18.20% 20.99% 21.64% 39.40% 68.28% 74.10% 92.70% 97.57% 97.75% 100.00% 100.00% 100.00% 100.00%
Cum Complete % 4.01% 16.25% 18.20%
0.00%
20.00%
40.00%
60.00%
80.00%
100.00%
120.00%
Cumulative Procurement Progress - % Planned vs Complete
Jan 2015
Feb
2015
Mar
2015
Apr
2015
May
2015
June
2015
July
2015
Aug
2015
Sept
2015
Oct
2015
Nov
2015
Dec
2015
Jan 2016
Feb
2016
Mar
2016
Apr
2016
May
2016
Cum Baseline Plan % 0.02% 0.15% 4.09% 15.83% 18.42% 24.35% 27.15% 42.38% 67.73% 74.16% 90.41% 95.83% 97.50% 99.50% 99.87% 99.98% 100.00%
Cum Complete % 0.03% 0.13% 3.99% 14.42% 15.99%
0.00%
20.00%
40.00%
60.00%
80.00%
100.00%
120.00%
Total Construction Progress - % Planned vs Complete
1 of 1