Png comparative study 2014
•Als PPTX, PDF herunterladen•
1 gefällt mir•176 views

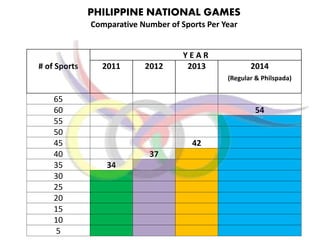
The document shows comparative data on the number of sports, local government unit and organization participation, and athlete participation in various sports from 2011-2013 for the Philippine National Games. The number of sports decreased from 65 in 2011 to 42 in 2013. Participation of local governments and organizations declined from 500 in 2011 to 221 in 2013. Most sports had decreasing participation levels over the three years, with a few like archery, badminton and taekwondo showing slight increases in participation from 2011-2013.

Empfohlen
Weitere ähnliche Inhalte
Andere mochten auch
Andere mochten auch (10)
Kürzlich hochgeladen
Kürzlich hochgeladen (20)
Png comparative study 2014
- 1. PHILIPPINE NATIONAL GAMES Comparative Number of Sports Per Year Y E A R # of Sports 2011 2012 2013 2014 (Regular & Philspada) 65 60 54 55 50 45 42 40 37 35 34 30 25 20 15 10 5
- 2. PHILIPPINE NATIONAL GAMES Comparative Number of LGUs and Sports Clubs/Organization Per Year # of LGUs, Clubs,Organizations Y E A R 2011 2012 2013 500 450 436 400 388 350 300 250 221 200 150 100 50 Note: The number of LGUs was determined based on via online and walk-in registrations and were not similar with the actual attendance
- 3. PHILIPPINE NATIONAL GAMES Comparative Growth of Participation ARCHERY 2011 2012 2013 36 Sports 37 Sports 42 Sports Bacolod City Dumaguete City Manila RANGE 120 117 110 100 90 85 80 70 60 50 40 33 30 20 10 2011 2012 2013
- 4. PHILIPPINE NATIONAL GAMES Comparative Growth of Participation ARNIS 2011 2012 2013 36 Sports 37 Sports 42 Sports Bacolod City Dumaguete City Manila RANGE 270 264 260 250 240 230 220 210 200 190 180 170 160 150 140 130 120 110 108 100 90 80 70 60 50 40 30 20 10 NO LIST 2011 2012 2013
- 5. PHILIPPINE NATIONAL GAMES Comparative Growth of Participation ATHLETICS 2011 2012 2013 36 Sports 37 Sports 42 Sports Bacolod City Dumaguete City Manila RANGE 1300 1262 1250 1200 1150 1100 1050 1000 950 900 850 800 750 700 650 600 550 500 450 400 382 350 300 250 224 200 150 100 50 2011 2012 2013
- 6. PHILIPPINE NATIONAL GAMES Comparative Growth of Participation BADMINTON 2011 2012 2013 36 Sports 37 Sports 42 Sports Bacolod City Dumaguete City Manila RANGE 300 295 290 280 270 260 250 240 238 230 220 210 200 190 180 170 160 150 140 130 120 110 103 100 90 80 70 60 50 40 30 20 10 2011 2012 2013
- 7. PHILIPPINE NATIONAL GAMES Comparative Growth of Participation BASEBALL 2011 2012 2013 36 Sports 37 Sports 42 Sports Bacolod City Dumaguete City Manila RANGE 280 271 270 260 250 240 230 220 216 210 200 190 180 170 160 150 140 130 120 110 100 90 80 70 60 50 40 30 20 20 10 2011 2012 2013
- 8. PHILIPPINE NATIONAL GAMES Comparative Growth of Participation BASKETBALL 2011 2012 2013 36 Sports 37 Sports 42 Sports Bacolod City Dumaguete City Manila RANGE 130 125 120 110 100 90 80 70 60 50 40 30 20 10 NOT PLAYED NOT PLAYED 2011 2012 2013
- 9. PHILIPPINE NATIONAL GAMES Comparative Growth of Participation BEACH VOLLEYBALL 2011 2012 2013 36 Sports 37 Sports 42 Sports Bacolod City Dumaguete City Manila RANGE 100 90 90 80 70 60 50 46 40 32 30 20 10 2011 2012 2013
- 10. PHILIPPINE NATIONAL GAMES Comparative Growth of Participation BILLIARDS 2011 2012 2013 36 Sports 37 Sports 42 Sports Bacolod City Dumaguete City Manila RANGE 80 76 70 68 66 60 50 40 30 20 10 2011 2012 2013
- 11. PHILIPPINE NATIONAL GAMES Comparative Growth of Participation BOWLING 2011 2012 2013 36 Sports 37 Sports 42 Sports Bacolod City Dumaguete City Manila RANGE 130 129 120 110 100 90 80 70 60 54 50 40 30 20 10 NOT PLAYED 2011 2012 2013
- 12. PHILIPPINE NATIONAL GAMES Comparative Growth of Participation BOXING 2011 2012 2013 36 Sports 37 Sports 42 Sports Bacolod City Dumaguete City Manila RANGE 130 125 120 110 100 99 90 80 70 60 50 40 30 20 10 NO LIST 2011 2012 2013
- 13. PHILIPPINE NATIONAL GAMES Comparative Growth of Participation CANOE-KAYAK 2011 2012 2013 36 Sports 37 Sports 42 Sports Bacolod City Dumaguete City Manila RANGE 60 56 50 44 40 30 20 14 10 2011 2012 2013
- 14. PHILIPPINE NATIONAL GAMES Comparative Growth of Participation CHESS 2011 2012 2013 36 Sports 37 Sports 42 Sports Bacolod City Dumaguete City Manila RANGE 210 200 200 190 180 170 164 160 150 140 130 120 110 100 90 80 70 60 50 40 30 20 10 NOT PLAYED 2011 2012 2013
- 15. PHILIPPINE NATIONAL GAMES Comparative Growth of Participation CYCLING 2011 2012 2013 36 Sports 37 Sports 42 Sports Bacolod City Dumaguete City Manila RANGE 100 93 90 80 70 60 51 50 40 30 20 10 NOT PLAYED 2011 2012 2013
- 16. PHILIPPINE NATIONAL GAMES Comparative Growth of Participation DANCESPORT 2011 2012 2013 36 Sports 37 Sports 42 Sports Bacolod City Dumaguete City Manila RANGE 210 205 200 190 180 170 160 157 150 140 130 120 110 100 90 80 70 60 50 40 30 25 20 19 10 NOT PLAYED 2011 2012 2013
- 17. PHILIPPINE NATIONAL GAMES Comparative Growth of Participation DIVING 2011 2012 2013 36 Sports 37 Sports 42 Sports Bacolod City Dumaguete City Manila RANGE 30 25 20 19 10 NOT PLAYED 2011 2012 2013
- 18. PHILIPPINE NATIONAL GAMES Comparative Growth of Participation FENCING 2011 2012 2013 36 Sports 37 Sports 42 Sports Bacolod City Dumaguete City Manila RANGE 180 178 170 160 150 140 138 130 120 110 100 90 80 70 60 50 40 40 30 20 10 2011 2012 2013
- 19. PHILIPPINE NATIONAL GAMES Comparative Growth of Participation FOOTBALL 2011 2012 2013 36 Sports 37 Sports 42 Sports Bacolod City Dumaguete City Manila RANGE 90 88 80 70 60 53 50 44 40 30 20 10 2011 2012 2013
- 20. PHILIPPINE NATIONAL GAMES Comparative Growth of Participation FUTSAL 2011 2012 2013 36 Sports 37 Sports 42 Sports Bacolod City Dumaguete City Manila RANGE 250 247 240 230 220 210 200 190 180 180 170 160 150 140 130 120 110 100 95 90 80 70 60 50 40 30 20 10 2011 2012 2013
- 21. PHILIPPINE NATIONAL GAMES Comparative Growth of Participation GYMNASTICS 2011 2012 2013 36 Sports 37 Sports 42 Sports RANGE Bacolod City Dumaguete City Manila 400 380 377 360 340 320 300 280 260 240 220 200 180 160 140 120 106 100 80 60 40 28 20 2011 2012 2013
- 22. PHILIPPINE NATIONAL GAMES Comparative Growth of Participation JUDO 2011 2012 2013 36 Sports 37 Sports 42 Sports Bacolod City Dumaguete City Manila RANGE 300 293 290 280 270 260 250 240 230 220 210 200 190 180 170 167 160 150 140 130 120 110 100 90 80 70 60 50 45 40 30 20 10 2011 2012 2013
- 23. PHILIPPINE NATIONAL GAMES Comparative Growth of Participation KARATEDO 2011 2012 2013 36 Sports 37 Sports 42 Sports Bacolod City Dumaguete City Manila RANGE 190 186 186 180 170 160 150 140 130 120 110 100 90 80 70 60 56 50 40 30 20 10 2011 2012 2013
- 24. PHILIPPINE NATIONAL GAMES Comparative Growth of Participation LAWN TENNIS 2011 2012 2013 36 Sports 37 Sports 42 Sports Bacolod City Dumaguete City Manila RANGE 120 116 110 100 90 80 70 60 50 40 30 23 26 20 10 2011 2012 2013
- 25. PHILIPPINE NATIONAL GAMES Comparative Growth of Participation MOTOCROSS 2011 2012 2013 36 Sports 37 Sports 42 Sports Bacolod City Dumaguete City Manila RANGE 160 148 150 140 130 120 110 100 90 80 70 60 50 40 30 20 10 NOT PLAYED NO LIST 2011 2012 2013
- 26. PHILIPPINE NATIONAL GAMES Comparative Growth of Participation MUAYTHAI 2011 2012 2013 36 Sports 37 Sports 42 Sports Bacolod City Dumaguete City Manila RANGE 60 50 50 40 30 30 20 10 NOT PLAYED 2011 2012 2013
- 27. PHILIPPINE NATIONAL GAMES Comparative Growth of Participation PENCAK SILAT 2011 2012 2013 36 Sports 37 Sports 42 Sports Bacolod City Dumaguete City Manila RANGE 150 142 140 130 123 120 110 100 97 90 80 70 60 50 40 30 20 10 2011 2012 2013
- 28. PHILIPPINE NATIONAL GAMES Comparative Growth of Participation POWERLIFTING 2011 2012 2013 36 Sports 37 Sports 42 Sports Bacolod City Dumaguete City Manila RANGE 110 102 100 90 80 70 60 50 40 30 20 10 NOT PLAYED NOT PLAYED 2011 2012 2013
- 29. PHILIPPINE NATIONAL GAMES Comparative Growth of Participation RUGBY FOOTBALL 2011 2012 2013 36 Sports 37 Sports 42 Sports Bacolod City Dumaguete City Manila RANGE 180 177 170 160 150 140 130 120 110 100 90 80 70 60 50 40 30 20 10 NOT PLAYED NO LIST 2011 2012 2013
- 30. PHILIPPINE NATIONAL GAMES Comparative Growth of Participation SAILING 2011 2012 2013 36 Sports 37 Sports 42 Sports Bacolod City Dumaguete City Manila RANGE 50 49 40 31 30 20 10 NO LIST 2011 2012 2013
- 31. PHILIPPINE NATIONAL GAMES Comparative Growth of Participation SEPAK TAKRAW 2011 2012 2013 36 Sports 37 Sports 42 Sports Bacolod City Dumaguete City Manila RANGE 330 322 320 310 300 290 280 270 260 250 240 230 220 210 200 190 180 170 160 150 140 138 130 120 110 100 90 80 70 65 60 50 40 30 20 10 2011 2012 2013
- 32. PHILIPPINE NATIONAL GAMES Comparative Growth of Participation SHOOTING 2011 2012 2013 36 Sports 37 Sports 42 Sports Bacolod City Dumaguete City Manila RANGE 50 41 40 32 30 20 10 NOT PLAYED 2011 2012 2013
- 33. PHILIPPINE NATIONAL GAMES Comparative Growth of Participation SOFT TENNIS 2011 2012 2013 36 Sports 37 Sports 42 Sports Bacolod City Dumaguete City Manila RANGE 120 110 110 100 90 80 70 71 60 50 40 36 30 20 10 2011 2012 2013
- 34. PHILIPPINE NATIONAL GAMES Comparative Growth of Participation SOFTBALL 2011 2012 2013 36 Sports 37 Sports 42 Sports Bacolod City Dumaguete City Manila RANGE 290 279 280 270 260 250 242 240 230 220 210 200 190 180 170 160 150 140 130 120 110 100 90 80 70 71 60 50 40 34 30 20 10 2011 2012 2013
- 35. PHILIPPINE NATIONAL GAMES Comparative Growth of Participation SWIMMING 2011 2012 2013 36 Sports 37 Sports 42 Sports Bacolod City Dumaguete City Manila RANGE 180 172 170 159 160 150 140 130 120 110 100 90 80 79 70 60 50 40 30 20 10 2011 2012 2013
- 36. PHILIPPINE NATIONAL GAMES Comparative Growth of Participation TABLE TENNIS 2011 2012 2013 36 Sports 37 Sports 42 Sports Bacolod City Dumaguete City Manila RANGE 220 216 210 200 190 180 170 160 150 140 130 120 111 110 100 90 80 70 68 60 50 40 30 20 10 2011 2012 2013
- 37. PHILIPPINE NATIONAL GAMES Comparative Growth of Participation TAEKWONDO 2011 2012 2013 36 Sports 37 Sports 42 Sports Bacolod City Dumaguete City Manila RANGE 300 298 290 280 270 260 250 240 230 220 210 200 190 180 170 164 160 150 140 130 120 110 100 90 80 78 70 60 50 40 30 20 10 2011 2012 2013
- 38. PHILIPPINE NATIONAL GAMES Comparative Growth of Participation TRIATHLON 2011 2012 2013 36 Sports 37 Sports 42 Sports Bacolod City Dumaguete City Manila RANGE 90 85 80 70 60 50 40 30 13 20 7 10 2011 2012 2013
- 39. PHILIPPINE NATIONAL GAMES Comparative Growth of Participation VOLLEYBALL (INDOOR) 2011 2012 2013 36 Sports 37 Sports 42 Sports Bacolod City Dumaguete City Manila RANGE 350 344 340 330 320 310 300 290 280 270 260 250 240 230 220 210 200 190 180 170 167 160 150 140 130 123 120 110 100 90 80 70 60 50 40 30 20 10 2011 2012 2013
- 40. PHILIPPINE NATIONAL GAMES Comparative Growth of Participation WALL CLIMBING 2011 2012 2013 36 Sports 37 Sports 42 Sports Bacolod City Dumaguete City Manila RANGE 20 17 10 NO LIST NOT PLAYED 2011 2012 2013
- 41. PHILIPPINE NATIONAL GAMES Comparative Growth of Participation WEIGHTLIFTING 2011 2012 2013 36 Sports 37 Sports 42 Sports Bacolod City Dumaguete City Manila RANGE 140 130 130 120 110 101 100 90 80 70 60 50 47 40 30 20 10 2011 2012 2013
- 42. PHILIPPINE NATIONAL GAMES Comparative Growth of Participation WINDSURFING 2011 2012 2013 36 Sports 37 Sports 42 Sports Bacolod City Dumaguete City Manila RANGE 50 42 40 30 20 10 10 Not Played 2011 2012 2013
- 43. PHILIPPINE NATIONAL GAMES Comparative Growth of Participation WRESTLING 2011 2012 2013 36 Sports 37 Sports 42 Sports Bacolod City Dumaguete City Manila RANGE 140 130 130 120 110 100 90 80 70 66 60 50 41 40 30 20 10 2011 2012 2013
- 44. PHILIPPINE NATIONAL GAMES Comparative Growth of Participation WUSHU 2011 2012 2013 36 Sports 37 Sports 42 Sports Bacolod City Dumaguete City Manila RANGE 240 236 230 220 210 200 190 180 170 160 150 140 133 130 120 110 100 90 80 70 60 50 40 30 21 20 10 2011 2012 2013