Electrolux Interim Report Q2 2010
•
0 gefällt mir•463 views

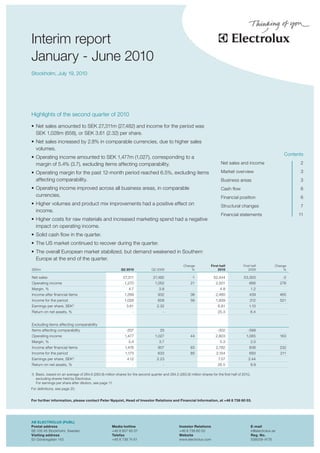
Highlights of the second quarter of 2010. Net sales amounted to SEK 27,311m (27,482) and income for the period was SEK 1,028m (658), or SEK 3.61 (2.32) per share. Net sales increased by 2.8% in comparable currencies, due to higher sales volumes.

Empfohlen
Weitere ähnliche Inhalte
Was ist angesagt?
Was ist angesagt? (18)
Ähnlich wie Electrolux Interim Report Q2 2010
Ähnlich wie Electrolux Interim Report Q2 2010 (20)
Mehr von Electrolux Group
Mehr von Electrolux Group (20)
Kürzlich hochgeladen
Kürzlich hochgeladen (20)
Electrolux Interim Report Q2 2010
- 1. theas Interim report January - June 2010 Stockholm, July 19, 2010 Highlights of the second quarter of 2010 • Net sales amounted to SEK 27,311m (27,482) and income for the period was SEK 1,028m (658), or SEK 3.61 (2.32) per share. • Net sales increased by 2.8% in comparable currencies, due to higher sales volumes. Contents • Operating income amounted to SEK 1,477m (1,027), corresponding to a margin of 5.4% (3.7), excluding items affecting comparability. Net sales and income 2 • Operating margin for the past 12-month period reached 6.5%, excluding items Market overview 3 affecting comparability. Business areas 3 • Operating income improved across all business areas, in comparable Cash flow 6 currencies. Financial position 6 • Higher volumes and product mix improvements had a positive effect on Structural changes 7 income. Financial statements 11 • Higher costs for raw materials and increased marketing spend had a negative impact on operating income. • Solid cash flow in the quarter. • The US market continued to recover during the quarter. • The overall European market stabilized, but demand weakened in Southern Europe at the end of the quarter. Change First half First half Change SEKm Q2 2010 Q2 2009 % 2010 2009 % Net sales 27,311 27,482 -1 52,444 53,300 -2 Operating income 1,270 1,052 21 2,501 666 276 Margin, % 4.7 3.8 4.8 1.2 Income after financial items 1,269 932 36 2,480 439 465 Income for the period 1,028 658 56 1,939 312 521 Earnings per share, SEK1) 3.61 2.32 6.81 1.10 Return on net assets, % - - 25.3 6.4 Excluding items affecting comparability Items affecting comparability -207 25 -302 -399 Operating income 1,477 1,027 44 2,803 1,065 163 Margin, % 5.4 3.7 5.3 2.0 Income after financial items 1,476 907 63 2,782 838 232 Income for the period 1,173 633 85 2,154 693 211 Earnings per share, SEK1) 4.12 2.23 7.57 2.44 Return on net assets, % - - 26.5 9.9 1) Basic, based on an average of 284.6 (283.9) million shares for the second quarter and 284.5 (283.8) million shares for the first half of 2010, excluding shares held by Electrolux. For earnings per share after dilution, see page 11. For definitions, see page 20. For further information, please contact Peter Nyquist, Head of Investor Relations and Financial Information, at +46 8 738 60 03. AB ELECTROLUX (PUBL) Postal address Media hotline Investor Relations E-mail SE-105 45 Stockholm, Sweden +46 8 657 65 07 +46 8 738 60 03 ir@electrolux.se Visiting address Telefax Website Reg. No. S:t Göransgatan 143 +46 8 738 74 61 www.electrolux.com 556009-4178
- 2. 2 Interim report January - June 2010 Net sales and income First half of 2010 Net sales for the Electrolux Group in the first half of 2010 amounted Second quarter of 2010 to SEK 52,444m, as against SEK 53,300m in the previous year. In Net sales for the Electrolux Group in the second quarter of 2010 comparable currencies, net sales increased by 3.5%. amounted to SEK 27,311m (27,482). Higher sales volumes due to strong sales growth in North America, Asia/Pacific and Latin Ame- Operating income rica had a positive impact on sales, while changes in exchange Operating income for the first half of 2010 increased to SEK 2,501m rates had a negative impact. Net sales increased by 2.8% in com- (666) and income after financial items to SEK 2,480m (439). Income parable currencies. for the period increased to SEK 1,939m (312), corresponding to SEK 6.81 (1.10) in earnings per share. Change in net sales Operating income for the first half of 2009 was negatively impac- First half % Q2 2010 2010 ted by the North American launch in the net amount of Changes in exchange rates -3.4 -5.1 SEK -200m. Changes in volume/price/mix 2.8 3.5 Total -0.6 -1.6 Items affecting comparability Operating income for the first half of 2010 includes items affecting Operating income comparability in the amount of SEK -302m (-399), see table on Operating income for the second quarter of 2010 increased to page 11. Excluding items affecting comparability, operating income SEK 1,270m (1,052) and income after financial items to SEK 1,269m for the first half of 2010 increased to SEK 2,803m (1,065) and (932). A positive mix development, increased volumes, previous income after financial items to SEK 2,782m (838). Income for the restructuring and cost-saving initiatives contributed to the improve- period was SEK 2,154m (693), corresponding to SEK 7.57 (2.44) in ment in income. Income for the period amounted to SEK 1,028m earnings per share. (658), corresponding to SEK 3.61 (2.32) in earnings per share. Effects of changes in exchange rates Items affecting comparability Changes in exchange rates compared to the previous year, inclu- Operating income for the second quarter of 2010 includes items ding both translation, transaction effects and hedging contracts, affecting comparability in the amount of SEK -207m (25), referring to had an impact of approximately SEK 560m on operating income for restructuring provisions related to efficiency improvements within the first half of 2010. Transaction effects amounted to approxima- manufacturing in Europe, see page 7 and table on page 11. Exclu- tely SEK 500m, and referred mainly to the strengthening of the Aus- ding items affecting comparability, operating income amounted to tralian dollar and the Brazilian real against the US dollar as well as to SEK 1,477m (1,027). the weakening of the Euro against several other currencies. Transla- tion of income statements in subsidiaries had an effect of approx- Effects of changes in exchange rates imately SEK -80m. In addition, results from hedging contracts had Changes in exchange rates compared to the previous year, inclu- a positive effect of approximately SEK 140m on operating income ding translation, transaction effects and hedging contracts, had a compared to the previous year and amounted to SEK -150m (-290) positive impact of approximately SEK 220m on operating income for the first half of 2010. for the second quarter of 2010, compared to the same period in the previous year. Transaction effects amounted to approximately Financial net SEK 100m. Translation of income statements in subsidiaries had an Net financial items for the first half of 2010 decreased to impact of approximately SEK -70m. In addition, results from hed- SEK -21m, compared to SEK -227m for the corresponding period in ging contracts had a positive effect of approximately SEK 190m on the previous year. The improvement is mainly due to lower interest operating income compared to the previous year and amounted to rates on borrowings and lower net borrowings. SEK -90m (-280). Financial net Net financial items for the second quarter of 2010 decreased to SEK -1m, compared to SEK -120m for the corresponding period in the previous year. The improvement is mainly due to lower interest rates on borrowings and lower net borrowings. Share of sales by business area, for the first half of 2010 Operating income and margin* SEKm % 2,400 12 Consumer Durables, 94% 1,800 9 Europe, Middle East and Africa, 36% 1,200 6 North America, 34% Latin America, 16% 600 3 Asia/Pacific, 8% 0 0 Q1 Q2 Q3 Q4 Q1 Q2 Professional Products, 6% 2009 2010 –600 –3 * Excluding items affec- EBIT EBIT margin ting comparability.
- 3. 3 Interim report January - June 2010 Market overview demand increased, although from a very low level in major Electrolux markets such as Germany, France and Sweden. Electrolux main markets continued to recover during the second Group sales continued to decline during the second quarter pri- quarter of 2010. The North American market rose for the third con- marily as a result of lost volumes as Quelle of Germany, one of the secutive quarter following thirteen quarters of decline. Industry Group’s major retailers, went into bankruptcy at the end of 2009. At shipments of core appliances in the US in the second quarter is the same time, sales volumes of Electrolux-branded products sho- estimated to have increased by approximately 10%. wed a positive trend. The Group’s position for built-in products has The overall European market stabilized during the quarter, with been reinforced. In some markets, price pressure has gradually important markets, such as Germany, France and Sweden showing increased during the quarter. positive trends. However, markets in Southern Europe weakened Operating income for the second quarter showed a substantial substantially at the end of the quarter. Demand in Eastern Europe improvement in comparison with the same quarter in 2009, mainly increased somewhat. on the basis of a positive trend for product mix. Higher sales of The market in Brazil slowed down in the second quarter following built-in products, particularly in the German market and a higher the discontinuation of tax credits for domestically-produced appli- proportion of sales in the central regions of Europe, contributed to ances. the improvement in product mix. In addition, previously implemen- Looking ahead, market demand for appliances in the Group’s ted personnel cutbacks and cost-savings continued to have a posi- main markets is expected to show growth during 2010. tive impact on operating income, which was, however, adversely affected by increased outlays for marketing and brand invest- ments. Business areas Floor-care products Changes in net sales and operating income by business area in Demand for vacuum cleaners in Europe continued to weaken during comparable currencies are given on page 15. the second quarter of 2010. Group sales declined as a result of lower sales volumes of pro- Consumer Durables Europe, Middle East and Africa ducts in the low-price segment. Sales of premium products rose, however. Operating income was higher, mainly on the basis of an First half First half Full year improved product mix. The improvement in mix is traceable to pre- SEKm Q2 2010 Q2 2009 2010 2009 2009 vious launches of products in the premium segment, such as the Net sales 9,349 10,452 19,068 21,020 44,073 vacuum cleaner UltraOne. Operating income 504 300 1,124 460 2,349 Operating margin, % 5.4 2.9 5.9 2.2 5.3 Industry shipments of core appliances in Europe First half Units, year-over-year, % Q2 2010 2010 Western Europe 0 1 Eastern Europe (excluding Turkey) 1 -4 Total Europe 0 0 Core appliances Market demand for appliances in Europe continued to stabilize during the second quarter of 2010, and was at the same level as in the second quarter of last year. This was the second consecutive quarter that the market has shown stabilization, after ten quarters of decline. Demand in Western Europe was unchanged, while Eastern Europe showed an increase, primarily on the basis of higher demand in Russia. Following a weak trend at the start of the year, the market in Northern Europe stabilized, while Southern Europe showed a sig- nificant decline during the latter part of the second quarter. Total Consumer Durables Europe, Middle East and Africa Industry shipments of core appliances in Europe* % SEKm % 10 900 9 0 600 6 Q1 Q2 Q3 Q4 Q1 Q2 –10 300 3 0 0 –20 Q1 Q2 Q3 Q4 Q1 Q2 –300 –3 –30 2009 2010 2009 2010 –600 –6 –40 –900 –9 –50 EBIT EBIT margin Western Europe Eastern Europe * Units, year-over-year, %.
- 4. 4 Interim report January - June 2010 Consumer Durables North America Launches of new products under the Frigidaire brand during the second quarter involved transition costs, as older products in inven- Q2 First half First half Full year tory were sold out at temporarily discounted prices. This had an SEKm Q2 2010 2009 2010 2009 2009 adverse effect on operating income. Costs related to the consolida- Net sales 10,027 9,848 18,022 18,992 35,726 tion of the Group’s North American headquarters to Charlotte in Operating income 458 498 818 321 1,476 North Carolina have also had a negative impact on operating Operating margin, % 4.6 5.1 4.5 1.7 4.1 income. In total costs for both these activities amounted to approx- imately SEK - 200m. In addition increased costs for raw materials and higher brand investments also had a negative impact on Industry shipments of core appliances in the US income. First half Units, year-over-year, % Q2 2010* 2010* Floor-care products Core appliances 10 8 Major appliances 8 3 Market demand for vacuum cleaners in North America is estimated to have declined during the second quarter in comparison with the *Preliminary figures corresponding period of last year. Group sales declined as a result Core appliances of lower sales volumes. Operating income was lower, primarily Market demand for appliances in North America has continued to because costs related to the transfer of production of central increase. Demand is estimated to have increased by approximately vacuum cleaners from Webster City in Iowa to Juarez in Mexico had 10% during the second quarter compared to the corresponding an adverse impact on income during the second quarter. An impro- period of 2009. This is mainly due to the US government rebate ved product mix continued to have a positive effect on operating program to stimulate sales of energy-efficient products. This is the income. third quarter in a row that the North American market has increased, after more than three years of decline. Group sales rose in comparable currencies during the second quarter in comparison with the corresponding period of last year, mainly as a result of higher sales volumes and an improved mix. Operating income improved in comparable currencies in compa- rison with the second quarter of 2009, mainly on the basis of an improved product mix. Since year-end 2009, Electrolux has termi- nated several contracts for production under private labels, while sales under the Group’s Electrolux and Frigidaire brands have grown successively, which has contributed to an improved product mix. Moreover, the warm early summer has contributed to strong sales of air-conditioners, which also had a positive impact on ope- rating income. Industry shipments of core appliances Consumer Durables North America in the US* SEKm % % 800 8 10 600 6 5 Q4 Q1 Q2 400 4 0 Q1 Q2 Q3 200 2 –5 0 0 –10 Q1 Q2 Q3 Q4 Q1 Q2 –200 –2 –15 –400 2009 2010 –4 –20 2009 2010 EBIT EBIT margin * Units, year-over-year, %.
- 5. 5 Interim report January - June 2010 Consumer Durables Latin America Southeast Asia and China Market demand in Southeast Asia and China is estimated to have First half First half Full year continued to show strong growth in the second quarter of 2010 in SEKm Q2 2010 Q2 2009 2010 2009 2009 comparison with the corresponding period in 2009. Net sales 3,905 3,326 7,903 5,951 14,165 Electrolux sales in the markets in Southeast Asia and China sho- Operating income 237 142 457 192 878 wed strong growth. The Group continued to gain market shares. Operating margin, % 6.1 4.3 5.8 3.2 6.2 Operations in Southeast Asia continued to show good profitability. The Group’s performance in China was positively affected by Market demand for appliances in Brazil during the second quarter previously implemented restructuring and the ongoing repositio- is estimated to have remained at the same level as in the correspon- ning of the Electrolux brand. ding quarter of 2009, following several quarters of strong growth. Demand stagnated mainly as a result of the discontinuation of tax credits on domestically-produced appliances. Professional Products Electrolux sales volumes in Brazil increased in the second quar- ter of 2010. Demand in most other markets in Latin America conti- First half First half Full year SEKm Q2 2010 Q2 2009 2010 2009 2009 nued to show strong growth and Electrolux sales volumes increased. These markets accounted for more than 20% of Group sales in Net sales 1,730 1,850 3,231 3,577 7,129 Latin America during the second quarter. The launches of new pro- Operating income 207 165 298 270 668 ducts contributed to the good sales development. Operating margin, % 12.0 8.9 9.2 7.5 9.4 Operating income for the Latin American operations improved, mainly on the basis of higher volumes as well as more efficient pro- duction and favorable changes in exchange rates. Market demand for food-service equipment is estimated to have stabilized somewhat during the second quarter of 2010 in compari- son with the corresponding period of last year. Consumer Durables Asia/Pacific Group sales of food-service equipment remained at the same level as last year in comparable currencies. Downward pressure on First half First half Full year market prices were offset by higher volumes and an improved mix. SEKm Q2 2010 Q2 2009 2010 2009 2009 Operating income improved on the basis of a positive trend for the Net sales 2,298 2,004 4,210 3,756 8,033 product mix and lower costs for raw materials. Operating income 231 61 391 86 458 Demand in the market for professional laundry equipment is esti- Operating margin, % 10.1 3.0 9.3 2.3 5.7 mated to have stabilized somewhat during the second quarter, alt- hough from a very low level. Electrolux sales were at the same level as in the corresponding period in 2009 in comparable currencies. Operating income rose on the basis of higher cost-efficiency, price Australia and New Zealand increases, higher sales of spare parts, and improved product and Demand for appliances in Australia continued to weaken during the customer mixes. second quarter of 2010, primarily as a result of the discontinuation of previous government stimulus measures. Market demand is esti- mated to have declined by approximately 7% in comparison with the corresponding period of last year. Group sales declined as a result of lower volumes, but market shares were maintained. Operating income improved substantially on the basis of an improved product mix, higher cost-efficiency and changes in exchange rates. Consumer Durables Latin America Consumer Durables Asia/Pacific Professional Products SEKm % SEKm % SEKm % 350 10 250 10 250 15 280 8 200 8 200 12 210 6 150 6 150 9 140 4 100 4 100 6 70 2 50 2 50 3 0 0 0 0 0 0 Q1 Q2 Q3 Q4 Q1 Q2 Q1 Q2 Q3 Q4 Q1 Q2 Q1 Q2 Q3 Q4 Q1 Q2 2009 2010 2009 2010 2009 2010 EBIT EBIT margin EBIT EBIT margin EBIT EBIT margin
- 6. 6 Interim report January - June 2010 Cash flow Financial position Cash flow from operations and investments for the second quarter Total equity as of June 30, 2010, amounted to SEK 19,708m of 2010 amounted to SEK 2,821m (3,507). (17,238), which corresponds to SEK 69.23 (60.67) per share. The strong cash flow was generated by income from operations as well as changes in operating assets and liabilities. Seasonal Net borrowings build-up of inventories for the normally stronger second half of the June 30, June 30, Dec. 31, year and improved markets in North America and Latin America SEKm 2010 2009 2009 had an impact on cash flow in the quarter. The Groups ongoing Borrowings 12,178 15,083 14,022 structural efforts to reduce tied up capital also contributed to the Liquid funds 12,674 12,886 13,357 strong cash flow in the quarter. Improved payment terms had a Net borrowings -496 2,197 665 positive effect on accounts payable. Net debt/equity ratio -0.03 0.13 0.04 Outlays for the ongoing restructuring and cost-cutting programs Equity 19,708 17,238 18,841 amounted to approximately SEK -130m. Equity per share, SEK 69.23 60.67 66.24 Investments during the second quarter of 2010 increased from a Return on equity, % 20.5 3.9 14.9 low level in the previous year and referred mainly to investments in Return on equity, excluding items new products. affecting comparability, % 22.7 8.6 22.0 The dividend payment for 2009 of SEK 1,138m was paid to the Equity/assets ratio, % 31.5 27.1 31.8 shareholders in the quarter. Net borrowings Cash flow First First Net borrowings amounted to SEK -496m (2,197). The net debt/ half half equity ratio was -0.03 (0.13). The equity/assets ratio was 31.5% SEKm Q2 2010 Q2 2009 2010 2009 (27.1). Cash flow from operations, During the first half of 2010, SEK 1,023m of long-term borrowings excluding change in operating assets and liabilities 2,069 1,266 4,206 1,596 were amortized. Long-term borrowings as of June 30, 2010, inclu- Change in operating assets ding long-term borrowings with maturities within 12 months, and liabilities 1,773 2,810 427 3,119 amounted to SEK 10,049m with average maturities of 3.7 years, Investments -1,021 -569 -1,699 -1,273 compared to SEK 10,241m and 3.9 years at the end of 2009. During Cash flow from operations 2010 and 2011, long-term borrowings in the amount of approxima- and investments 2,821 3,507 2,934 3,442 tely SEK 1,300m will mature. Dividend -1,138 0 -1,138 0 Liquid funds as of June 30, 2010, excluding a committed unused Sale of shares 15 45 18 45 revolving credit facility of EUR 500m, amounted to Total cash flow, excluding change in loans and short- SEK 12,674m. term investments 1,698 3,552 1,814 3,487 Net assets and working capital Average net assets for the period amounted to SEK 19,751m (20,690). Net assets as of June 30, 2010, amounted to SEK 19,212m (19,435). Adjusted for items affecting comparability, i.e., restructuring pro- visions, average net assets amounted to SEK 21,165m (21,578), corresponding to 20.2% (20.2) of net sales. Working capital as of June 30, 2010, amounted to SEK -5,664m (-6,622), corresponding to -5.1% (-6.0) of annualized net sales. The return on net assets was 25.3% (6.4), and 26.5% (9.9), exclu- ding items affecting comparability. Cash flow from operations and investments Cash flow and change in net borrowings SEKm 4,000 Net borrowings December 31, 2009 Operations 3,000 Operating assets and liabilities 2,000 Investments 1,000 Dividend 0 Sale of shares Q1 Q2 Q3 Q4 Q1 Q2 Other –1,000 Net borrowings June 30, 2010 2009 2010 –2,000 0 00 00 00 00 0 0 SEKm 00 00 ,0 ,0 0 0 2, 3, 4, 1, –2 –1
- 7. 7 Interim report January - June 2010 Structural changes Risks and uncertainty factors April 2010 Risks in connection with the Group’s operations can, in general, be Improving efficiency in appliances plants in Italy and France divided into operational risks related to business operations and As previously announced, Electrolux restructuring work continues those related to financial operations. Operational risks are normally in Europe. Efficiency at the washing-machine plant in Revin, managed by the operative units within the Group, and financial risks France, and at the cooker plant in Forli, Italy, will be improved. by the Group’s treasury department. Costs for efficiency measures in the amount of SEK 207m were charged against operating income, within items affecting compa- Risks and uncertainty factors rability for the second quarter of 2010, see page 11. Electrolux operates in competitive markets, most of which are rela- tively mature. Demand for appliances varies with general business conditions, and price competition is strong in a number of product Other items categories. Electrolux ability to increase profitability and shareholder Asbestos litigation in the US value is largely dependent on its success in developing innovative Litigation and claims related to asbestos are pending against the products and maintaining cost-efficient production. Major factors Group in the US. Almost all of the cases refer to externally supplied for maintaining and increasing competitiveness include managing components used in industrial products manufactured by disconti- fluctuations in prices for raw materials and components as well as nued operations prior to the early 1970s. Some of the cases involve implementing restructuring. In addition to these operative risks, the multiple plaintiffs who have made identical allegations against many Group is exposed to risks related to financial operations, e.g., inte- other defendants who are not part of the Electrolux Group. rest risks, financing risks, currency risks and credit risks. The As of June 30, 2010, the Group had a total of 2,891 (2,776) cases Group’s development is strongly affected by external factors, of pending, representing approximately 3,180 (approximately 3,120) which the most important in terms of managing risks currently plaintiffs. During the second quarter 2010, 163 new cases with 163 include: plaintiffs were filed and 112 pending cases with approximately 114 plaintiffs were resolved. Approximately 37 of the plaintiffs relate to Variations in demand cases pending in the state of Mississippi. Demand for appliances is affected by the general business cycle. Additional lawsuits may be filed against Electrolux in the future. It A deterioration in these conditions may lead to lower sales volumes is not possible to predict either the number of future claims or the as well as a shift of demand to low-price products, which generally number of plaintiffs that any future claims may represent. In addi- tion, the outcome of asbestos claims is inherently uncertain and always difficult to predict and Electrolux cannot provide any assu- rances that the resolution of these types of claims will not have a material adverse effect on its business or on results of operations in the future. Relocation of production, items affecting comparability, restructuring measures 2007–2011 Plant closures and cutbacks Closed Authorized closures Estimated closure Torsvik Sweden Compact appliances (Q1 2007) Webster City USA Washing machines (Q1 2011) Nuremberg Germany Dishwashers, washing (Q1 2007) Alcalà Spain Washing machines (Q1 2011) machines and dryers Adelaide Australia Dishwashers (Q2 2007) Consolidation Starting Fredericia Denmark Cookers (Q4 2007) Charlotte USA New North American (Q3 2010) Adelaide Australia Washing machines (Q1 2008) headquarter Spennymoor UK Cookers (Q4 2008) Changsha China Refrigerators (Q1 2009) In 2004, Electrolux initiated a restructuring program to make the Group’s Scandicci Italy Refrigerators (Q2 2009) production competitive in the long term. When it is fully implemented in St. Petersburg Russia Washing machines (Q2 2010) 2011, more than half of production of appliances will be located in low-cost countries and savings will amount to approximately SEK 3 billion annually. Restructuring provisions and write-downs are reported as items affecting Re-engineering Effected comparability within operating income. For information on provisions in Porcia Italy Washing machines (Q4 2010) 2010, see table on page 11.
- 8. 8 Interim report January - June 2010 have lower margins. Utilization of production capacity may also Access to financing decline in the short term. The global economic trend is an uncerta- The Group’s loan-maturity profile for 2010 and 2011 represents inty factor in terms of the development of earnings in 2010. maturities of approximately SEK 1,300m in long-term borrowings. Electrolux has an unused revolving credit facility for long or short- Price competition term back-up. A number of the markets in which Electrolux operates features strong price competition. The Group’s strategy is based on innova- Risks, risk management and risk exposure are described in more tive products and brand-building, and is aimed, among other things, detail in the Annual Report 2009, www.electrolux.com/annualre- at minimizing and offsetting price competition for its products. port2009. A continued downturn in market conditions involves a risk of increa- sing price competition. Changes in prices for raw materials and components The raw materials to which the Group is mainly exposed comprise steel, plastics, copper and aluminum. Bilateral agreements are used to manage price risks. To some extent, raw materials are purchased at spot prices. There is considerable uncertainty regar- ding trends for the prices of raw materials. Sensitivity analysis year-end 2009 Raw-materials exposure 2009 Pre-tax earnings Risk Change impact, SEKm Carbon steel, 39% Raw materials Stainless steel, 8% Steel 10% +/– 900 Copper and aluminum, 11% Plastics 10% +/– 400 Plastics, 23% Currencies¹) and interest rates Other, 19% EUR/SEK –10% + 529 USD/SEK –10% + 385 In 2009, Electrolux purchased raw materials for approximately BRL/SEK –10% - 254 SEK 19 billion. Purchases of steel AUD/SEK –10% - 246 accounted for the largest cost. GBP/SEK –10% - 224 Interest rate 1 percentage point +/– 60 1) Include translation and transaction effects.
- 9. 9 Interim report January - June 2010 Parent Company AB Electrolux Accounting and valuation principles The Parent Company comprises the functions of the Group’s head Electrolux applies International Financial Reporting Standards office, as well as five companies operating on a commission basis (IFRS) as adopted by the European Union. This report has been for AB Electrolux. prepared in accordance with IAS 34, Interim Financial Reporting, Net sales for the Parent Company, AB Electrolux, for the first half and ÅRL, the Swedish Annual Accounts Act and recommendation of 2010 amounted to SEK 2,729m (2,421), of which RFR 2, Accounting for legal entities, issued by the Swedish Finan- SEK 1,517m (1,116) referred to sales to Group companies and cial Reporting Board. There are no changes in the Group’s accoun- SEK 1,212m (1,305) to external customers. Income after financial ting and valuation principles compared with the accounting and items was SEK 2,444m (979), including dividends from subsidiaries valuation principles described in Note 1 of the Annual Report 2009 in the amount of SEK 2,219m (688). Income for the period amoun- and the description on new accounting standards above. ted to SEK 2,390m (1,009). Capital expenditure in tangible and intangible assets was SEK 146m (129). Liquid funds at the end of the period amounted to This report has not been audited. SEK 4,872m, as against SEK 3,869m at the start of the year. Undistributed earnings in the Parent Company at the end of the period amounted to SEK 14,018m, as against SEK 12,694m at the start of the year. Dividend payment to shareholders for 2009 amounted to SEK 1,138m. The income statement and balance sheet for the Parent Com- pany are presented on page 19. Stockholm, July 19, 2010 Hans Stråberg President and CEO Press releases 2010 January 29 Conversion of shares April 27 Interim report January-March and CEO Hans Stråberg’s comments February 3 Consolidated results 2009 and CEO - Morten Falkenberg, head of Floor Care and Small Hans Stråberg’s comments Appliances, will leave Electrolux - Lars Göran Johansson, head of Communications and February 10 Electrolux delists from the London Stock Exchange Branding, will leave Electrolux March 2 Lorna Davis proposed new Board member of Electrolux May 12 Electrolux is named ”global superstar” by Forbes Magazine March 11 Electrolux delisted from the London Stock Exchange
- 10. 10 Interim report January - June 2010 The Board of Directors and the President and CEO certify that the Interim report for the period January - June 2010 gives a true and fair overview of the Parent Company AB Electrolux and the Group’s operations, their financial position and results of operations, and describes significant risks and uncertainties facing the Parent Company and other companies in the Group. Stockholm, July 19, 2010 Marcus Wallenberg Chairman of the Board of Directors Peggy Bruzelius Vice Chairman of the Board of Directors Torben Ballegaard Sørensen Lorna Davis Board member Board member Hasse Johansson John S. Lupo Board member Board member Johan Molin Caroline Sundewall Board member Board member Barbara Milian Thoralfsson Hans Stråberg Board member Board member, President and CEO Ola Bertilsson Gunilla Brandt Ulf Carlsson Board member, Board member, Board member, union representative union representative union representative
- 11. 11 Interim report January - June 2010 Consolidated income statement First half First half Full year SEKm Q2 2010 Q2 2009 2010 2009 2009 Net sales 27,311 27,482 52,444 53,300 109,132 Cost of goods sold -21,308 -22,145 -40,860 -43,586 -86,980 Gross operating income 6,003 5,337 11,584 9,714 22,152 Selling expenses -3,070 -3,093 -5,972 -6,089 -11,394 Administrative expenses -1,468 -1,213 -2,808 -2,559 -5,375 Other operating income/expenses 12 -4 -1 -1 -61 Items affecting comparability -207 25 -302 -399 -1,561 Operating income 1,270 1,052 2,501 666 3,761 Margin, % 4.7 3.8 4.8 1.2 3.4 Financial items, net -1 -120 -21 -227 -277 Income after financial items 1,269 932 2,480 439 3,484 Margin, % 4.6 3.4 4.7 0.8 3.2 Taxes -241 -274 -541 -127 -877 Income for the period 1,028 658 1,939 312 2,607 Available for sale instruments1) 1 90 29 74 138 Cash-flow hedges2) -63 53 -99 -167 -112 Exchange differences on translation of foreign operations3) 413 123 90 585 -264 Income tax relating other comprehensive income 13 - -5 - - Other comprehensive income, net of tax 364 266 15 492 -238 Total comprehensive income for the period 1,392 924 1,954 804 2,369 Income for the period attributable to: Equity holders of the Parent Company 1,028 658 1,939 312 2,607 Total comprehensive income for the period attributable to: Equity holders of the Parent Company 1,392 924 1,954 804 2,369 Earnings per share, SEK 3.61 2.32 6.81 1.10 9.18 Diluted, SEK 3.60 2.32 6.79 1.10 9.16 Number of shares after buy-backs, million 284.7 284.1 284.7 284.1 284.4 Average number of shares after buy-backs, million 284.6 283.9 284.5 283.8 284.0 Diluted, million 285.7 284.4 285.6 284.2 284.6 1) Available for sale instruments refer to the fair-value changes in Electrolux shareholdings in Videocon Industries Ltd., India. The shareholdings are classified as avai- lable for sale in accordance with IFRS. 2) Cash-flow hedges refer to changes in valuation of currency contracts used for hedging future foreign currency transactions. When the actual transaction occurs, the result is reported within operating income. 3) Exchange-rate differences on translation of foreign operations refer to changes in exchange rates when net investments in foreign subsidiaries are translated to SEK. The amount is reported net of hedging contracts. Items affecting comparability First half First half Full year SEKm Q2 2010 Q2 2009 2010 2009 2009 Restructuring provisions and write-downs Appliances plant in Revin, France -71 - -71 - - Appliances plant in Forli, Italy -136 - -136 - - Appliances plant in Motala, Sweden - - -95 - - Appliances plant in Alcalà, Spain - - - - -440 Appliances plants in Webster City and Jefferson, USA - - - - -560 Office consolidation in USA - - - - -218 Appliances plant in Changsha, China - 25 - -162 -162 Appliances plant in Porcia, Italy - - - -132 -132 Appliances plant in St. Petersburg, Russia - - - -105 -105 Reversal of unused restructuring provisions - - - - 56 Total -207 25 -302 -399 -1,561
- 12. 12 Interim report January - June 2010 Consolidated balance sheet SEKm June 30, 2010 June 30, 2009 Dec. 31, 2009 Assets Property, plant and equipment 15,037 16,383 15,315 Goodwill 2,311 2,282 2,274 Other intangible assets 3,175 2,873 2,999 Investments in associates 18 19 19 Deferred tax assets 2,789 3,078 2,693 Financial assets 476 361 434 Other non-current assets 1,815 1,657 1,745 Total non-current assets 25,621 26,653 25,479 Inventories 12,607 12,290 10,050 Trade receivables 20,683 20,932 20,173 Tax assets 559 609 1,103 Derivatives 455 612 377 Other current assets 3,419 3,554 2,947 Short-term investments 1,968 1,920 3,030 Cash and cash equivalents 9,892 9,964 9,537 Total current assets 49,583 49,881 47,217 Total assets 75,204 76,534 72,696 Equity and liabilities Equity attributable to equity holders of the Parent Company Share capital 1,545 1,545 1,545 Other paid-in capital 2,905 2,905 2,905 Other reserves 1,829 2,543 1,814 Retained earnings 13,429 10,245 12,577 Total equity 19,708 17,238 18,841 Long-term borrowings 9,304 10,702 10,241 Deferred tax liabilities 745 596 819 Provisions for post-employment benefits 1,822 6,582 2,168 Other provisions 5,748 4,301 5,449 Total non-current liabilities 17,619 22,181 18,677 Accounts payable 19,162 16,543 16,031 Tax liabilities 2,383 2,292 2,367 Short-term liabilities 11,853 11,648 11,235 Short-term borrowings 2,254 3,499 3,364 Derivatives 532 781 351 Other provisions 1,693 2,352 1,830 Total current liabilities 37,877 37,115 35,178 Total equity and liabilities 75,204 76,534 72,696 Contingent liabilities 1,318 1,471 1,185 Shares Shares held Outstanding Outstanding Shares held by by other Number of shares A-shares B-shares Electrolux shareholders Number of shares as of January 1, 2010 9,502,275 299,418,033 24,498,841 284,421,467 Conversion of A-shares into B-shares -494,150 494,150 Shares sold to senior managers under the stock-option programs First quarter -42,550 42,550 Second quarter -201,206 201,206 Shares alloted to senior managers under the Performance Share Program - - Number of shares as of June 30, 2010 9,008,125 299,912,183 24,255,085 284,665,223 As % of total number of shares 7.9%
- 13. 13 Interim report January - June 2010 Consolidated cash flow statement First half First half Full year SEKm Q2 2010 Q2 2009 2010 2009 2009 Operations Operating income 1,270 1,052 2,501 666 3,761 Depreciation and amortization 849 886 1,665 1,757 3,442 Restructuring provisions 84 -261 -68 -118 434 Share-based compensation 26 4 33 4 18 Financial items paid, net 18 -181 27 -223 -348 Taxes paid -178 -234 48 -490 -929 Cash flow from operations, excluding change in operating assets and liabilities 2,069 1,266 4,206 1,596 6,378 Change in operating assets and liabilities Change in inventories -1,278 529 -2,412 543 2,276 Change in trade receivables 115 -8 -420 562 1,209 Change in other current assets -543 -184 -559 -2 487 Change in accounts payable 2,953 1,351 3,296 937 628 Extra contributions to pension funds - - - - -3,935 Change in other operating liabilities and provisions 526 1,122 522 1,079 1,254 Cash flow from change in operating assets and liabilities 1,773 2,810 427 3,119 1,919 Cash flow from operations 3,842 4,076 4,633 4,715 8,297 Investments Divestment of operations - - - - 4 Capital expenditure in property, plant and equipment -765 -404 -1,203 -918 -2,223 Capitalization of product development -110 -63 -189 -211 -370 Other -146 -102 -307 -144 -378 Cash flow from investments -1,021 -569 -1,699 -1,273 -2,967 Cash flow from operations and investments 2,821 3,507 2,934 3,442 5,330 Financing Change in short-term investments 210 -864 1,062 -1,624 -2,734 Change in short-term borrowings -1,146 -466 -1,691 -466 -1,131 New long-term borrowings - 4 6 1,632 1,639 Amortization of long-term borrowings -312 -12 -1,023 -524 -1,040 Dividend -1,138 - -1,138 - - Sale of shares 15 45 18 45 69 Cash flow from financing -2,371 -1,293 -2,766 -937 -3,197 Total cash flow 450 2,214 168 2,505 2,133 Cash and cash equivalents at beginning of period 9,200 7,714 9,537 7,305 7,305 Exchange-rate differences 242 36 187 154 99 Cash and cash equivalents at end of period 9,892 9,964 9,892 9,964 9,537
- 14. 14 Interim report January - June 2010 Change in consolidated equity June 30, June 30, Dec. 31, SEKm 2010 2009 2009 Opening balance 18,841 16,385 16,385 Total comprehensive income for the period 1,954 804 2,369 Share-based payment 33 4 18 Sale of shares 18 45 69 Dividend payable -1,138 - - Total transactions with equity holders -1,087 49 87 Closing balance 19,708 17,238 18,841 Working capital and net assets % of annualized % of annualized % of annualized SEKm June 30, 2010 net sales June 30, 2009 net sales Dec. 31, 2009 net sales Inventories 12,607 11.4 12,290 11.2 10,050 8.8 Trade receivables 20,683 18.7 20,932 19.0 20,173 17.7 Accounts payable -19,162 -17.3 -16,543 -15.0 -16,031 -14.1 Provisions -9,263 -13,235 -9,447 Prepaid and accrued income and expenses -8,387 -8,279 -7,998 Taxes and other assets and liabilities -2,142 -1,787 -1,901 Working capital -5,664 -5.1 -6,622 -6.0 -5,154 -4.5 Property, plant and equipment 15,037 16,383 15,315 Goodwill 2,311 2,282 2,274 Other non-current assets 5,484 4,910 5,197 Deferred tax assets and liabilities 2,044 2,482 1,874 Net assets 19,212 17.4 19,435 17.7 19,506 17.1 Average net assets 19,751 18.8 20,690 19.4 19,411 17.8 Average net assets, excluding items affecting comparability 21,165 20.2 21,578 20.2 20,320 18.6 Key ratios First half First half Full year Q2 2010 Q2 2009 2010 2009 2009 Net sales, SEKm 27,311 27,482 52,444 53,300 109,132 Operating income, SEKm 1,270 1,052 2,501 666 3,761 Margin, % 4.7 3.8 4.8 1.2 3.4 EBITDA, SEKm 2,119 1,938 4,166 2,423 7,203 Earnings per share, SEK¹) 3.61 2.32 6.81 1.10 9.18 Return on net assets, % - - 25.3 6.4 19.4 Return on equity, % - - 20.5 3.9 14.9 Equity per share, SEK - - 69.23 60.67 66.24 Cash flow from operations, SEKm 3,842 4,076 4,633 4,715 8,297 Capital expenditure, SEKm -765 -404 -1,203 -918 -2,223 Net borrowings, SEKm - - -496 2,197 665 Net debt/equity ratio - - -0.03 0.13 0.04 Equity/assets ratio, % - - 31.5 27.1 31.8 Average number of employees 51,181 49,507 51,371 50,349 50,633 Excluding items affecting comparability Operating income, SEKm 1,477 1,027 2,803 1,065 5,322 Margin, % 5.4 3.7 5.3 2.0 4.9 EBITDA, SEKm 2,326 1,913 4,468 2,822 8,764 Earnings per share, SEK¹) 4.12 2.23 7.57 2.44 13.56 Return on net assets, % - - 26.5 9.9 26.2 Return on equity, % - - 22.7 8.6 22.0 1) Basic, based on average number of shares, excluding shares owned by Electrolux, see page 16. For definitions, see page 20.
- 15. 15 Interim report January - June 2010 Net sales by business area* First half First half Full year SEKm Q2 2010 Q2 2009 2010 2009 2009 Consumer Durables Europe, Middle East and Africa 9,349 10,452 19,068 21,020 44,073 Consumer Durables North America 10,027 9,848 18,022 18,992 35,726 Consumer Durables Latin America 3,905 3,326 7,903 5,951 14,165 Consumer Durables Asia/Pacific 2,298 2,004 4,210 3,756 8,033 Professional Products 1,730 1,850 3,231 3,577 7,129 Other 2 2 10 4 6 Total 27,311 27,482 52,444 53,300 109,132 Operating income by business area* First half First half Full year SEKm Q2 2010 Q2 2009 2010 2009 2009 Consumer Durables Europe, Middle East and Africa 504 300 1,124 460 2,349 Margin, % 5.4 2.9 5.9 2.2 5.3 Consumer Durables North America 458 498 818 321 1,476 Margin, % 4.6 5.1 4.5 1.7 4.1 Consumer Durables Latin America 237 142 457 192 878 Margin, % 6.1 4.3 5.8 3.2 6.2 Consumer Durables Asia/Pacific 231 61 391 86 458 Margin, % 10.1 3.0 9.3 2.3 5.7 Professional Products 207 165 298 270 668 Margin, % 12.0 8.9 9.2 7.5 9.4 Total business areas 1,637 1,166 3,088 1,329 5,829 Margin, % 6.0 4.2 5.9 2.5 5.3 Common Group costs, etc. -160 -139 -285 -264 -507 Items affecting comparability -207 25 -302 -399 -1,561 Operating income 1,270 1,052 2,501 666 3,761 * Figures for 2009 have been restated according to the new reporting structure, see page 17. Change in net sales by business area Q2 2010 First half 2010 in comparable First half in comparable Year-over-year, % Q2 2010 currencies 2010 currencies Consumer Durables Europe, Middle East and Africa -10.6 -3.1 -9.3 -2.2 Consumer Durables North America 1.8 6.0 -5.1 2.8 Consumer Durables Latin America 17.4 8.3 32.8 24.9 Consumer Durables Asia/Pacific 14.7 9.8 12.1 6.2 Professional Products -6.5 0.4 -9.7 -2.9 Total change -0.6 2.8 -1.6 3.5 Change in operating income by business area Q2 2010 First half 2010 in comparable First half in comparable Year-over-year, % Q2 2010 currencies 2010 currencies Consumer Durables Europe, Middle East and Africa 68.0 63.6 144.3 153.2 Consumer Durables North America -8.0 0.9 154.8 158.9 Consumer Durables Latin America 66.9 90.2 138.0 259.8 Consumer Durables Asia/Pacific 278.7 225.7 354.7 231.4 Professional Products 25.5 36.8 10.4 18.7 Total change, excluding items affecting comparability 43.8 53.6 163.2 185.1