1. USING BOLLINGER BAND AND STOCHASTIC
ALONG WITH PRICE ACTION
Bollinger Band Indicator
Bollinger Bands were established
by John Bollinger in the 1980s.
Bollinger Bands are comprised of the
following bands:
• The upper Bollinger Band
• The moving average Bollinger
Band or Middle Bollinger Band
• The lower Bollinger Band
The default settings for the Bollinger
Band consist of a 20-period Simple
Moving Average for the middle
band and the bands are set at 2
standard deviations above and below
the middle band. The purpose
of Bollinger Bands is to give a
relative meaning of highs and lows,
measuring price volatility. The
bandwidth increases when prices are
volatile and narrows as the volatility
decreases.
The Bollinger Band is useful for
traders to help position themselves
in the marketplace and under all
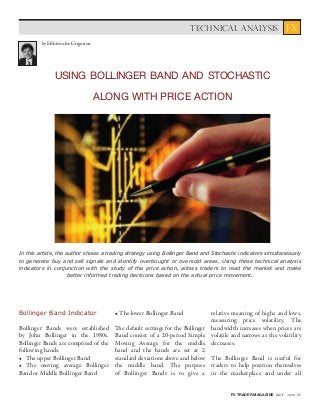
by Efthivoulos Grigoriou
In this article, the author shows a trading strategy using Bollinger Band and Stochastic indicators simultaneously
to generate buy and sell signals and identify overbought or oversold areas. Using these technical analysis
indicators in conjunction with the study of the price action, allows traders to read the market and make
better informed trading decisions based on the actual price movement.
FX TRADER MAGAZINE April - June 25
FXTECHNICAL ANALYSIS
2. market conditions. The advantage of
the Bollinger Band is that it enables
traders to detect price data between
the lower and upper bands.
Stochastic Oscillator
Stochastic is an oscillator concocted
by George Lane in the 1950s, which
is comprised of two lines:
• The %K line
• And the %D line
The default settings for the
Stochastic oscillator are 14-periods.
The %K line is usually displayed as a
solid line, which is a 3-period Simple
Moving Average of %K. The %D line
is usually displayed as a dotted line
to act as a signal or trigger line. The
Stochastic oscillates between vertical
sizes of 0 to 100. While using the
Stochastic, I prefer to use both, the
%K and %D lines. The hypothesis
behind this indicator is that it does
not monitor volume instead it tracks
speed or price momentum.
Therefore during an uptrend
market, when the price is just close
to its peak, the oscillator will be at its
peak (above 80), indicating that the
security is overbought. Conversely,
when the price is close to its lows,
then the oscillator has a tendency to
move towards a low reading (below
20), which indicates the security is
oversold.
The labels, however, can be
somewhat rather confusing, as we
cannot consider that overbought
(above 80) will signal that prices will
immediately drop, similarly with
oversold (below 20) it should not be
considered that prices will instantly
turn to the upside. The terminology
‘overbought’ and ‘oversold’, is used
to describe when prices are trading
near the peak or trough of the period
selected and in this case within the
14-day range. This situation can
have a long-term effect.
Using the Indicators, Price
Action and Timeframes
Most technicians will use Bollinger
Stochastic Chart
Bollinger Band Chart
26 FX TRADER MAGAZINE April - June 2015
TECHNICAL ANALYSISFX
3. Bands or Stochastic as a basic method
to settle on their trading decisions. I
cannot consider it a fault, however,
the root of the problem by applying a
solitary indicator to settle on a trading
decision is that it offers a different
perspective from which to analyse
the price action. The technical
indicator consists of a number of
data points that are calculated by
setting a specific formula to the price
data of a security. Any indicator or
sign of what may happen later on is
simply a probability, not a certainty.
The phrase that I like the most is:
“Price Action is the best indicator as
it is the study of the purest indicator
and it is the one that will never tell a
lie”. Price action is never misleading
as it does not predict future price
movements, but rather describes the
past. Additionally, the price action
reflects everything that is affecting a
market at any given time and under
all market conditions.
Therefore, with the help of technical
analysis and some significant
indicators, traders can shift the
probabilities on their side, and here
the price action could be turned
into the most important indicator.
Moreover, technical indicators
are designed for short-term price
movement analysis. Therefore, I use
technical indicators to help identify
high probability trade entry and exit
points. To identify these entry and
exit points, I always move towards
lower timeframes.
Each specific market has specific
designed trading strategies. Whilst
creating a trading system, the trader
will configure the settings (chart
timeframe, indicator etc.) of the
trading system accordingly, that is
most suitable in the market. This
suggests that each trading system
has the appropriate default settings
for that specific market, and if the
trading system is going to be traded
on different markets then these
settings are adjusted accordingly.
Applying a Theory by
using Bollinger Band and
Stochastic
As we have already highlighted in
the aforementioned, price action is
the best indicator, as well as the need
to also determine which timeframe
and indicator settings mostly adapt
and identify with our trading system.
Overall we must have a perfect
combination of these three to get the
best possible result. The speed and
price momentum are identified by
the Stochastic indicator and acquire
a possible price trend alongside
with the Bollinger band which
automatically detects the volatility
measurement. I will go through a
Fig 1. UPPER
FX TRADER MAGAZINE April - June 27
FXTECHNICAL ANALYSIS
4. TECHNICAL ANALYSISFX
few illustrations below, however,
I won’t reveal my secret formula.
Keep in mind, there are numerous
combinations which exist, some of
which function most effectively in a
specific timeframe, indicator setting
and specific security.
Interpretation – Bull and
Bear trade setups
It has been discovered that selling
the breaks of the higher Bollinger
Band is a way to take advantage of
overbought conditions. Typically,
once a higher band has been broken
due to heavy buying, the price of the
security will revert back below the
higher band and head toward the
middle band. I based my strategy
on this theory, but I will use the
Stochastic indicator as a trigger line
to confirm my trading setup.
Interpretation: If the price action
(bullish candlestick) closes above
the upper Bollinger Band, which I
consider to be the first signal, we can
then move towards the Stochastic
oscillator and wait until it breaks
the 80 level to the downside.
Once the break has occurred a
short position can be taken, with a
potential move towards the middle
Bollinger Band. Simultaneously,
we place our stop loss above the
shadow of the candle which closed
above the upper Bollinger Band.
After withdrawing 75 percent of the
profit, the stop loss can be adjusted
to breakeven (in case the price turns
against the trader). As the price
starts to pull away from the middle
Bollinger Band, and the price has
penetrated the lower Bollinger
Band, the remaining profit can then
be withdrawn. Thus from the above
example we have identified that the
close price is of great significance
when working with Bollinger Bands.
In the inverse situation we
anticipate for a bearish candle to
close below the lower Bollinger
Band. Subsequently, when the
Stochastic breaks above the 20
level, a long position can be entered,
with a potential move towards the
middle Bollinger Band, which is
considered to be the first target.
Consequently we are left with two
options, to either close all positions
or withdraw the 75 percent profit.
If the second option is selected, the
stop loss must then be positioned to
breakeven when the price starts to
Fig 2. LOWER
28 FX TRADER MAGAZINE April - June 2015
5. pull away from the middle Bollinger
Band. The remaining position
should be closed when the price
reaches the lower Bollinger Band.
In the first example below (Figure
2), let’s assume that we entered
the market long
at 1.2550, when
the price evidently
closed below the
lower Bollinger
Band and the
Stochastic had
exited the 20 level.
Following that
action, the price
started to rise and
reached the middle
Bollinger Band
around the 1.2630,
our first target,
following three
positive candles.
Moreover, the price
continued moving
to the upside and
reached the upper
Bollinger Band
after six candles.
In the second
example (Figure
2), the price managed to close
below the lower Bollinger Band and
slightly below the 1.2400 region.
Consequently, the confirmation
came from the Stochastic oscillator,
which crossed above the 20 level,
thus a long position can be entered.
Following this setup, the price
surged forming four consecutive
winning candles and reached the
first target (middle Bollinger Band).
Having locked the 75 percent of
profits, the stop loss should be
adjusted to breakeven in the event
that the price moves against the
trader. Subsequently, there was a
pullback after the price tested the
middle Bollinger Band, failing to
break below the lowest shadow
of the first candle, the one which
closed outside the lower Bollinger
Band. Instead, it started moving
upwards again and after eleven
candles it successfully reached the
second target, meeting the upper
Bollinger Band.
Conclusion
As I have discussed throughout,
Bollinger Band should not be applied
as a signal generating indicator,
but rather in conjunction with an
alternate indicator in which it proves
to be extremely
helpful. Thus,
I prefer to use
Bollinger Band
and Stochastic
collectively
to generate
possible buy
and sell signals
as well as
to identify
overbought or
oversold areas.
Furthermore
it is important
to emphasize
that the most
e s s e n t i a l
t r a d i n g
t e c h n i q u e
is the price
a c t i o n ,
which allows
me to read
the market
and make
informed trading decisions based on
the actual price movement, rather
than relying on a single indicator.
There are numerous Bollinger Band
and Stochastic strategic techniques,
some of which work in the short-term,
others in the long-term, but never one
that is long-lasting.
Efthivoulos Grigoriou
Price Action is the best indicator as it is
the study of the purest indicator and it is
the one that will never tell a lie
FXTECHNICAL ANALYSIS
FX TRADER MAGAZINE April - June 29