2. MScArchitecturalEngineering-IntegratedEnergyDesignEduardNuñezGarcia,JohannesMayer
2
Abstract
This paper provides an overview of the
impacts on office rooms and classrooms
concerning energy performance, natural
lighting, and indoor environment of diffe-
rent facade configurations. To get a use-
ful reference paper several facade confi-
gurations with parameter variations are
investigated. Moreover, a comparison of
glazing types with and without solar coa-
ting is made as well as an evaluation of the
difference of south and north facing office
rooms.
Furthermore, a north and south facing
classroom is investigated regarding the
same aspects like the office room.
Finally, a ventilation system for a possible
building design of office rooms and class-
rooms is shown.
Introduction, Working process, Office room dimensions............................................................................................................................3
North facade w/o coating - Window height variation ................................................................................................................................4
North facade w/o coating - Parameter variation.........................................................................................................................................5
North facade w/o coating - Impact of roof and gable.................................................................................................................................6
South facade w/ coating - Window height variation ..................................................................................................................................7
South facade w/ coating - Parameter variation...........................................................................................................................................8
South facade w/ coating - Impact of roof and gable...................................................................................................................................9
North facade w/o shading - Window height variation .............................................................................................................................10
North facade w/o shading - Parameter variation......................................................................................................................................11
North facade w/o shading - Impact of roof and gable..............................................................................................................................12
South facade w/o shading - Window height variation .............................................................................................................................13
South facade w/o shading - Parameter variation......................................................................................................................................14
South facade w/o shading - Impact of roof and gable..............................................................................................................................15
Classroom north facade............................................................................................................................................................................16
Classroom south facade............................................................................................................................................................................17
Ventilation concept I.................................................................................................................................................................................18
Ventilation concept II................................................................................................................................................................................19
Overall building energy performance, Discussion, Conclusion.................................................................................................................20
References.................................................................................................................................................................................................21
Table of content
1 - Set up/redefine model
2 - Define parameters and connections3 - Evaluate and illustrate results
3. MScArchitecturalEngineering-IntegratedEnergyDesignEduardNuñezGarcia,JohannesMayer
3
“Men argue. Nature acts.”
― Voltaire
At present days the building sector takes around 45 % of all energy consumed in Europe, therefore the chances of reducing a country‘s energy demand or getting independent of fossil fuels
are the highest. Governments all over the world realised that it is unavoidable to set requirements concerning the energy demand of buildings to stop or to slow down the climate change. It
is therefore of great interest finding new ways of developing buildings with good indoor environment and acceptable energy consumption (“All [architects and engineers] are aware that the
industry is moving towards a more performance based design culture and the willingness to focus more on the energy and indoor climate issues is present“ (Strunge, 2014)).
Nowadays, there is a huge conflict between the costs spent in the early phases of a design process and the consequences on the total costs made during this phase. In the conceptual phase,
when around 80 % of the total costs of a project are getting defined, only a fraction of the total amount is spent (Petersen, 2015). Because of that it is necessary to change the way of wor-
king fundamentally. Taking energy performance and indoor environment into account during the early stages is a huge step towards an economically and energetically reasonable building.
Furthermore, since the costs of changes in a project are increasing with time it is advisable taking energy performance and indoor environment in the early design phases into account
(Petersen, 2015).
The following paper can be used to illustrate architects the impact of different facade configurations on the room behind the facade. Using simple sketches of facade openings and listing
values of their energy performance as well as of their indoor environment creates a visually understandable way of showing architects the impact of their design decisions.
Moreover, a ventilation system is shown to highlight the importance of taking considerations about it into account during the design phase. Since a ventilation system requires a lot of space
in a building and is also often consuming most of the energy, the necessity of a well working system is inevitable.
Introduction
“How you climb a mountain is more important than reaching the top.”
― Yvon Chouinard
To understand the structure of this paper at the first glance and to make it more user-friendly reading
it, a brief description of the working process follows here. First, three different facade configurations
were made. Second, taking those three models as a reference, two varitions of the window height
were created - one variation with a smaller glazing area and another one with a larger area (Height va-
raition). Furthermore, calculations and comparisons of whether solar coated glazing types or shading
devices are reasonable were made. Third, after evaluating the nine different models regarding energy
performance, daylight factor, and indoor environment the best height variation of each of the three
different facade configurations was taken to change some parameters (Parameter variation). Fourth,
the same model which was chosen for the parameter variation was then taken for investigating the
performance of the room when additional thermal transmittance through the roof and the roof and
gable was present.
The same procedure has been done for north and south facing rooms with solar coated windows or a
shading device.
Working process Office room dimensions
The measurements shown below are internal dimensions
4. MScArchitecturalEngineering-IntegratedEnergyDesignEduardNuñezGarcia,JohannesMayer
4
Energy
demand
Day-
light
factor
Operative
temperature
[%]
IAQ
[%]
[kWh/m²] [%] Cat. I Cat. II Cat. I Cat. II
NC_1.1 23 4,2 64 35 38 62
NC_1.2 23 5,1 66 33 38 62
NC_1.3 23 7,0 67 32 38 62
W/SolarcoatingW/OSolarcoating
Comments
Energy
demand
Day-
light
factor
Operative
temperature
[%]
IAQ
[%]
[kWh/m²] [%] Cat. I Cat. II Cat. I Cat. II
NC_1.1 21 4,9 63 36 41 59
NC_1.2 22 6,2 65 34 40 60
NC_1.3 22 7,8 66 32 40 60
Height Width Sill h.
1 1,25 m 4,00 m 1,00 m
Height Width Sill h.
1 1,70 m 4,00 m 1,00 m
Height Width Sill h.
1 1,45 m 4,00 m 1,00 m
NORTH FACADE
W/O COATING
Window height variation
Height Width Sill h.
1 1,20 m 1,50 m 1,00 m
2 1,20 m 1,50 m 1,00 m
Height Width Sill h.
1 1,70 m 1,50 m 1,00 m
2 1,70 m 1,50 m 1,00 m
Height Width Sill h.
1 1,45 m 1,50 m 1,00 m
2 1,45 m 1,50 m 1,00 m
Height Width Sill h.
1 1,60 m 1,20 m 0,60 m
2 1,20 m 2,20 m 1,00 m
Height Width Sill h.
1 2,20 m 1,20 m 0,60 m
2 1,80 m 2,20 m 1,00 m
Height Width Sill h.
1 2,00 m 1,20 m 0,60 m
2 1,60 m 2,20 m 1,00 m
NC_1.1NC_1.2NC_1.3NC_2.1NC_2.2NC_2.3NC_3.1NC_3.2NC_3.3
W/OSolarcoating
Energy
demand
Day-
light
factor
Operative
temperature
[%]
IAQ
[%]
[kWh/m²] [%] Cat. I Cat. II Cat. I Cat. II
NC_2.1 25 3,0 65 33 35 65
NC_2.2 25 3,9 65 34 36 64
NC_2.3 25 4,9 63 36 37 63
Comments
Illuminancecontourplot
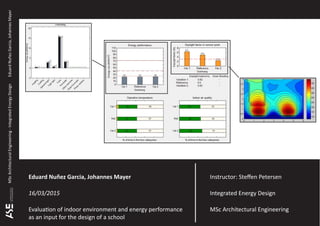
The three different window heights give similar results. For this
reason, option NC_2.3 is chosen as the best one since it is giving
better daylight factors. However, the operative temperatures are
insignificantly lower compared to the other configurations. The
IAQ is slightly better though. In the graph on the right the dis-
tribution of the illuminance is showen for this kind of facade
configuration.
The tables illustrate, that the
solar coating is not giving bet-
ter general values in the cal-
culations. Furthermore, the
option w/o solar coating, as
it is obvious, got slightly bet-
ter DF results. Therefore, the
following calculations for this
orientation have been carri-
ed out w/o solar coating. To
strengthen this decision an
“extreme” calculation is pre-
sented in the APPENDIX A.3.
NC_1.3 w/o solar coating has
been chosen for further in-
verstigations since it gives a
better DF without worsen si-
gnificantly the general values.
W/OSolarcoating
Energy
demand
Day-
light
factor
Operative
temperature
[%]
IAQ
[%]
[kWh/m²] [%] Cat. I Cat. II Cat. I Cat. II
NC_3.1 26 3,6 64 35 36 64
NC_3.2 26 5,5 61 38 37 63
NC_3.3 26 6,4 59 39 37 63
Comments
For this facade configuration option NC_3.3 is the chosen one.
The reasons are the same as in the previous option. Anyhow, ha-
ving similar and acceptable results in all variations, gives the ar-
citect more freedom in his architectural choices. Moreover, it is
possible to see how the asymmetry of the windows affects to the
light distribution.
Illuminancecontourplot
Even though an office room is a place whe-
re people are spending a lot of time, it is
basically a good idea placing those rooms
in the north facing part of a building. One
reason for doing so are the high internal
thermal loads caused by the people wor-
king in the room and by the heat emitting
equipment like desk lights, printers, com-
puters, etc. However, since the solar heat
gains are very little, the importance of a
perfectly working heating system is high.
Another advantage of a north facing office
room is the even daylight distribution cau-
sed by mainly diffuse light.
The tables beside give an overview about
how rooms will be affected depending on
the height of the facade openings. The
models in the middle are the reference
models from which the variations are cre-
ated.
Construction
U-value facade 0,1 W/m²K
Construction type middle heavy
Window
low-e 3-layer glazing 0,76 W/m²K
g-value 0,40
low-e 3-layer glazing +
solar coating
0,73 W/m²K
g-value 0,28
Window frame
U-value 2,20 W/m²K
Psi 0,05 W/mK
Width 0,08 m
Thermal indoor environment
Set points 20-26 °C
Ventilation system
Infiltration 0,06 l/sm²
Min. air change rate 1,52 l/sm²
Max. air change rate 2,27 l/sm²
Max. venting rate 4 l/sm²
Heat exchanger eff. 0,8 -
Cooling system 60 W/m²
Internal thermal loads
Number of people 4 -
Equipment 300 W
Lighting
W/m²/100 lux 3 -
5. MScArchitecturalEngineering-IntegratedEnergyDesignEduardNuñezGarcia,JohannesMayer
5
NORTH FACADE
W/O COATING
Parameter variation
Construction
U-value facade 0,1 W/m²K
Construction type middle heavy
Window
low-e 3-layer glazing 0,76 W/m²K
g-value 0,40
low-e 2-layer glazing 1,19 W/m²K
g-value 0,54
Window frame
U-value 2,20 W/m²K
Psi 0,05 W/mK
Width 0,08 m
Thermal indoor environment
Set points 20-26 °C
Ventilation system
Infiltration 0,06 l/sm²
Min. air change rate 1,52 l/sm²
Max. air change rate 2,27 l/sm²
Max. venting rate 4 l/sm²
Heat exchanger eff. 0,8 -
Cooling system 60 W/m²
Internal thermal loads
Number of people 4 -
Equipment 300 W
Lighting
W/m²/100 lux 3 -
To illustrate the impact of the different
settings in particular on the overall per-
formance of a room, several parameter
variations are made. The parameter in the
middle is always the one used in the refe-
rence model.
For the parameter variations the models
NC_1.3, NC_2.3, and NC_3.3 are used.
Looking at the different values it is eye-
catching that the different changes have
different impacts. Furthermore, certain
parameters have more impact on the
room than others have. Nevertheless, it
has to be mentioned that a change of a
parameter does not have the same impact
on every room. For example, a change of
the U-Value frame in model NC_2.3 has no
impact on the energy demand, whereas
the same change in model NC_1.3 has an
impact on the energy demand.
U-Value facade
[W/m²K]
Construction
type
U-Value frame
[W/m²K]
Wall depth
[m]
Room depth
[m]
Glazing
type
0,08
0,10
0,15
VL*
MH**
VH***
1,80
2,20
2,60
0,30
0,10
0,00
3,00
4,00
5,00
2-layer
3-layer
Energy demand [kWh/m²] 22 22 23 24 22 22 21 22 23 23 22 22 68 22 65 26 22
Daylight factor [%] 7,8 7,8 7,8 7,8 7,8 7,8 7,8 7,8 7,8 6,3 7,8 8,1 11,8 7,8 5,6 8,6 7,8
Daylight autonomy - 0,90 0,90 0,90 0,90 0,90 0,90 0,90 0,90 0,90 0,88 0,90 0,90 0,92 0,90 0,87 0,91 0,90
Operative tempera-
ture [%]
Cat. I 61 60 60 63 60 55 59 60 62 61 60 60 66 60 48 56 60
Cat. II 38 39 39 44 39 33 40 39 37 38 39 39 32 39 52 43 39
IAQ
[%]
Cat. I 39 38 36 38 38 34 38 38 40 38 38 38 33 38 24 37 38
Cat. II 61 62 64 62 62 66 62 62 60 62 62 62 1 62 76 63 62
* VL = very light **MH = middle heavy ***VH = very heavy
U-Value facade
[W/m²K]
Construction
type
U-Value frame
[W/m²K]
Wall depth
[m]
Room depth
[m]
Glazing
type
0,08
0,10
0,15
VL*
MH**
VH***
1,80
2,20
2,60
0,30
0,10
0,00
3,00
4,00
5,00
2-layer
3-layer
Energy demand [kWh/m²] 24 25 25 28 25 25 25 25 25 26 25 25 71 25 68 26 25
Daylight factor [%] 4,9 4,9 4,9 4,9 4,9 4,9 4,9 4,9 4,9 3,9 4,9 5,3 7,1 4,9 3,7 5,8 4,9
Daylight autonomy - 0,85 0,85 0,85 0,85 0,85 0,85 0,85 0,85 0,85 0,82 0,85 0,86 0,89 0,85 0,80 0,88 0,85
Operative tempera-
ture [%]
Cat. I 61 59 57 66 59 53 59 59 58 60 59 58 66 59 47 57 59
Cat. II 39 40 42 33 40 46 40 40 41 39 40 41 33 40 53 42 40
IAQ
[%]
Cat. I 34 33 33 31 33 33 33 33 33 33 33 34 26 33 17 34 33
Cat. II 66 67 67 69 67 67 67 67 67 67 67 66 2 67 83 66 67
* VL = very light **MH = middle heavy ***VH = very heavy
U-Value facade
[W/m²K]
Construction
type
U-Value frame
[W/m²K]
Wall depth
[m]
Room depth
[m]
Glazing
type
0,08
0,10
0,15
VL*
MH**
VH***
1,80
2,20
2,60
0,30
0,10
0,00
3,00
4,00
5,00
2-layer
3-layer
Energy demand [kWh/m²] 25 26 27 28 26 26 26 26 27 27 26 26 72 26 69 27 26
Daylight factor [%] 6,4 6,4 6,4 6,4 6,4 6,4 6,4 6,4 6,4 5,1 6,4 6,7 9,0 6,4 4,6 7,6 6,4
Daylight autonomy - 0,89 0,89 0,89 0,89 0,89 0,89 0,89 0,89 0,89 0,86 0,89 0,89 0,91 0,89 0,84 0,90 0,89
Operative tempera-
ture [%]
Cat. I 52 55 57 63 55 50 56 55 54 56 55 55 63 55 44 53 55
Cat. II 47 44 42 34 44 50 43 44 45 43 44 44 36 44 55 46 44
IAQ
[%]
Cat. I 32 34 35 31 34 34 34 34 33 34 34 34 29 34 20 34 34
Cat. II 68 66 65 69 66 66 66 66 67 66 66 66 1 66 80 66 66
* VL = very light **MH = middle heavy ***VH = very heavy
NC_1.3NC_2.3NC_3.3
6. MScArchitecturalEngineering-IntegratedEnergyDesignEduardNuñezGarcia,JohannesMayer
6
NORTH FACADE
W/O COATING
Impact of roof and gable
Construction
U-value facade 0,1 W/m²K
Construction type middle heavy
Window
low-e 3-layer glazing 0,76 W/m²K
g-value 0,40
- -
Window frame
U-value 2,20 W/m²K
Psi 0,05 W/mK
Width 0,08 m
Thermal indoor environment
Set points 20-26 °C
Ventilation system
Infiltration 0,06 l/sm²
Min. air change rate 1,52 l/sm²
Max. air change rate 2,27 l/sm²
Max. venting rate 4 l/sm²
Heat exchanger eff. 0,8 -
Cooling system 60 W/m²
Internal thermal loads
Number of people 4 -
Equipment 300 W
Lighting
W/m²/100 lux 3 -
Just like the parameter variations, calcula-
tions inlcuding the heat loss through the
roof and the roof plus the gable are made
with the models NC_1.3, NC_2.3, and
NC_3.3.
For those calculations an additional ther-
mal transmittance of 1,80 W/K (Var.1 for
heat loss through the roof) and 3,00 W/K
(Var.2 for heat loss through the roof and
gable) was addded.
Like expected the energy use for heating
is increasing for both variations since the
heat losses are increasing as well. This has
also an impact on the operative tempera-
ture and the IAQ. Both evaluation critea-
rias are getting worse because of the addi-
tional thermal transmittance.
Moreover, it needs to be mentioned that
the other evaluation criteria are not affec-
ted by this change.
NC_1.3NC_2.3NC_3.3
Var. 1. Heat loss through roof
Reference
Var. 2 Heat loss through roof and
gable
Var. 1. Heat loss through roof
Reference
Var. 2 Heat loss through roof and
gable
Var. 1. Heat loss through roof
Reference
Var. 2 Heat loss through roof and
gable
7. MScArchitecturalEngineering-IntegratedEnergyDesignEduardNuñezGarcia,JohannesMayer
7
Energy
demand
Day-
light
factor
Operative
temperature
[%]
IAQ
[%]
[kWh/m²] [%] Cat. I Cat. II Cat. I Cat. II
SC_1.1 19 3,5 56 42 52 48
SC_1.2 19 5,1 57 42 51 49
SC_1.3 19 6,6 57 41 49 51
W/CoatingW/OCoating
Comments
Energy
demand
Day-
light
factor
Operative
temperature
[%]
IAQ
[%]
[kWh/m²] [%] Cat. I Cat. II Cat. I Cat. II
SC_1.1 20 4,2 56 42 57 43
SC_1.2 20 6,1 55 43 55 45
SC_1.3 21 8,0 54 44 54 46
Height Width Sill h.
1 1,20 m 4,00 m 0,90 m
Height Width Sill h.
1 1,80 m 4,00 m 0,90 m
Height Width Sill h.
1 1,50 m 4,00 m 0,90 m
SOUTH FACADE
W/ COATING
Window height variation
Height Width Sill h.
1 1,20 m 1,70 m 0,90 m
2 1,20 m 1,70 m 0,90 m
Height Width Sill h.
1 1,80 m 1,70 m 0,90 m
2 1,80 m 1,70 m 0,90 m
Height Width Sill h.
1 1,50 m 1,70 m 0,90 m
2 1,50 m 1,70 m 0,90 m
Height Width Sill h.
1 1,60 m 1,20 m 1,10 m
2 1,20 m 2,20 m 0,90 m
Height Width Sill h.
1 2,20 m 1,20 m 0,50 m
2 1,80 m 2,20 m 0,90 m
Height Width Sill h.
1 2,00 m 1,20 m 0,70 m
2 1,60 m 2,20 m 0,90 m
SC_1.1SC_1.2SC_1.3SC_2.1SC_2.2SC_2.3SC_3.1SC_3.2SC_3.3
WCoating
Energy
demand
Day-
light
factor
Operative
temperature
[%]
IAQ
[%]
[kWh/m²] [%] Cat. I Cat. II Cat. I Cat. II
SC_2.1 21 2,7 61 37 43 57
SC_2.2 21 3,8 60 39 45 55
SC_2.3 21 5,0 60 39 46 54
Comments
Illuminancecontourplot
Like before, the three different window heights give similar ge-
neral results and equal energy demands of the room. The opti-
on SC_2.3 has been chosen for further simulations. It has been
experienced some sort of error in the illuminance distribution
graph. Since the position of the windows in the façade is symme-
tric it was expected to get a symmetric illuminance distribution
in the horizontal plane.
South facing offices with so-
lar coated glazing have lower
energy demands. The solar co-
ating reduces the solar gains
and therefore the overheating.
Hence, the cooling demand
will be lowered. Furthermore,
the DF is lower but still suffi-
cient to fulfil the regulation
requirements. SC_1.2 has been
used for the parametric varia-
tions in the following slide. The
three different options have si-
milar results. So it is possible
to choose any of them. But it is
important to keep in mind that
the more glazed area the more
expensive the facade.
WCoating
Energy
demand
Day-
light
factor
Operative
temperature
[%]
IAQ
[%]
[kWh/m²] [%] Cat. I Cat. II Cat. I Cat. II
SC_3.1 22 3,3 62 37 42 58
SC_3.2 22 4,5 60 39 54 46
SC_3.3 22 5,1 59 40 47 53
Comments
This facade configuration differs from the other ones, which are
more common. This will give an alternative to the architect. If
he wished another alternative, it will be calculated. The model
SC_3.2 will be used for the calculations in the following slides.
Looking at the illuminace distribution, it is possible to take thed-
ecision about how and where to place desks or different furnitu-
res in the room.
Illuminancecontourplot
Construction
U-value facade 0,1 W/m²K
Construction type middle heavy
Window
low-e 3-layer glazing 0,76 W/m²K
g-value 0,40
low-e 3-layer glazing +
solar coating
0,73 W/m²K
g-value 0,28
Window frame
U-value 2,20 W/m²K
Psi 0,05 W/mK
Width 0,08 m
Thermal indoor environment
Set points 20-26 °C
Ventilation system
Infiltration 0,06 l/sm²
Min. air change rate 1,52 l/sm²
Max. air change rate 2,27 l/sm²
Max. venting rate 4 l/sm²
Heat exchanger eff. 0,8 -
Cooling system 60 W/m²
Internal thermal loads
Number of people 4 -
Equipment 300 W
Lighting
W/m²/100 lux 3 -
In cases where office rooms facing south
are demanded some important issues have
to be mentioned. Since in an office room
are already quite a lot of internal thermal
loads, together with the solar heat gains
the risk of overheating is given. Moreover,
due to the solar radiation throughout the
whole day, the daylight distribution varies
a lot during the day. Furthermore, the risk
of glare is also existent. This might causes
the necessity of a well developed system
of shadings and artificial lighting.
The tables beside give an overview of the
interaction of a room and the height of the
facade openings. The models in the middle
are the reference models from which the
variations are created.
One variation is always with a smaller
window area whereas the other one has
always a larger window area.
8. MScArchitecturalEngineering-IntegratedEnergyDesignEduardNuñezGarcia,JohannesMayer
8
SOUTH FACADE
W/ COATING
Parameter variation
Construction
U-value facade 0,1 W/m²K
Construction type middle heavy
Window
low-e 3-layer glazing +
solar coating
0,73 W/m²K
g-value 0,28
low-e 2-layer glazing +
solar coating
1,09 W/m²K
g-value 0,32
Window frame
U-value 2,20 W/m²K
Psi 0,05 W/mK
Width 0,08 m
Thermal indoor environment
Set points 20-26 °C
Ventilation system
Infiltration 0,06 l/sm²
Min. air change rate 1,52 l/sm²
Max. air change rate 2,27 l/sm²
Max. venting rate 4 l/sm²
Heat exchanger eff. 0,8 -
Cooling system 60 W/m²
Internal thermal loads
Number of people 4 -
Equipment 300 W
Lighting
W/m²/100 lux 3 -
To illustrate the impact of the different
settings in particular on the overall perfor-
mance of a room, several parameter varia-
tions are made. The parameter in the
middle is always the one used in the refe-
rence model.
For the parameter variations the models
SC_1.2, SC_2.3, and SC_3.2 are used.
Looking at the different values it is eye-
catching that the different changes have
different impacts. Furthermore, certain
parameters have more impact on the
room than others have. Nevertheless, it
has to be mentioned that a change of a
parameter does not have the same impact
on every room. For example, reducing the
U-Value of the facade from 0,10 W/m²K to
0,08 W/m²K reduces the energy demand
in model SC_2.3 but not in model SC_1.2.
U-Value facade
[W/m²K]
Construction
type
U-Value frame
[W/m²K]
Wall depth
[m]
Room depth
[m]
Glazing
type
0,08
0,10
0,15
VL*
MH**
VH***
1,80
2,20
2,60
0,30
0,10
0,00
3,00
4,00
5,00
2-layer
3-layer
Energy demand [kWh/m²] 19 19 20 21 19 18 18 19 19 19 19 19 58 19 55 20 19
Daylight factor [%] 5,1 5,1 5,1 5,1 5,1 5,1 5,1 5,1 5,1 4,4 5,1 5,3 8,1 5,1 3,2 5,9 5,1
Daylight autonomy - 0,90 0,90 0,90 0,90 0,90 0,90 0,90 0,90 0,90 0,89 0,90 0,90 0,93 0,90 0,86 0,91 0,90
Operative tempera-
ture [%]
Cat. I 58 58 59 54 58 58 57 58 59 59 58 58 60 58 55 59 58
Cat. II 39 39 39 38 39 40 40 39 39 39 39 39 35 39 44 38 39
IAQ
[%]
Cat. I 48 48 47 41 48 48 50 48 48 47 48 48 43 48 31 46 48
Cat. II 52 52 53 59 52 52 50 52 52 53 52 52 2 52 69 54 52
* VL = very light **MH = middle heavy ***VH = very heavy
U-Value facade
[W/m²K]
Construction
type
U-Value frame
[W/m²K]
Wall depth
[m]
Room depth
[m]
Glazing
type
0,08
0,10
0,15
VL*
MH**
VH***
1,80
2,20
2,60
0,30
0,10
0,00
3,00
4,00
5,00
2-layer
3-layer
Energy demand [kWh/m²] 20 21 23 26 21 20 21 21 22 22 21 21 68 21 60 22 21
Daylight factor [%] 5,0 5,0 5,0 5,0 5,0 5,0 5,0 5,0 5,0 3,9 5,0 5,3 7,1 5,0 3,5 5,9 5,0
Daylight autonomy - 0,90 0,90 0,90 0,90 0,90 0,90 0,90 0,90 0,90 0,88 0,90 0,90 0,92 0,92 0,86 0,91 0,90
Operative tempera-
ture [%]
Cat. I 60 59 55 56 59 57 59 59 58 59 59 59 61 59 54 57 59
Cat. II 39 40 44 40 40 42 40 40 41 40 40 40 37 40 46 42 40
IAQ
[%]
Cat. I 44 43 40 37 43 43 42 43 42 42 43 43 38 43 27 42 43
Cat. II 56 57 60 63 57 57 58 57 58 58 57 57 2 57 73 58 57
* VL = very light **MH = middle heavy ***VH = very heavy
U-Value facade
[W/m²K]
Construction
type
U-Value frame
[W/m²K]
Wall depth
[m]
Room depth
[m]
Glazing
type0,08
0,10
0,15
VL*
MH**
VH***
1,80
2,20
2,60
0,30
0,10
0,00
3,00
4,00
5,00
2-layer
3-layer
Energy demand [kWh/m²] 21 22 24 26 22 21 21 22 22 22 22 21 67 22 62 22 22
Daylight factor [%] 4,5 4,5 4,5 4,5 4,5 4,5 4,5 4,5 4,5 3,7 4,5 4,8 6,8 4,5 3,1 5,3 4,5
Daylight autonomy - 0,89 0,89 0,89 0,89 0,89 0,89 0,89 0,89 0,89 0,87 0,89 0,89 0,90 0,89 0,86 0,91 0,89
Operative tempera-
ture [%]
Cat. I 60 59 56 57 59 58 58 59 57 59 59 59 60 59 53 58 59
Cat. II 39 41 44 39 41 42 41 41 42 40 41 40 38 41 46 41 41
IAQ
[%]
Cat. I 43 41 39 36 41 42 42 41 41 41 41 41 38 41 26 42 41
Cat. II 57 59 61 64 59 58 58 59 59 59 59 59 1 59 74 58 59
* VL = very light **MH = middle heavy ***VH = very heavy
SC_1.2SC_2.3SC_3.2
9. MScArchitecturalEngineering-IntegratedEnergyDesignEduardNuñezGarcia,JohannesMayer
9
SOUTH FACADE
W/ COATING
Impact of roof and gable
Construction
U-value facade 0,1 W/m²K
Construction type middle heavy
Window
low-e 3-layer glazing +
solar coating
0,73 W/m²K
g-value 0,28
- -
Window frame
U-value 2,20 W/m²K
Psi 0,05 W/mK
Width 0,08 m
Thermal indoor environment
Set points 20-26 °C
Ventilation system
Infiltration 0,06 l/sm²
Min. air change rate 1,52 l/sm²
Max. air change rate 2,27 l/sm²
Max. venting rate 4 l/sm²
Heat exchanger eff. 0,8 -
Cooling system 60 W/m²
Internal thermal loads
Number of people 4 -
Equipment 300 W
Lighting
W/m²/100 lux 3 -
Just like the parameter variations, calcula-
tions inlcuding the heat loss through the
roof and the roof plus the gable are made
with the models SC_1.2, SC_2.3, and
SC_3.2.
For those calculations an additional ther-
mal transmittance of 1,80 W/K (Var.1 for
heat loss through the roof) and 3,00 W/K
(Var.2 for heat loss through the roof and
gable) was addded.
Like expected, the energy use for heating
is increasing for both variations since the
heat losses are increasing as well. This has
also an impact on the operative tempera-
ture and the IAQ. Both evaluation critearia
are getting worse because of the additio-
nal thermal transmittance.
Moreover, it needs to be mentioned that
the other evaluation criteria are not affec-
ted by this change.
SC_1.2SC_2.3SC_3.2
Var. 1. Heat loss through roof
Reference
Var. 2 Heat loss through roof and
gable
Var. 1. Heat loss through roof
Reference
Var. 2 Heat loss through roof and
gable
Var. 1. Heat loss through roof
Reference
Var. 2 Heat loss through roof and
gable
10. MScArchitecturalEngineering-IntegratedEnergyDesignEduardNuñezGarcia,JohannesMayer
10
Energy
demand
Day-
light
factor
Operative
temperature
[%]
IAQ
[%]
[kWh/m²] [%] Cat. I Cat. II Cat. I Cat. II
NS_1.1 26 4,0 63 35 36 64
NS_1.2 26 5,8 65 34 35 65
NS_1.3 26 7,9 67 32 36 64
W/BlindsW/OBlinds
Comments
Energy
demand
Day-
light
factor
Operative
temperature
[%]
IAQ
[%]
[kWh/m²] [%] Cat. I Cat. II Cat. I Cat. II
NS_1.1 26 4,0 63 36 40 60
NS_1.2 26 5,8 65 34 38 62
NS_1.3 26 7,6 67 32 38 63
Height Width Sill h.
1 1,10 m 4,00 m 1,00 m
Height Width Sill h.
1 1,70 m 4,00 m 1,00 m
Height Width Sill h.
1 1,40 m 4,00 m 1,00 m
NORTH FACADE
W/O SHADING
Window height variation
Height Width Sill h.
1 1,70 m 1,20 m 1,20 m
2 1,70 m 1,20 m 1,20 m
Height Width Sill h.
1 2,30 m 1,20 m 0,60 m
2 2,30 m 1,20 m 0,60 m
Height Width Sill h.
1 2,00 m 1,20 m 0,90 m
2 2,00 m 1,20 m 0,90 m
Height Width Sill h.
1 0,50 m 5,00 m 2,40 m
2 0,70 m 5,00 m 1,60 m
Height Width Sill h.
1 0,50 m 5,00 m 2,40 m
2 1,30 m 5,00 m 1,00 m
Height Width Sill h.
1 0,50 m 5,00 m 2,40 m
2 1,00 m 5,00 m 1,30 m
NS_1.1NS_1.2NS_1.3NS_2.1NS_2.2NS_2.3NS_3.1NS_3.2NS_3.3
W/OBlinds
Energy
demand
Day-
light
factor
Operative
temperature
[%]
IAQ
[%]
[kWh/m²] [%] Cat. I Cat. II Cat. I Cat. II
NS_2.1 27 3,9 64 35 33 67
NS_2.2 27 4,2 63 36 33 67
NS_2.3 28 4,5 62 37 34 66
Comments
Illuminancecontourplot
This facade configuration causes some challenges and difficulties
to reach the 25 kWh/m² while facing north. However, seen as
part of the whole building this room is still acceptable since other
rooms like bathrooms do not exceed the 25 kWh/m² which equal-
izes the whole building performance. Therefore model NS_2.2 is
the best solution because of the higher daylight factor compared
to NS_2.1 and the lower energy demand compared to NS_2.3.
The table illustrates that the
daylight factor of the different
models does not change at all.
This fact is caused by the cal-
culation program not taking
any shading devices into ac-
count. Moreover, the calcula-
tion of IAQ for NS_1.3 is not
completely correct since it is
exceeding the 100 % mark.
The calculations also show
that installing blinds is a bad
idea since the ‘client’ would
pay for something which is
making the IAQ worse. This
is why the other models were
calculated w/o blinds. See ‘ex-
treme’ case APPENDIX A.1.
W/OBlinds
Energy
demand
Day-
light
factor
Operative
temperature
[%]
IAQ
[%]
[kWh/m²] [%] Cat. I Cat. II Cat. I Cat. II
NS_3.1 25 5,3 92 7 28 72
NS_3.2 25 6,8 92 7 30 70
NS_3.3 26 7,8 92 7 31 69
Comments
This facade configuration is useful if a wide daylight distribution
in the room is desirble. Due to two windows right under the cei-
ling a lot of daylight enters the room. Both illuminance pictures
were made with the reference models (NS_2.2, NS_3.2). Model
NS_3.2 performs the best since the energy demand is not excee-
ding 25 kWh/m², the daylight factor is twice as high as required,
and the operative temp. as well as the IAQ are in cat. I and cat. II
Illuminancecontourplot
Construction
U-value facade 0,1 W/m²K
Construction type middle heavy
Window
low-e 3-layer glazing 0,76 W/m²K
g-value 0,40
- -
Window frame
U-value 2,20 W/m²K
Psi 0,05 W/mK
Width 0,08 m
Thermal indoor environment
Set points 20-26 °C
Ventilation system
Infiltration 0,06 l/sm²
Min. air change rate 1,52 l/sm²
Max. air change rate 2,27 l/sm²
Max. venting rate 4 l/sm²
Heat exchanger eff. 0,8 -
Cooling system 60 W/m²
Internal thermal loads
Number of people 4 -
Equipment 300 W
Lighting
W/m²/100 lux 3 -
The tables beside give an overview about
how rooms will be affected depending on
the height of the facade openings. The
models in the middle are the reference
models form which the variations are crea-
ted. One variation is always with a smaller
window area whereas the other one has
always a larger window area.
Since an overhang for a north facing faca-
de is not reasonable because of the low
solar altitude a blind system with a slat di-
stance of 0,072 m and a slat width of 0,08
m was chosen as a shading device.
Moreover, since the facade is facing north
it was not possible to reach 25 kWh/m² for
all the models. While looking at the overall
building performance it is not a problem
though because of other rooms with lower
energy demand like bathrooms, technical
rooms etc.
11. MScArchitecturalEngineering-IntegratedEnergyDesignEduardNuñezGarcia,JohannesMayer
11
NORTH FACADE
W/O SHADING
Parameter variation
Construction
U-value facade 0,1 W/m²K
Construction type middle heavy
Window
low-e 3-layer glazing 0,76 W/m²K
g-value 0,40
low-e 2-layer glazing 1,79 W/m²K
g-value 0,54
Window frame
U-value 2,20 W/m²K
Psi 0,05 W/mK
Width 0,08 m
Thermal indoor environment
Set points 20-26 °C
Ventilation system
Infiltration 0,06 l/sm²
Min. air change rate 1,52 l/sm²
Max. air change rate 2,27 l/sm²
Max. venting rate 4 l/sm²
Heat exchanger eff. 0,8 -
Cooling system 60 W/m²
Internal thermal loads
Number of people 4 -
Equipment 300 W
Lighting
W/m²/100 lux 3 -
To illustrate the impact of the different
settings in particular on the overall per-
forman of a room, several parameter va-
riations are made. The parameter in the
middle is always the one used in the refe-
rence model.
For the parameter variations the models
NS_1.3, NS_2.2, and NS_3.2 are used.
Looking at the different values it is eye-
catching that the different changes have
different impacts. Furthermore, certain
parameters have more impact on the room
than others have. Nevertheless,it has to be
mentioned that a change of a parameter
does not have the same impact on every
room. For example, a change of the glazing
type in model NS_1.3 has a big impact on
the energy demand, whereas the same ch-
ange in model NS_2.2 does not change the
energy demand. To sum up, it can be said
that it is hard to find a general rule. So it is
advisable to investigate every change.
U-Value facade
[W/m²K]
Construction
type
U-Value frame
[W/m²K]
Wall depth
[m]
Room depth
[m]
Glazing
type
0,08
0,10
0,15
VL*
MH**
VH***
1,80
2,20
2,60
0,30
0,10
0,00
3,00
4,00
5,00
2-layer
3-layer
Energy demand [kWh/m²] 26 26 27 29 26 26 26 26 27 27 26 26 64 26 59 30 26
Daylight factor [%] 7,6 7,6 7,6 7,6 7,6 7,6 7,6 7,6 7,6 6,3 7,6 8,1 11,4 7,6 5,8 9,0 7,6
Daylight autonomy - 0,90 0,90 0,90 0,90 0,90 0,90 0,90 0,90 0,90 0,88 0,90 0,90 0,92 0,90 0,87 0,91 0,90
Operative tempera-
ture [%]
Cat. I 61 60 60 63 60 56 62 60 60 61 60 60 67 60 48 56 60
Cat. II 38 39 39 33 39 44 37 39 39 38 39 39 31 39 51 43 39
IAQ
[%]
Cat. I 38 37 36 34 37 37 37 37 36 37 37 37 33 37 24 37 37
Cat. II 62 63 64 66 63 63 63 63 64 63 63 63 1 63 76 63 63
* VL = very light **MH = middle heavy ***VH = very heavy
U-Value facade
[W/m²K]
Construction
type
U-Value frame
[W/m²K]
Wall depth
[m]
Room depth
[m]
Glazing
type
0,08
0,10
0,15
VL*
MH**
VH***
1,80
2,20
2,60
0,30
0,10
0,00
3,00
4,00
5,00
2-layer
3-layer
Energy demand [kWh/m²] 27 27 30 28 27 26 26 27 27 27 27 26 66 27 63 27 27
Daylight factor [%] 4,2 4,2 4,2 4,2 4,2 4,2 4,2 4,2 4,2 3,2 4,2 4,4 5,8 4,2 3,0 5,1 4,2
Daylight autonomy - 0,83 0,83 0,83 0,83 0,83 0,83 0,83 0,83 0,83 0,77 0,83 0,83 0,87 0,83 0,77 0,85 0,83
Operative tempera-
ture [%]
Cat. I 61 59 55 66 59 54 60 58 59 61 59 60 67 59 47 57 59
Cat. II 38 40 44 31 40 45 40 40 40 38 40 39 32 40 52 42 40
IAQ
[%]
Cat. I 32 31 28 30 31 30 31 31 30 30 31 31 25 31 16 32 31
Cat. II 68 69 72 70 69 70 69 69 70 70 69 69 2 69 84 68 69
* VL = very light **MH = middle heavy ***VH = very heavy
U-Value facade
[W/m²K]
Construction
type
U-Value frame
[W/m²K]
Wall depth
[m]
Room depth
[m]
Glazing
type
0,08
0,10
0,15
VL*
MH**
VH***
1,80
2,20
2,60
0,30
0,10
0,00
3,00
4,00
5,00
2-layer
3-layer
Energy demand [kWh/m²] 24 25 28 25 25 25 23 25 26 25 25 25 28 25 25 26 25
Daylight factor [%] 6,8 6,8 6,8 6,8 6,8 6,8 6,8 6,8 6,8 4,8 6,8 7,3 10,8 6,8 6,1 8,1 6,8
Daylight autonomy - 0,89 0,89 0,89 0,89 0,89 0,89 0,89 0,89 0,89 0,85 0,89 0,89 0,92 0,89 0,88 0,9 0,89
Operative tempera-
ture [%]
Cat. I 92 92 92 75 92 93 91 92 92 92 92 92 90 92 92 92 92
Cat. II 7 7 7 16 7 6 8 7 7 7 7 7 8 7 7 7 7
IAQ
[%]
Cat. I 31 30 28 24 30 31 32 30 30 30 30 30 32 30 20 30 30
Cat. II 69 70 72 76 70 69 68 70 70 70 70 70 2 70 80 70 70
* VL = very light **MH = middle heavy ***VH = very heavy
NS_1.3NS_2.2NS_3.2
12. MScArchitecturalEngineering-IntegratedEnergyDesignEduardNuñezGarcia,JohannesMayer
12
NORTH FACADE
W/O SHADING
Impact of roof and gable
Construction
U-value facade 0,1 W/m²K
Construction type middle heavy
Window
low-e 3-layer glazing 0,76 W/m²K
g-value 0,40
- -
Window frame
U-value 2,20 W/m²K
Psi 0,05 W/mK
Width 0,08 m
Thermal indoor environment
Set points 20-26 °C
Ventilation system
Infiltration 0,06 l/sm²
Min. air change rate 1,52 l/sm²
Max. air change rate 2,27 l/sm²
Max. venting rate 4 l/sm²
Heat exchanger eff. 0,8 -
Cooling system 60 W/m²
Internal thermal loads
Number of people 4 -
Equipment 300 W
Lighting
W/m²/100 lux 3 -
Just like the parameter variations, calcula-
tions inlcuding the heat loss through the
roof and the roof plus the gable are made
with the models NS_1.3, NS_2.2, and
NS_3.2.
For those calculations an additional ther-
mal transmittance of 1,80 W/K (Var.1 for
heat loss through the roof) and 3,00 W/K
(Var.2 for heat loss through the roof and
gable) was addded.
Like expected, the energy use for heating
is increasing for both variations since the
heat losses are increasing as well. This has
also an impact on the operative tempera-
ture and the IAQ. Both evaluation critearia
are getting worse because of the additio-
nal thermal transmittance.
Moreover, it needs to be mentioned that
the other evaluation criteria are not affec-
ted by this change.
NS_1.3NS_2.2NS_3.2
Var. 1. Heat loss through roof
Reference
Var. 2 Heat loss through roof and
gable
Var. 1. Heat loss through roof
Reference
Var. 2 Heat loss through roof and
gable
Var. 1. Heat loss through roof
Reference
Var. 2 Heat loss through roof and
gable
13. MScArchitecturalEngineering-IntegratedEnergyDesignEduardNuñezGarcia,JohannesMayer
13
Energy
demand
Day-
light
factor
Operative
temperature
[%]
IAQ
[%]
[kWh/m²] [%] Cat. I Cat. II Cat. I Cat. II
SS_1.1 24 2,9 56 39 57 43
SS_1.2 24 5,2 57 41 54 46
SS_1.3 24 6,1 58 41 50 50
W/1,0mOverhangW/OOverhang
Comments
Energy
demand
Day-
light
factor
Operative
temperature
[%]
IAQ
[%]
[kWh/m²] [%] Cat. I Cat. II Cat. I Cat. II
SS_1.1 24 3,8 56 39 57 43
SS_1.2 24 6,3 56 40 55 45
SS_1.3 24 9,8 57 40 51 49
Height Width Sill h.
1 1,00 m 4,50 m 1,00 m
Height Width Sill h.
1 1,90 m 4,50 m 1,00 m
Height Width Sill h.
1 1,40 m 4,50 m 1,00 m
SOUTH FACADE
W/O SHADING
Window height variation
Height Width Sill h.
1 1,20 m 1,70 m 1,00 m
2 1,20 m 1,70 m 1,00 m
Height Width Sill h.
1 1,90 m 1,70 m 1,00 m
2 1,90 m 1,70 m 1,00 m
Height Width Sill h.
1 1,60 m 1,70 m 1,00 m
2 1,60 m 1,70 m 1,00 m
Height Width Sill h.
1 1,50 m 1,20 m 0,70 m
2 0,90 m 2,25 m 1,30 m
Height Width Sill h.
1 2,10 m 1,20 m 0,70 m
2 1,50 m 2,25m 1,30 m
Height Width Sill h.
1 1,80 m 1,20 m 0,70 m
2 1,20 m 2,25 m 1,30 m
SS_1.1SS_1.2SS_1.3SS_2.1SS_2.2SS_2.3SS_3.1SS_3.2SS_3.3
W/OOverhang
Energy
demand
Day-
light
factor
Operative
temperature
[%]
IAQ
[%]
[kWh/m²] [%] Cat. I Cat. II Cat. I Cat. II
SS_2.1 25 3,0 61 37 46 54
SS_2.2 24 4,7 59 38 48 52
SS_2.3 24 6,2 58 39 51 49
Comments
Illuminancecontourplot
The different height variations of facade configuration 2 are sho-
wing that model SS_2.3 is the best solution. Installing windows
right under the ceiling increases the daylight factor a lot and im-
proves the Indoor Air Quality (IAQ) in an indirect way.
The picture to the right illustrates the illuminance distribution
occurring in the room. However, even after long discussions, er-
ror searching etc. we could not find an explanation for the diffe-
rent distribution of the two windows.
Using an overhang for the
office room is, in this case,
according to IDbuild not re-
commendable. Since the day-
light factor for the variation
with an overhang is decrea-
sing and the IAQ is the same
or also decreasing it does not
make sense to install an over-
hang. To highlight the impact
of an overhang on the room
an ‚extreme‘ case was created
(see APPENDIX A.2).
Since the calculations showed
it is better not having an over-
hang, the following variations
were calculated without.
W/OOverhang
Energy
demand
Day-
light
factor
Operative
temperature
[%]
IAQ
[%]
[kWh/m²] [%] Cat. I Cat. II Cat. I Cat. II
SS_3.1 25 2,8 62 36 44 56
SS_3.2 25 3,5 60 38 47 53
SS_3.3 24 5,9 59 39 49 51
Comments
Even though the energy demand, the operative temperature and
the IAQ of all the three height variations are good, variation
SS_3.1 can not be used since the daylight factor is only 2,8. These
variations are a good example to illustrate that the daylight factor
stongly denpends on the upper end of the window. The closer the
window is to the ceiling, the higher the daylight factor is.
Model SS_3.3 is the best solution because it has the lowest energy
demand.
Illuminancecontourplot
Construction
U-value facade 0,1 W/m²K
Construction type middle heavy
Window
low-e 3-layer glazing 0,76 W/m²K
g-value 0,40
- -
Window frame
U-value 2,20 W/m²K
Psi 0,05 W/mK
Width 0,08 m
Thermal indoor environment
Set points 20-26 °C
Ventilation system
Infiltration 0,06 l/sm²
Min. air change rate 1,52 l/sm²
Max. air change rate 2,27 l/sm²
Max. venting rate 4 l/sm²
Heat exchanger eff. 0,8 -
Cooling system 60 W/m²
Internal thermal loads
Number of people 4 -
Equipment 300 W
Lighting
W/m²/100 lux 3 -
The tables beside give an overview about
how rooms will be affected depending on
the height of the facade openings. The
models in the middle are the reference
models form which the variations are crea-
ted. One variation is always with a smaller
window area whereas the other one has
always a larger window area.
Since this time the facade is facing south
an overhang was chosen as a shading de-
vice. The overhang has a length of 1,00 m
and is always placed on the upper edge of
the room.
Before calculating all models with an over-
hang the first model was tested with an
overhang. The results showed that using
an overhang is making the performance of
the room worse. Less light is coming into
the room and the IAQ is also getting wor-
se. Therefore, we decided to calculate the
other models without any shading devices.
14. MScArchitecturalEngineering-IntegratedEnergyDesignEduardNuñezGarcia,JohannesMayer
14
SOUTH FACADE
W/O SHADING
Parameter variation
Construction
U-value facade 0,1 W/m²K
Construction type middle heavy
Window
low-e 3-layer glazing 0,76 W/m²K
g-value 0,40
low-e 2-layer glazing 1,19 W/m²K
g-value 0,54
Window frame
U-value 2,20 W/m²K
Psi 0,05 W/mK
Width 0,08 m
Thermal indoor environment
Set points 20-26 °C
Ventilation system
Infiltration 0,06 l/sm²
Min. air change rate 1,52 l/sm²
Max. air change rate 2,27 l/sm²
Max. venting rate 4 l/sm²
Heat exchanger eff. 0,8 -
Cooling system 60 W/m²
Internal thermal loads
Number of people 4 -
Equipment 300 W
Lighting
W/m²/100 lux 3 -
To illustrate the impact of the different
settings in particular on the overall per-
forman of a room, several parameter va-
riations are made. The parameter in the
middle is always the one used in the refe-
rence model.
For the parameter variations the models
SS_1.2, SS_2.3, and SS_3.3 are used.
Looking at the different values it is eye-
catching that the different changes have
different impacts. Furthermore, certain
parameters have more impact on the
room than others have. Nevertheless, it
has to be mentioned that a change of a
parameter does not have the same impact
on every room. For example, reducing the
U-Value of the facade from 0,10 W/m²K to
0,08 W/m²K reduces the energy demand
in model SS_2.3 but not in model SS_1.2.
Therefore, once again, it is risky to give
a general advice. Each change has to be
thought through carefully before doing so.
U-Value facade
[W/m²K]
Construction
type
U-Value frame
[W/m²K]
Wall depth
[m]
Room depth
[m]
Glazing
type
0,08
0,10
0,15
VL*
MH**
VH***
1,80
2,20
2,60
0,30
0,10
0,00
3,00
4,00
5,00
2-layer
3-layer
Energy demand [kWh/m²] 24 24 24 27 23 23 23 23 23 23 23 23 53 24 52 24 23
Daylight factor [%] 6,3 6,3 6,3 6,3 6,3 6,3 6,3 6,3 6,3 5,5 6,3 6,6 9,6 6,3 4,1 7,4 6,3
Daylight autonomy - 0,92 0,92 0,92 0,92 0,92 0,92 0,92 0,92 0,92 0,91 0,92 0,92 0,94 0,92 0,88 0,93 0,92
Operative tempera-
ture [%]
Cat. I 58 58 58 46 58 59 57 58 57 58 58 57 57 58 53 57 58
Cat. II 39 39 38 43 39 39 39 39 39 39 39 40 36 39 45 38 39
IAQ
[%]
Cat. I 53 53 52 46 53 53 52 53 55 52 53 51 50 53 39 53 53
Cat. II 47 47 48 64 47 47 48 47 45 48 47 49 1 47 61 47 47
* VL = very light **MH = middle heavy ***VH = very heavy
U-Value facade
[W/m²K]
Construction
type
U-Value frame
[W/m²K]
Wall depth
[m]
Room depth
[m]
Glazing
type
0,08
0,10
0,15
VL*
MH**
VH***
1,80
2,20
2,60
0,30
0,10
0,00
3,00
4,00
5,00
2-layer
3-layer
Energy demand [kWh/m²] 23 24 24 31 24 23 24 24 25 25 24 25 59 24 53 25 24
Daylight factor [%] 6,2 6,2 6,2 6,2 6,2 6,2 6,2 6,2 6,2 5,0 6,2 6,4 8,1 6,2 4,1 7,4 6,2
Daylight autonomy - 0,91 0,91 0,91 0,91 0,91 0,91 0,91 0,91 0,91 0,89 0,91 0,92 0,93 0,91 0,88 0,92 0,91
Operative tempera-
ture [%]
Cat. I 60 59 58 52 59 59 59 59 59 59 59 59 60 59 52 59 59
Cat. II 39 40 41 43 40 40 40 40 40 39 40 40 38 40 47 40 40
IAQ
[%]
Cat. I 49 48 46 44 48 48 48 48 48 47 48 48 47 48 36 49 48
Cat. II 51 52 54 56 52 52 52 52 52 53 52 52 2 52 64 51 52
* VL = very light **MH = middle heavy ***VH = very heavy
U-Value facade
[W/m²K]
Construction
type
U-Value frame
[W/m²K]
Wall depth
[m]
Room depth
[m]
Glazing
type
0,08
0,10
0,15
VL*
MH**
VH***
1,80
2,20
2,60
0,30
0,10
0,00
3,00
4,00
5,00
2-layer
3-layer
Energy demand [kWh/m²] 24 24 26 30 24 22 24 24 24 24 24 24 58 24 57 24 24
Daylight factor [%] 5,9 5,9 5,9 5,6 5,9 5,9 5,9 5,9 5,9 4,5 5,9 6,2 7,9 5,9 4,1 7,0 5,9
Daylight autonomy - 0,90 0,90 0,90 0,90 0,90 0,90 0,90 0,90 0,90 0,88 0,90 0,91 0,92 0,90 0,88 0,92 0,90
Operative tempera-
ture [%]
Cat. I 60 60 57 53 60 58 60 60 59 60 60 59 61 60 56 59 60
Cat. II 39 39 42 41 39 41 39 39 40 39 39 40 37 39 44 41 39
IAQ
[%]
Cat. I 47 46 44 42 46 47 46 46 46 46 46 46 44 46 12 48 46
Cat. II 53 54 56 58 54 53 54 54 54 54 54 54 2 54 88 52 54
* VL = very light **MH = middle heavy ***VH = very heavy
SS_1.2SS_2.3SS_3.3
15. MScArchitecturalEngineering-IntegratedEnergyDesignEduardNuñezGarcia,JohannesMayer
15
SOUTH FACADE
W/O SHADING
Impact of roof and gable
Construction
U-value facade 0,1 W/m²K
Construction type middle heavy
Window
low-e 3-layer glazing 0,76 W/m²K
g-value 0,40
- -
Window frame
U-value 2,20 W/m²K
Psi 0,05 W/mK
Width 0,08 m
Thermal indoor environment
Set points 20-26 °C
Ventilation system
Infiltration 0,06 l/sm²
Min. air change rate 1,52 l/sm²
Max. air change rate 2,27 l/sm²
Max. venting rate 4 l/sm²
Heat exchanger eff. 0,8 -
Cooling system 60 W/m²
Internal thermal loads
Number of people 4 -
Equipment 300 W
Lighting
W/m²/100 lux 3 -
Just like the parameter variations, calcu-
lations inlcuding the heat loss through
the roof and the roof plus the gable are
made with the models SS_1.2, SS_2.3, and
SS_3.3.
For those calculations an additional ther-
mal transmittance of 1,80 W/K (Var.1 for
heat loss through the roof) and 3,00 W/K
(Var.2 for heat loss through the roof and
gable) was addded.
Like expected, the energy use for heating
is increasing for both variations since the
heat losses are increasing as well. This has
also an impact on the operative tempera-
ture and the IAQ. Both evaluation critearia
are getting worse because of the additio-
nal thermal transmittance.
Moreover, it needs to be mentioned that
the other evaluation criteria are not affec-
ted by this change.
SS_1.2SS_2.3SS_3.3
Var. 1. Heat loss through roof
Reference
Var. 2 Heat loss through roof and
gable
Var. 1. Heat loss through roof
Reference
Var. 2 Heat loss through roof and
gable
Var. 1. Heat loss through roof
Reference
Var. 2 Heat loss through roof and
gable
16. MScArchitecturalEngineering-IntegratedEnergyDesignEduardNuñezGarcia,JohannesMayer
16
CLASSROOM
NORTH FACADE
Energy
demand
Daylight
factor
Daylight
autonomy
IAQ
[%]
Hours outside
temp. range
Room
[kWh/m²] [%] - Cat. I Cat. II [h]
25 3,1 0,86 49 41 37
Energy
demand
Daylight
factor
Daylight
autonomy
IAQ
[%]
Hours outside
temp. range
Room w/
heat loss
through roof
[kWh/m²] [%] - Cat. I Cat. II [h]
27 3,1 0,86 52 42 15
Construction
U-value facade 0,1 W/m²K
Construction type middle heavy
Window
low-e 2-layer glazing 1,63 W/m²K
SHGC 0,28
Window frame
U-value 1,8 W/m²K
Psi 0,05 W/mK
Width 0,08 m
Thermal indoor environment
Set points 20-26 °C
Ventilation system non-occupied hours
Infiltration 0,06 l/sm²
Min. air change rate 0 l/sm²
Max. air change rate 0 l/sm²
Max. venting rate 1 l/sm²
Heat exchanger eff. 0,8 -
Cooling system 0 W/m²
Internal thermal loads
Number of people 32 -
Equipment 100 W
Lighting
W/m²/100 lux 2 -
The calculations and simulations beside
are made for different fenestration confi-
gurations for a north facing classroom.
Basically, placing classrooms in the north
facing side of a buidling is a good idea.
Since the internal thermal loads are due
to many people in the room very high, the
risk of overheating is present. Moreover,
depending on the type of school, people
might bring laptops and other heat emit-
ting electrical devices. This is another rea-
son why further heat gains, like solar heat
gains should be avoided.
Furthermore, north facing facades are
causing a more even light distribution in
the room compared to other orientations
because of the high amount of diffuse light
entering through the facade openings. This
is especially desired in classrooms since
the risk of glare on the desks or the black-
boards is not given.
Each of the calculations are made by the use of the Rhinoceros plug-in Grasshop-
per and its components DIVA, VIPER, and ICEBEAR. Furthermore, all the class-
rooms with its different fenestration configurations are developed on the requi-
rement of an energy demand of 25 kWh/m² and a minimum facade opening of
15 % of the floor area of the room.
CONFIGURATION I NORTH and CONFIGURATION I SOUTH are facade configura-
tions with only openings facing north/south, whereas CONFIGURTION II NORTH
and CONFIGURATION II SOUTH are variations which also include a skylight closer
to the other side of the room to get daylight deeper into the room.
Even though the connections, the parameters, and the components in Grasshop-
per were checked over and over again, the calculations and simulations done for
CONFIGURATION I NORTH, CONFIGURATION II NORTH, CONFIGURATION I SOUTH,
and CONFIGURATION II SOUTH are not reliable!
The following section (page 16 & 17) is going to explain the main problems occu-
ring while working with the different Grasshopper components.
After the room model was created and each of the connections as well as the
parameters were defined we tried for the first time to get results out of the
Grasshopper model without success. Therefore we checked the connections and
components again and compared our model with the models of fellow students,
what showed us that the components were connected correctly. After closing and
opening (without any changes) the Grasshopper model we got results. This was
the main problem throughout the whole project - sometimes we got results, so-
metimes we did not. (see page 17 for further description of the problems)
Energy
demand
Daylight
factor
Daylight
autonomy
IAQ
[%]
Hours outside
temp. range
Room
[kWh/m²] [%] - Cat. I Cat. II [h]
27 19,9 0,96 47 47 14
Ventilation system occupied hours
Infiltration Min. air change rate Max. air change rate Max. venting rate
0,06 l/sm² 4,4 l/sm² 4,4 l/sm² 5,0 l/sm²
Ventilation system occupied hours
Infiltration Min. air change rate Max. air change rate Max. venting rate
0,06 l/sm² 4,6 l/sm² 4,6 l/sm² 5,0 l/sm²
CONFIGURATIONINORTHCONFIGURATIONIINORTH
Illuminance control output (IDbuild)
17. MScArchitecturalEngineering-IntegratedEnergyDesignEduardNuñezGarcia,JohannesMayer
17
CLASSROOM
SOUTH FACADE
Energy
demand
Daylight
factor
Daylight
autonomy
IAQ
[%]
Hours outside
temp. range
Room
[kWh/m²] [%] - Cat. I Cat. II [h]
25 3,1 0,90 49 42 34
Energy
demand
Daylight
factor
Daylight
autonomy
IAQ
[%]
Hours outside
temp. range
Room w/
heat loss
through roof
[kWh/m²] [%] - Cat. I Cat. II [h]
27 3,1 0,9 49 45 18
Construction
U-value facade 0,1 W/m²K
Construction type middle heavy
Window
low-e 2-layer glazing 1,63 W/m²K
SHGC 0,28
Window frame
U-value 1,8 W/m²K
Psi 0,05 W/mK
Width 0,08 m
Thermal indoor environment
Set points 20-26 °C
Ventilation system non-occupied hours
Infiltration 0,06 l/sm²
Min. air change rate 0 l/sm²
Max. air change rate 0 l/sm²
Max. venting rate 1 l/sm²
Heat exchanger eff. 0,8 -
Cooling system 0 W/m²
Internal thermal loads
Number of people 32 -
Equipment 100 W
Lighting
W/m²/100 lux 2 -
Having a classroom with windows facing
south might causes some problems.
Since the heat loads in the classrooms are
already quite high through the internal
loads (students & teacher(s), laptops, pro-
jectors, etc.), additional solar heat gains
cause overheating.
Furthermore, getting the solar radiation
from the morning sun, the midday sun, the
afternoon sun, and the evening sun into
the classroom results in a strongly changing
illuminance distribution. Students and tea-
chers working in the rooms need uniform-
ly and constantly distributed light though.
This is why an intelligently developed artifi-
cial lighting system to compensate the fluc-
tuations is extremely important. Another
possibility to control this problem could be
a shading device which distributes the light
more uniformly.
(continuation of page 16)
Moreover, while calculating the daylight factor we realised that it was changing
sometimes without changing the window(s) properties. Furthermore, the DIVA
Daylight component claimed sometimes, that reducing the window area would
cause a higher daylight factor.
Also changing the air change rate did not have the consequences as expected. For
example changing the air change rate from 4 l/sm² to 8 l/sm² changed the IAQ for
only 1 % in total.
Additionally, the output hours_DS15251 from ICEbear_performanceEvaluation
was never given.
Therefore, we decided to calculate the same room model in IDbuild to get an
understanding of how the results should look like. Those caluclations showed us
that the deviation of the results are sometimes enormous. For example the day-
light factor calculated with the Grasshopper model was 3,1 and 7,7 with IDbuild.
Moreover, we have to mention that even after using the air change rate calculated
by IDbuild the results of the Grasshopper model for the IAQ were far away from
indoor environment class I or II.
In our opinion the problems lie, at least most of the times, somewhere in the ICE-
bear_DIVA component. We believe that this component does not understand the
input it gets. However, there are several doubtful components whose calculations
cause a lot of question.
Nevertheless, even though the Grasshopper model was not working properly, we
saw, e.g. that creating our own user schedule, which defined the non-occupied
hours during the summer breaks can help a lot reducing the energy demand.
Energy
demand
Daylight
factor
Daylight
autonomy
IAQ
[%]
Hours outside
temp. range
Room
[kWh/m²] [%] - Cat. I Cat. II [h]
25 9,0 0,94 51 43 7
Ventilation system occupied hours
Infiltration Min. air change rate Max. air change rate Max. venting rate
0,06 l/sm² 4,4 l/sm² 4,4 l/sm² 5,0 l/sm²
Ventilation system occupied hours
Infiltration Min. air change rate Max. air change rate Max. venting rate
0,06 l/sm² 4,7 l/sm² 4,7 l/sm² 5,0 l/sm²
Illuminance control output (IDbuild)
CONFIGURATIONISOUTHCONFIGURATIONIISOUTH
18. MScArchitecturalEngineering-IntegratedEnergyDesignEduardNuñezGarcia,JohannesMayer
18
VENTILATION
CONCEPT I
The ventilation scheme is based on a centralized system with a heat recovery ventilation unit,
composed by different module units. Due to the high flow rate it was not possible to find a stan-
dardized unit from a commercial supplier.
Rectangular ducts have been used. This duct typology has higher pressure losses compared to a
circular system with the same section area. On the other hand, rectangular ducts use space more
efficiently.
The main advantage of this system is, that less different elements are needed. Just one unit is
required, one technical room, a single vertical shaft and less duct material in general.
However, the vertical shaft has to be bigger. It is also important to realize that in the corridor of
the building, the ceiling height will be a bit lower in the point, where the main duct is divided in
two opposite directions.
It is convenient to have the main branch in the corridor. In this way only the ceiling height of the
corridor is reduced. The ceilings in the offices and classrooms can be higher thanks to smaller
connection ducts.
There is a special point in the technical room, where the vertical shafts are bended to reach the
ventilation unit. That point should be solved by choosing properly the right connection elements.
Finally, different kind of diffusers can be chosen in the final design, e.g. diffusing ceiling, standard
diffusers, etc.
INTORDUCTION TO VENTILATION SLIDES
The ventilation of a building might suppo-
se a huge percentage of the final energy
consumption; therefore it is interesting to
reduce its energy demand.
According to the Danish regulations (BR20),
the building requires heat recovery ventila-
tion system with a minimum efficiency of
75 %. That will help to reduce the heating/
cooling energy demand. Consequently it is
important to create a thoroughly thought
design, since it will affect to both “IAQ”
and “heating/cooling” energy demand.
At the same time it is convenient to try
to save as much energy as possible in the
ventilation for the following reason. The
ventilation design it is going to restrict the
design freedom of the architect in a lower
extend than other aspects. Most likely is
not going to affect to the façade configura-
tion, an issue which architects give a lot of
importance. So the lower is the ventilation
consumption the more freedom the archi-
tect will have in order to take other design
decisions.
However, the architect should be aware to
respect the height of the ceilings in the dif-
ferent floors, and also leave space enough
to place the technical room and shafts as
showed in the drawings.
In order to reduce the electric consumpti-
on (SFP) of the equipment it is important
to reduce the pressure losses of the system
due to the direct relation between these
two parameters. To achieve this purpose
it is needed to create ducts with a larger
area. This area increment will reduce the
velocity of the air through the duct and
thus the pressure losses. Nevertheless by
reducing the velocity the system will re-
duce the noise output.
This slide presents the main idea for the
ventilation system; this principle might suf-
fer little changes in the upcoming design
phases. It is also going to be developed in
further detail once the final building design
will be chosen, yet the duct areas and flows
has to be respected to the extent possible.
Min. height technical room
4,74 m
Min. area technical room
169,00 m²
Height suspended ceiling
1,00 m
Max. air velocity in system
2,83 m/s
Min. air velocity in system
1,02 m/s
Pressure drop in ducts
21Pa
SFP (used in IDbuild)
1500 J/m³
Inlet air
Outlet air
Exhaust
Supply
(EXHAUSTO, 2015)
19. MScArchitecturalEngineering-IntegratedEnergyDesignEduardNuñezGarcia,JohannesMayer
19
VENTILATION
CONCEPT II
This second proposal is based on a decentralized system composed by two ventilation units placed
in both endings of the building. The chosen heat recovery ventilation units are standardized by the
commercial brand. The duct system is based on rectangular ducts like in the previous proposal.
The main advantage of this system is that the flow rate in the vertical shafts is lower. Thus, if we
use the same section than in the previous system we can reduce the pressure losses in the main
shaft.
In this system the height of the suspended ceiling has been reduced from 1 metre to 60 centime-
tres. Therefore, the pressure losses are slightly higher, but at the same time we are increasing the
volume in the rooms. Having more volume can help to improve the IAQ, since e.g. the CO2 concen-
trations will be reduced having the same amount of people. Once again it is a trade-off that has to
be further studied to find the option that fits the best to the final design.
The principal inconvenient of this system is the fact that two technical rooms and two different
ventilation units will be needed. This will take out much more space in the basement, since the
required area for the technical rooms is not significantly smaller than the area required for the
system presented in the previous slide.
An alternative and probably a better solution would be placing the units at 1/4 and 3/4 in the
longitudinal dimension of the building instead of placing them in the extremes. In this manner the
critical path for the pressure losses would be reduced and thus the global pressure losses.
INTORDUCTION TO VENTILATION SLIDES
The ventilation of a building might suppo-
se a huge percentage of the final energy
consumption; therefore it is interesting to
reduce its energy demand.
According to the Danish regulations (BR20),
the building requires heat recovery ventila-
tion system with a minimum efficiency of
75 %. That will help to reduce the heating/
cooling energy demand. Consequently it is
important to create a thoroughly thought
design, since it will affect to both “IAQ”
and “heating/cooling” energy demand.
At the same time it is convenient to try
to save as much energy as possible in the
ventilation for the following reason. The
ventilation design it is going to restrict the
design freedom of the architect in a lower
extend than other aspects. Most likely is
not going to affect to the façade configura-
tion, an issue which architects give a lot of
importance. So the lower is the ventilation
consumption the more freedom the archi-
tect will have in order to take other design
decisions.
However, the architect should be aware to
respect the height of the ceilings in the dif-
ferent floors, and also leave space enough
to place the technical room and shafts as
showed in the drawings.
In order to reduce the electric consumpti-
on (SFP) of the equipment it is important
to reduce the pressure losses of the system
due to the direct relation between these
two parameters. To achieve this purpose
it is needed to create ducts with a larger
area. This area increment will reduce the
velocity of the air through the duct and
thus the pressure losses. Nevertheless by
reducing the velocity the system will re-
duce the noise output.
This slide presents the main idea for the
ventilation system; this principle might suf-
fer little changes in the upcoming design
phases. It is also going to be developed in
further detail once the final building design
will be chosen, yet the duct areas and flows
has to be respected to the extent possible.
Min. height technical room
4,21 m
Min. area technical room
123,00 m²
Height suspended ceiling
0,60 m
Max. air velocity in system
2,53 m/s
Min. air velocity in system
0,96 m/s
Pressure drop in ducts
40 Pa
SFP (used in IDbuild)
1500 J/m³
Inlet air
Outlet air
Exhaust
Supply
(EXHAUSTO, 2015)
20. MScArchitecturalEngineering-IntegratedEnergyDesignEduardNuñezGarcia,JohannesMayer
20
In the previous points of this report it is possible to notice that it is feasible to achieve an energy consumption of 25 kWh/m2/year in the different rooms. That means that the building would perform within the energy
frame for BR20. In order to get an estimation of the annual consumption of the building it will be considered that the whole area is consuming 25 kWh/m², seen as a worst-case-scenario. It is sensible expecting that spaces
such as corridors or toilets will have a lower consumption. On the other hand the area of the basement will not be taken into account.
Area per floor Number of floors Area total Consumption Annual consumption total
650 m² 2 1300 m² 25 kWh/m² 32,5 MWh
With the aim of giving a sense about how much the annual energy consumption is, a brief calculation has been carried out. The annual consumption has been compared to the amount of energy that might be produced
using a certain area of the building roof to install PV panels.
PV panel dimension Max. Power (STC) Panel type
1000 mm x 1600 mm 285 W Monocrystalline
(Center, 2015), (SolarWorld, 2015)
Thus, using 200 m² of the roof for producing electricity, we can get almost the same amount of energy than the energy consumed by the building. However, the possibility of using this energy will depend on the produc-
tion/consumption throughout the year. Nevertheless, it is important to keep in mind that the electricity for appliances and office equipment is not taken into account within the 25 kWh/m² energy-frame.
There are a lot of different factors which can affect the energy performance of a building. Moreover, they can arise from really different natures. All these parameters are interrelated at some extent and their effect to the
building changes in every different situation. Hence, using rules-of-thumb might not be rigorous and lead to poor design decisions. The main strength of the tool used in this approach is the possibility of creating as many
combinations as desired, by using the parametric variation.
Although the tool is relatively easy to use, the user should have a some engineering skills and should be aware of the following issue. When using IDbuild we are assuming some values that are really sensitive for the
calculation of the simulations, as it would be the “SFP”. Hence, it is really important to state that if these values are not fulfilled, it is impossible to reach the expected results. For example the changes in the configuration
façade could become meaningless for the real performance since they might be overruled by the energy consumption of the ventilation.
As a suggestion for an improvement of the tool and related to the previous paragraph, it could be interesting that once the calculations are done, the program would provide some possible values for SELcomfort and SEL-
cooling. That might be feasible since IDbuild performs the calculations based on a given SFP and the program creates the data for the air volume used for comfort and cooling. Thus, the designer would have more hints
in order to choose the right ventilation unit.
Regarding the approach it could be useful to create a table with all the existing parameters in IDbuild. This table could be used in the first meeting of the team in order to notice the limitations of the project, meaning
that some parameters should be fixed. For example, if the upcoming building is going to be built in concrete it does not make sense carrying simulation with a light-construction type. That would save time in the early
design phase and therefore money.
Discussion
Overall building energy performance
Conclusion
Area roof Area installed PV panels Number of PV panels Annual energy production
650 m² 200 m² 124 30,2 MWh
While going through all the different tasks in the project we developed an understanding of how complex the whole structure of various parameters and their interactions can be. This is why we concluded that working in
an Integrated Design Process means, it is not possible to find a ‚default recipe‘, which can be applied by anyone to every project. Therefore, having a wide background knowledge about the interaction of different variables
is unavoidable to guarantee a well working design process.
Due to the multiple interrelations among the parameters it makes hard to predict the impact of a single variation on the entirety. Thus, it is really helpful having a simulation tool, which allows us to get objective and re-
liable values for certain scenarios. These scenarios can be adapted to project limitations, client wishes, and the opinions of other team members in the IDP.
21. MScArchitecturalEngineering-IntegratedEnergyDesignEduardNuñezGarcia,JohannesMayer
21
References
Petersen, S., 2015. Integrated design of new low energy office buildings, s.l.: s.n.
Strunge, S. P. J. B. K. L. J., 2014. Method for integrating simulation-based support in the building design process, s.l.: DTU.
EN 15251 Indoor environmental input parameters for design and assessment of energy performance of buildings addressing indoor air quality, thermal environment, lighting and
acoustics.
EN 1729-1 Furniture - Chairs and tables for educational institutions.
Danish Building Research Institute – Cost-optimal levels of minimum energy performance requirements in the Danish Building Regulations, SBI 2013:25.
Petersen, S., 2011. Simulation-based support for integrated design of new low-energy office buildings, s.l.: DTU.
Hviid, C. A., 2010. Building integrated passive ventilation systems, s.l.: DTU.
Center, J. R., 2015. Photovoltaic Geographical Information System. [Online] Available at: http://re.jrc.ec.europa.eu/pvgis/apps4/pvest.php[Accessed 13 3 2015].
SolarWorld, 2015. Solar world - real world. [Online] Available at: http://www.solarworld-usa.com/ [Accessed 12 3 2015].
EXHAUSTO, 2015. EXHAUSTO. [Online] Available at: http://www.exhausto.com/ [Accessed 10 3 2015].