SlideShare ist ein Scribd-Unternehmen logo
1 von 105
0
Agenda
Time Topic
55 min Introductions and Setting the stage
What we heard from you, and how it shaped our goals and agenda
Why resource strategy matters
40 min System 2020
How we think about resource use and school system transformation
30 min Lunch
15 min Connecting to Oakland: Informing Equity
45 min Strategic Systems in Action
Denver, CO and Lawrence, MA Case Studies
20 min School Support
The role district leaders play in ensuring schools are set up for success
15 min Break
90 min Investing in Innovation and Evaluating Strategies
Impact modeling and Budget Hold ’Em for Districts: Making real-life tradeoffs to
drive success at the system level
20 min Closing Debrief
© Education Resource Strategies, Inc., 2013
District Resource Strategy
SSLF  February 14, 2018
Resources for SSLF available on the ERS website!
https://www.erstrategies.org/tap/school_systems_leaders_
fellowship_resources
2
Wednesday, February 14, 2018
The following CONTENT will be made available for
THIS AUDIENCE
following today’s session
Education Resource Strategies is a non-profit that
partners with system and school leaders to transform
how they use resources—people, time, and money
so that regardless of race, income, or ability,
every child is ready for tomorrow.
Our Mission
Who we are: ERS partners with districts across the country to transform
resource use so that every school succeeds for every student.
WEST COAST
California
Sacramento,
Oakland,
Los Angeles
Colorado
Denver
SOUTHWEST 15
Arizona
Arizona Community
Foundation
New Mexico
Santa Fe, Albuquerque
Oklahoma
Tulsa
Texas
El Paso, Austin, Aldine,
Spring Branch
MIDWEST
Minnesota
St. Paul
Illinois
Chicago
Indiana
Indianapolis
Ohio
Cleveland, Cincinnati
Michigan
Michigan State University
SOUTH
Tennessee
Memphis, Nashville, Knox County,
TN Dept. of Education
Georgia
Atlanta, GA Dept. of Education
Florida
Duval County, Lake County,
Palm Beach County
North Carolina
Charlotte-Mecklenburg
Louisiana
Avoyelles Parish, LA Dept. of Education
NORTHEAST
Massachusetts
Boston, Cambridge,
Holyoke
Rhode Island
Providence
Connecticut
Hartford, Waterbury,
New Haven, Connecticut
Council for Education
Reform
New York
Buffalo, Rochester,
Syracuse, New York
City, NY State Dept. of
Education
Pennsylvania
Philadelphia
New Jersey
Newark
Maryland
Baltimore,
Prince George’s County
Washington, D.C.
D.C. Public Schools
Current State Work
Past State Work
Current District Work
Past District Work
Wait, so does this mean…??
6
Brief introductions
7
Joe
Joy
But first… here’s what we heard from you
8
Funding and budgeting best practice
What are the key decisions
successful states make behind how
funding is determined for districts?
What are effective approaches to
building school-based and district-
level budget models?
How do you make difficult
funding choices during times
when there are resource
constraints?
But first… here’s what we heard from you
9
Interest in strategic school design and effective school support
How do you effectively align
resources to schools with the
most need – and support
them?
How do you structure professional
development that is both district wide
and school based?
What is the connection between
leadership and teaching?
How do we align the right types
of central office supports to
empower schools leaders?
But first… here’s what we heard from you
10
Prioritization and decision-making
What do we do when the data doesn't
provide us with information necessary to
make smart funding decisions (i.e. 99%
of teachers rated effective or highly
effective)?
What do you do if the areas that
need the most improvement are
outside of your wheelhouse?
How do I help districts use their data
to evaluate their needs and then
strategically target their resources?
Where do you start, as superintendent or c-
level, if the vast majority of the resource check
was "sometimes"? Which resources are MOST
important for district transformation?
How do you effectively share
this information with senior
leaders to spark conversation
and action, not controversy?
11
How you see yourselves: Resource Check
12
1
2
4
6
7
4
2
3
1
The district empowers each school leader to organize resources
to support his or her chosen instructional model and student and
staff needs.
Portfolio: The district actively plans school sizes and
configurations, balancing student needs for effective programs
with available staff, facility, and funding resources.
Strongly Disagree Disagree Agree Strongly Agree Don't know
5
3
1
6
8
5
6
4
4
3
5
4
4
1
4
4
4
1
3
The district has a deliberate turnaround strategy for…
The district's central office promotes a supportive culture for
schools and differentiates support and resources based on the…
The district sets clear and meaningful targets for academic
performance growth for all schools.
The district integrates student, teacher, and resource data and…
The district actively manages central costs and service quality.
Never/ Strongly Disagree Sometimes/ Disagree Frequently/ Agree Always/ Strongly Agree Don't know
School
Design
School
Support
With that in mind, our goals for today are:
1. Establish a common set of principles about strategic resource
use that apply to all types of school systems
2. Identify ways that innovative schools are organizing people,
time and money most strategically
3. Assess the role district leaders play in supporting and
enabling school-level strategic resource use
4. Simulate the process of identifying and making real-life
resource tradeoffs at the system level
13
Norms
Ask questions throughout the day*
Draw on each other’s experiences
Maintain a healthy respect for the clock
* no, there are no dumb ones
14
15
Agenda
Time Topic
55 min Introductions and Setting the stage
What we heard from you, and how it shaped our goals and agenda
Why resource strategy matters
40 min System 2020
How we think about resource use and school system transformation
30 min Lunch
15 min Connecting to Oakland: Informing Equity
45 min Strategic Systems in Action
Denver, CO and Lawrence, MA Case Studies
20 min School Support
The role district leaders play in ensuring schools are set up for success
15 min Break
90 min Investing in Innovation and Evaluating Strategies
Impact modeling and Budget Hold ’Em for Districts: Making real-life tradeoffs to
drive success at the system level
20 min Closing Debrief
What is the current state of
education funding?
Setting the stage:
Until the great recession hit, real spending on education
had increased nearly every year since 1920
17
$0
$2,000
$4,000
$6,000
$8,000
$10,000
$12,000
$14,000
National Public K-12 Expenditures Per Pupil (1920-2014) ($M)
Current expenditures Per Pupil (Real) Current expenditures Per Pupil (Nominal)*
Source: National Center for Education Statistics: Digest of Education Statistics.
*Nominal expenditures expressed in constant 2016 dollars.
Spending varies widely across districts...
18Source: ERS database
$7,800 $8,300
$9,200
$10,200 $10,800
$13,000
$14,100 $14,400
$16,800
$21,100
Aldine,
TX
Charlotte Knox
County,
TN
Fulton
County,
GA
Denver Prince
George's
County,
MD
Baltimore Cleveland D.C. Newark
Per-Pupil Spending on Education
~3x
Systemic Budget Gaps
cost structure rises regardless of revenue
19
• Longevity based teaching salaries
grow at ~2-4% annually
• Benefits growing at ~10+%
annually
• SPED spending continues to grow
• Pre-set COLA increases
• Tax revenue falling
• Enrollment declining
• Drop in Federal Funds
What do districts spend their money on?
School Spending Quiz:
Central administration
consumes a significant portion
of district funding
True or False?
False: Most urban districts spend less on
central overhead than commonly perceived
22
District Governance, Management of the support
services provide to Schools
Example: Superintendent, Board, Strategy, Dir. of
Math, Dir. of Transportation
Leadership &
Management
“Central
Overhead”
All FTEs, services, and materials allocated
directly to schools in the district expenditures
Example: SBB Allocations, Non-SBB Resources
All FTEs, services, and materials not reported on
the school budget, but support schools on a
regular and predictable basis
Example: Athletics, Prep Kitchens, PSNs
School-
attributed
All FTEs, services, and materials that provide
support to schools in ways that leverage scale
across schools
Example: Transportation, Maintenance
Shared
Services
“School-
Attributed”
This is what ERS uses to
compare spending across
schools.
District X
7%
13%
8%
72%
School Spending Quiz:
Instruction is the primary
business and consumes what
% of the budget?
1. 50-60%
2. 60-70%
3. 75%+
Typically 50-60% of most districts’ budgets is spent
on instruction in schools
24
56% 56% 58% 53% 55% 58% 59%
52% 57%
6% 5%
6%
6% 6%
6% 5%
6%
6%
20% 19%
20%
23% 21%
20% 18%
22% 16%
7% 9% 5% 6% 6% 6% 8% 8% 8%
8% 7% 8% 8% 8% 7% 7% 8% 8%
4% 5% 3% 4% 4% 3% 3% 4% 5%
District
Average
Palm Beach Duval CoutyLake County Aldine Charlotte Fulton PGC Denver
Breakdown of Total Operating Spending: % by Use
Business
Services
Leadership
Pupil Services
& Enrichment
O&M
ISPD
Instruction
Source: SDPBC FY15 Expenditures, ERS analysis, ERS Benchmark Database
Adj. $pp $9.4 $9.8 $8.5 $7.4 $7.9 $9.7 $10.4 $11.6
Year 2014-2015 2009-2010 2011-2012 2012-2013 2013-2014 2010-2011 2012-2013 2009-2010
PreK-12
Enrollment
166 (K) 121 (K) 36 (K) 66 (K) 137 (K) 88 (K) 126 (K) 77 (K)
School Spending Quiz:
School level spending goes mostly
to people and consumes what % of
the budget?
1) 60-70%
2) 70-80%
3) 80-90%
80-90% of a schools budget is typically spent on staff;
therefore, strategic budget reform must look first and foremost
at people or “Who does What?”
26
65%
5%
2%
5%
8%
1%
2%
9%
School X
Teachers
Instructional Aides
Student support
Administration
Clerks & Other Staff
Substitutes
Supplies & Contracted
Services
Utilities & Maintenance
Linking dollars to student performance:
A one-word research history and the word is “no.”
27
A generation of research: Do resources/inputs matter?
 Hanushek summarizes the existing literature to say
“no.”
 Dollars per pupil are NOT systematically related to
student outcomes
 Very consistent finding over time
 Consistently cited as reason to oppose spending
increases
Common resource
misalignments
Setting the stage:
Many districts and schools still invest in practices with
little impact on student outcomes
29
Restructuring Resources for High Performing Schools .(2011). Watertown, MA: Education Resource Strategies
Up to $0.40 of every $1 spent is not
correlated with student outcomes
Teacher comp.
not aligned
with student
learning
Whole day
class size
reductions in
all subjects
Students
in overly
restrictive
settings
Time not
varied for
student
proficien
cy
5-15¢ 10-15¢ 3-5¢ 3-5¢
“Resource
Misalignments”
Four types of Resource Misalignments
Underinvestment in the
right things
Non-strategic over-
investment in “good
things”
Piecemeal investment in
an integrated solution
Opportunities for
Reallocation
Opportunities for
Strategic Investment
Resources tied up in
the wrong things
Example: Investing more time for struggling
students
24% 25% 24%
29%
21%
19% 20%
16%
19%
21%
17%
15% 15% 14%
16%
Fulton Hall Treutlen Vidalia Marietta
% Time in 9th Grade Math, by Prior Year
Proficiency
Did not meet standards Proficient Advanced
Source: ERS
Piecemeal
investment in
an integrated
solution
24%
14%
Math Support Teachers All Math Teachers
% of All Teachers that are Novice
Most GA districts gave additional time to struggling
students….
However, these classes were
disproportionately staffed by novice teachers
Reflection (3 minutes)
32
Turn to your neighbor:
What resource misalignments have you seen
in your district, CMO, or across your state?
Why do you think they persist?
The status quo persists because re-aligning
resources is hard
 Pure operating efficiencies are small and miss
the point
 Quick timelines inhibit significant changes
 Complex reallocations are multi-year, some
with up-front investment
 Hard to mobilize around the “from” without a clear vision for the “to”
 Can require eliminating policy barriers and/or changing peoples’ jobs
 Realigning resources may not be what the public or board wants
Re-aligning resources is necessary
 Dramatic, stubborn achievement gaps
 Perennially limited resources
 Higher standards / Common Core
 Demand for information-age learning
 Increasing competition for students between traditional
and charter schools
 Our pursuit of equity and social justice require us to act
Guiding questions – from up on the balcony
1. What is my district’s/CMO’s overall resource picture
with regard to strategic vs. non-strategic use?
2. What process does my district/CMO use for making
resource decisions? How can I influence that
process?
3. What aspects of resource use do I control? How can I
have the most impact with the control I have?
4. What will I do when I get back to work?
Districts and CMOs
Guiding questions – from up on the balcony
1. What state policies or practices are intended to
support districts’ strategic resource use? How well do
they currently accomplish that aim?
2. What tools/supports/data does my state offer districts
to support their resource decision-making?
3. How can I influence policies/tools/etc. within and
support their effective use? How can I have the most
impact with the influence I have?
4. What will I do when I get back to work?
States
37
Agenda
Time Topic
55 min Introductions and Setting the stage
What we heard from you, and how it shaped our goals and agenda
Why resource strategy matters
40 min System 2020
How we think about resource use and school system transformation
30 min Lunch
15 min Connecting to Oakland: Informing Equity
45 min Strategic Systems in Action
Denver, CO and Lawrence, MA Case Studies
20 min School Support
The role district leaders play in ensuring schools are set up for success
15 min Break
90 min Investing in Innovation and Evaluating Strategies
Impact modeling and Budget Hold ’Em for Districts: Making real-life tradeoffs to
drive success at the system level
20 min Closing Debrief
 Inspiring innovation: Transform Now video
38
Transform Now
The School System 20/20 framework
Transforming outcomes for all students
requires tackling outmoded structures
40
System 20/20 Domain From To
Standards &
Instructional
Resources
Inconsistent or inadequate standards with
little support for teachers.
Rigorous, information-age standards
supported by effective curricula and
assessments.
Teaching
Isolated teachers with limited support,
flexibility, opportunities for growth.
A new way we hire, assign, support, team,
pay, and promote teachers.
School Design
A one-size-fits-all learning environment
that holds everyone back.
A re-imagined school day with new
schedules, dynamic groupings and
targeted instruction.
Leadership
Limited autonomy, flexibility & support to
develop and reward strong leaders.
Clear standards, support, and account-
ability for principals and district leaders.
School Support
& Accountability
Central office staff responsibilities that
focus on compliance and oversight.
The central office is a service and
strategy partner in sharing best practices
and ensuring all schools reach learning
goals.
Funding &
Portfolio
Wide funding variances across schools.
Systems that allocate resources equitably
and flexibly across schools.
Community
Engagement
Schools providing a wide range of
services in addition to their core
educational mission.
Partnering to create innovative and cost-
effective ways to serve students better.
1. Revise funding formulas to achieve greater equity,
transparency and flexibility
2. Implement strategic school designs that personalize
learning for students based on need
3. Restructure investments in PD and teacher time to create
“connected professional learning” for teachers and
leaders
41
Three high-priority levers for transformation:
Elements of a healthy school funding system
Flexibility
School leaders
define the
resources they
need to drive
student
achievement
Equity
Resources are
distributed
equitably based on
student need
Transparency
Clear and easily
understood rules
for where, how, and
why dollars flow
$0
$2,000
$4,000
$6,000
$8,000
$10,000
$12,000
$14,000
$16,000
60
15
39
367
346
51
61
99
34
114
82
105
79
42
14
90
49
54
88
107
31
103
327
109
69
48
384
93
94
315
83
359
19
63
106
391
356
44
55
87
96
57
74
302
58
16
43
70
65
621
716
618
501
614
723
626
617
708
School Attributed $ per Weighted Pupil ($pwp)
Magnet Traditional
43
After adjusting for student need, District X still has a
significant amount of variation in its student funding
Source: ERS analysis
Median: $7.3K
Hi-Lo Spread: 1.9x
Median: $8.9K
Hi-Lo Spread:
2.3x
ES/K-8
HS
The extent to which spending levels vary based
on need varies across systems
44
R² = 0.767
$0
$2,000
$4,000
$6,000
$8,000
$10,000
$12,000
$14,000
1.00 1.10 1.20 1.30 1.40
R² = 0.2562
$0
$2,000
$4,000
$6,000
$8,000
$10,000
1.00 1.10 1.20 1.30 1.40 1.50 1.60
R² = 0.499
$0
$2,000
$4,000
$6,000
$8,000
$10,000
$12,000
$14,000
1.00 1.10 1.20 1.30 1.40 1.50
R² = 0.1437
$0
$2,000
$4,000
$6,000
$8,000
$10,000
$12,000
1.00 1.10 1.20 1.30 1.40
45
Districts should determine if variation is intentional and
strategic and then adjust accordingly to improve equity
District Strategy
School opening/closure
$
School Level
$
School Type
$
Student Need
Special
Education
$$$
English Language
Learners
$$
Economic
Disadvantage
$$
Other Student Needs
$
Unplanned
Enrollment/
School Size
$$$
Teacher Compensation
$
Building Utilization
$
Enrollment Projections
$
Ad-hoc exceptions
$
1. Revise funding formulas to achieve greater equity,
transparency and flexibility
2. Implement strategic school designs that personalize
learning for students based on need
3. Restructure investments in PD and teacher time to create
“connected professional learning” for teachers and
leaders
46
Three high-priority levers for transformation:
47
Most schools organize people, time, and money the
same way they did 50+ years ago
One teacher
per class
20-30 students
per class
Studying a
particular subject
For a set period of time
(e.g., 50 min/day)
For a set duration
(e.g., full year)
48
ERS’ Strategic School Design Essentials
Expert-led
Collaborative Work and
Professional Learning
Organize teachers into expert-led teams
focused on the design and delivery of
instruction, and provide ongoing growth-
oriented feedback
Talent Management and
Teacher Leadership
Attract and retain the best teachers,
and assign roles and responsibilities
to match skills to school and student
need
Empowering
Curricula, Instruction,
and Assessment
Uphold rigorous, college-and-
career-ready standards and use
effective curricula, instructional
strategies, and assessments
to achieve them
Personalized Time
and Attention
Match student grouping, learning
time, technology and program to
individual student needs
Responsive
Learning Community
Ensure students are deeply known
and more intensive social and
emotional supports are integrated
when necessary
Growth-oriented
Adult Culture
Grow a collaborative culture
where teachers and leaders share
ownership of a common instructional
vision and student learning
Most districts have opportunities to
strategically raise class size…
49
Source: Elementary Grades Homeroom file Oct 2009; Includes elementary schools and K-8 schools (grades K0-5); excludes classes that are special
education 60%+, ELL 60%+; includes Advanced Work classes; excludes schools with Two-Way bilingual program; excludes classes with “mixed” grade
(mainly due to teacher data NA); ERS analysis
21
22 22 2222
25
28
31
Grades K-2 Grades 3-5 Grades 6-8 Grades 9-12
In this District Class Sizes are Far from Maximum
and Do Not Vary by Grade
Average class size Contract max
…and to target class sizes to priority subjects
and students
*Core class defined as ELA, Math, Science, Social Studies; Non-core defined as Arts, Computer Literacy, Vocational, Foreign Language
Source: District A and B 9th and 12th grade course data (internal – Resource Mapping presentation); ERS analysis
In these districts class sizes for core subjects are higher than non-core
27
21
18 18
District T District L
Average Class Size by Course Type
9th Grade Core Class Size* 12th Grade Non-Core Class Size
50
Most schools have the opportunity to
optimize time by subject…
51Source: ERS analysis
0%
10%
20%
30%
40%
50%
60%
70%
80%
90%
100%
ES 7-9 10-12
PE
Electives
Foreign Language
Science
Social Studies
Math
ELA
Typical District Percent of Student Time
By Grade and Subject
….And by student need
52
Note: % Time is based on the instructional time throughout the school day. It only includes periods entered in PowerSchool and does not include passing time, lunch, recess or
maintenance/homeroom classes.
Source: ERS Analysis, CMS SY2013-2014 Course Schedule PowerSchool Data, CMS SY2012-2013 EOG Performance Data
22% 22%
22% 22%
16% 14%
16% 14%
2% 5%
Below Basic Proficient
%ofInstructionalTime
Prior Year ELA EOG
Avg. % of Time by Core Subject for Below Basic and Proficient Middle
School Students
Foreign Lang.
Social Studies
Science
ELA
Math
Many districts have an opportunity to increase
instructional time by increasing the school day
53
Sources: District figures are from Time and Attention in Urban High Schools: Lessons for School Systems (Frank, 2010) and from ERS analyses for the
Aspen CFO network. Leading Edge school figures are from Shields, R. A., and K. H. Miles. 2008. Strategic Designs: Lessons from Leading Edge Small
Urban High Schools. Watertown, MA: Education Resource Strategies. Charter school figures are from The Boston Foundation report (May 2010) “Out of
the Debate and Into the Schools.” ERS analysis.
963
1080
1110
1120
1125
1138
1160
1170
1180
1200
1210
1250
1250
1260
1276
1476
Chicago
PG County
LA
Boston
Seattle
St Paul
Milwaukee
Washington DC
Rochester
Denver
Baltimore
Pittsburgh
Philadelphia
Atlanta
Leading Edge schools
Boston Charters
Student Hours Per Year
National Avg. = 1170
To target individual attention to students, in
the short term, you can...
54
To Support Sustainable Transformation
Invest transition
resources to
 Provide expert PD to increase teacher capacity to use individual
attention strategies
 Create and use formative assessments and tools to enable targeted
instruction and grouping
Lay the
groundwork for
long-term
change by…
 Build understanding of impact of targeted group sizes & teaching
effectiveness in strategic designs
To Reverse Misalignments
Reduce
spending by…
 Increasing general class size targets
 Increasing class size for specific low need students, grade levels, and
subjects
 Leveraging technology for high cost courses and selected lessons
Increase
spending to …
 Reduce group size for high need students, skills, grade levels and
subjects
How does Revere High’s ninth grade academy
reflect the Strategic School Design Essentials?
Introduction: Revere High School has prioritized the 9th grade student
experience though a 9th grade academy. The academy is designed to
provide additional support and time to students as they face more rigorous
content through flipped learning and flexible groupings.
As you watch, consider:
 Which design essentials are most evident in Revere’s ninth grade
strategy?
 How do the design essentials identified relate to the larger System 20/20
Framework?
 In what specific ways can we draw a connection between the conditions
we as system leaders we create and the empowerment of school
leaders to support students in creative ways?
55
 Revere 9th grade Academy: Video
56
How does Revere High provide personalized
learning to students?
Foundational concepts
1. There are consistent guiding principles for strategic
resource use, regardless of the specific priorities and
sequence of action a single district pursues
2. In successful systems, strategy and resource
allocation decisions connect to actual improvement
in outcomes, however they can
3. Strategic resource decisions have implications at all
levels – for schools, for how you think about
supporting schools, and for each district function
57
58
Lunch time! 30 min
59
Agenda
Time Topic
55 min Introductions and Setting the stage
What we heard from you, and how it shaped our goals and agenda
Why resource strategy matters
40 min System 2020
How we think about resource use and school system transformation
30 min Lunch
15 min Connecting to Oakland: Informing Equity
45 min Strategic Systems in Action
Denver, CO and Lawrence, MA Case Studies
20 min School Support
The role district leaders play in ensuring schools are set up for success
15 min Break
90 min Investing in Innovation and Evaluating Strategies
Impact modeling and Budget Hold ’Em for Districts: Making real-life tradeoffs to
drive success at the system level
20 min Closing Debrief
 Informing Equity: A study of resource allocation across
Oakland’s charter and traditional district schools
 Discussion questions:
1. What were the most striking resource misalignments both
between systems of schools and within each system?
2. To what extent do the findings here resonate with your
experience in your home cities/states?
3. What do you see as the key opportunities to begin moving
toward a more equitable system of schools across
Oakland?
60
Connecting to Oakland: Informing Equity
61
Agenda
Time Topic
55 min Introductions and Setting the stage
What we heard from you, and how it shaped our goals and agenda
Why resource strategy matters
40 min System 2020
How we think about resource use and school system transformation
30 min Lunch
15 min Connecting to Oakland: Informing Equity
45 min Strategic Systems in Action
Denver, CO and Lawrence, MA Case Studies
20 min School Support
The role district leaders play in ensuring schools are set up for success
15 min Break
90 min Investing in Innovation and Evaluating Strategies
Impact modeling and Budget Hold ’Em for Districts: Making real-life tradeoffs to
drive success at the system level
20 min Closing Debrief
Strategic Systems:
Examples of Transformation In Action
62
Denver, CO
Lawrence, MA
Denver timeline
63
Standards
Teaching
School Design
Leadership
School Support
Funding
Partners
2008-11
Enabling Conditions
2012-14
Empowering
Schools
2015-16+
Continued Growth
Denver: Summary of actions
64
Denver: Summary of actions
65
Denver: Summary of results
66
Proficiency 2004 2014 ∆
ELA proficiency 24% 47% +23 pts
Math proficiency 45% 54% +9 pts
Graduation Rate 2010 2016 ∆
HS graduation 54% 67.2% +13.2 pts
Lawrence timeline
67
Standards
Teaching
School Design
Leadership
School Support
Funding
Partners
Spring 2012
Actions with immediate
impact
2012-13
Targeted supports
Enabling cond’ns
2013-14+
Empowering
schools
Lawrence: Summary of actions
68
Lawrence: Summary of results
69
Success metric 2011 2014 Change
Math proficiency 28% 41% +13 pts
ELA proficiency 41% 44% +3 pts
SGP: Math 39% 57% +18 pts
SGP: ELA 45% 52% +7 pts
HS graduation 52% 61%
(2013)
+9 pts
Exceed state average
Digging into the Denver and Lawrence cases
Take 10 minutes to review how one district has approached
its transformation.
Then, share what you learned with a colleague (5 min each),
addressing the following questions:
1. In your view, what was the most important decision/s the
district made? Why?
2. What did you like most about the choices the district
made? What did you like least?
3. What feedback would you give Tom or Jeff based on
what you have observed?
70
Applying lessons in your context
Reflect individually and consider:
1. What would you tell your superintendent/state leadership
about the Denver and Lawrence case examples?
2. District/CMO: What do these cases imply about the
trajectory your district/ CMO is on – both what makes
sense and what the district’s/CMO’s leadership team
might want to re-consider?
3. State: What do these cases imply about your support of
districts – both those in turnaround and those working to
make incremental, strategic change?
71
72
Agenda
Time Topic
55 min Introductions and Setting the stage
What we heard from you, and how it shaped our goals and agenda
Why resource strategy matters
40 min System 2020
How we think about resource use and school system transformation
30 min Lunch
15 min Connecting to Oakland: Informing Equity
45 min Strategic Systems in Action
Denver, CO and Lawrence, MA Case Studies
20 min School Support
The role district leaders play in ensuring schools are set up for success
15 min Break
90 min Investing in Innovation and Evaluating Strategies
Impact modeling and Budget Hold ’Em for Districts: Making real-life tradeoffs to
drive success at the system level
20 min Closing Debrief
In one word, how would you describe the
relationship between school leaders and
the central office in your district?
Principals in most districts do not rate central office
support highly
75
12% 14% 19% 24% 21%
9%
18%
17%
29% 31%26%
34% 31%
29% 28%
30%
25% 17%
13% 14%24%
9% 16%
5% 5%
Staff evaluation Budget Hiring Curriculum and
Instruction
Professional
Development
Q: On a scale of 1 to 5, with 1 being “Very Poor” and 5 being
“Excellent,” how would you describe the quality of support you receive
from your district’s central office in the following areas?
5
4
3
2
1
Average 3.5 3.0 2.9 2.5 2.5
Source: ERS Survey of Principals, 2014
Principals seek more flexibility in many areas
76
Don’t have and don’t want (8)
• Set base compensation and benefits
• Contract with food service vendors
• Contract with transportation partners
Don’t have but want (26)
• Hire non-instructional staff
• Determine how many gen ed teachers are
placed at the school
• Eliminate a position based on school needs
• Exit staff based on philosophy, commitment
or team contribution
• Hire/allocate social/emotional positions
• Set student assessment schedule
• Choose student assessment instruments
Have and want to keep (6)
• Screen general education
teachers for fit and
qualification
• Assign teachers to
leadership positions
• Final say on which teachers
to hire
Have but don’t want (0)
Bulleted items are a sub-set of flexibilities in the category. Have/want based on at least 50% of principals surveyed answering that they have and/or want the autonomy
Source: Principal survey, ERS analysis
Of 40 flexibilities tested in the context of improving student learning,
at least half of school leaders say they…
Empowering principals with high-leverage flexibility
77
Don’t have but want (26)
• Hire non-instructional staff
• Determine how many gen ed teachers are
placed at the school
• Eliminate a position based on school
needs
• Exit staff based on philosophy,
commitment or team contribution
• Hire/allocate social/emotional positions
• Set student assessment schedule
• Choose student assessment instruments
Bulleted items are a sub-set of flexibilities in the category. Have/want based on at least 50% of principals surveyed answering that they have and/or want the autonomy
Source: Principal survey, ERS analysis
 Why do principals want
these flexibilities?
 What can we do to
empower principals in
these areas?
 If we can’t provide these
flexibilities, what’s the
root cause? What’s the
workaround?
Why focus on improving the quality of school
support?
 Perceptions of central office support correlate
with principals’ likelihood to stay in the system
 Especially in systems where rules around
flexibility vary, district leaders must ensure that
each school is making the most of the
resources they have
 Mistrust between school and district leaders
distracts from everyone’s ability to do what’s
best for our students
78
Retention
Equity
Impact
Without a strong central office partnership, schools
are unable to realize their full potential
79
Data/ Reports Process
Policies/
Accountabilities
Tools
Expertise/
Illustrations
StrategicFunctional
The right
information
Clear and
understood
Limited to
requirements
User-
friendly
Compliance-
focused
Benchmark
against best
practices
Design &
needs driven
Aligned with
school
accountability
system
Push
thinking
School design
focused
How strategic district leaders can better support principals
Note that Functional and Strategic are distinct dimensions - it is entirely possible that you are neither, both, some of each, etc.
Self-Assessment: How can district leaders best
support principals?
Consider the functional area you have direct responsibility for or the
district’s/ CMO’s support to principals overall (up to you on where you want
to focus) - State Fellows, think of a district in your states or your support of
districts overall:
1. What is one of your bright spots? What examples can you cite within
the framework of effective functional and/or strategic support to
school leaders?
2. What is one of your biggest gaps? What current structures, teams,
processes are furthest from being strategic?
3. What is one barrier to improvement? What is preventing/will prevent
improvement in the area(s) you cite as having the biggest gaps?
4. What is one opportunity for improvement? What can you or your
system/CMO/state readily do that will enable more strategic support
to school leaders?
80
81
Break time! 15 min
82
Agenda
Time Topic
55 min Introductions and Setting the stage
What we heard from you, and how it shaped our goals and agenda
Why resource strategy matters
40 min System 2020
How we think about resource use and school system transformation
30 min Lunch
15 min Connecting to Oakland: Informing Equity
45 min Strategic Systems in Action
Denver, CO and Lawrence, MA Case Studies
20 min School Support
The role district leaders play in ensuring schools are set up for success
15 min Break
90 min Investing in Innovation and Evaluating Strategies
Impact modeling and Budget Hold ’Em for Districts: Making real-life tradeoffs to
drive success at the system level
20 min Closing Debrief
83
Impact modeling?
Impact modeling is an ERS R&D initiative that helps connect
actions to student outcome goals districts are setting
 Help make the case to district leaders for actions
that will have the most impact on students by
 Illustrating the relative impact and cost of different actions
 Drawing attention to the magnitude of effort needed to
accomplish goals
 Translating research for practitioners and district context
 Help District leaders build stronger plans to achieve
their goals that take a holistic approach to
improvement
84
Broadly, how we are thinking about this…
 What change is the district trying to accomplish?
 What are goals around student outcomes?
 What improvement is necessary to meet those goals?
 How does this compare to what other districts have
accomplished?
 To what extent are district initiatives likely to contribute to
meeting its goals?
 Detailed: Impact Model, a customized tool that models out
the potential impact of different actions
 High level: Budget Hold’em, an interactive exercise that
helps district leaders and stakeholders explore tradeoffs in
building budgets to help all students succeed
85
How is this work different from currently available
research/modeling?
86
Other Research/Modeling Our Modeling
 Targeted at academics and
practitioners with a deep
understanding of research methods
 Targeted at practitioners and
policymakers regardless of
understanding of research methods
 One action/intervention in isolation  Combinations of actions
 Requires translation to context  Uses district specific data to estimate
in their context (e.g. student mobility,
effectiveness of new hires)
 Scenarios that aren’t always realistic
or scalable (e.g. The average student
impact of permanently removing
teachers below a 5th or 10th percentile
cutoff from the current workforce and
the hiring pool Hanushek, 2009)
 Scenarios customized to represent
scenarios more likely to occur (e.g.
increase attrition among bottom 10
percentile of teachers)
We estimate district-wide impact by “spreading out”
student-level effects observed in research
87
Improvement
initiative
Per student effect
size (SD*)
% of all Students
Impacted
Districtwide Impact
(SD)
Workforce
Management
0.30 6% 0.02
Tutoring 0.21 7% 0.01
How does this translate to
strategies implemented
across the district?
District-Wide impact depends on
the # of students affected, as
well as the effect size.
Where do we get effect sizes?
Peer-reviewed research
Experimental/Quasi-experimental
Meta-analysis where available otherwise
individual studies
*SD: Standard Deviation
Our methodology allows us to estimate the impact of
interventions targeted to different groups of students, such as
by school and performance level
0.21 0.16
- - -
0.14
0.11
0.07 0.05 0.02
0.12
0.11
0.07
0.05
0.03
0.09
0.05
0.02
0.00
0.00
-
0.10
0.20
0.30
0.40
0.50
0.60
0.70
0.80
Lvl 1 Lvl 2 Lvl 3 Lvl 4 Lvl 5
StudentPerformanceImprovement(SD)
Student Performance Level
Small Group Tutoring Reduce Class size to 15
Extend School Day by 60 min Add Pre-K
88
Strategy
Cost
($M)
Implement small group
tutoring of 8:1 for Lvl 1 and 2
students in C,D and F schools
$2.5
Reduce 3rd grade class size
from 18 to 15 in C, D, F
schools
$5.0
Extend school day by 60
minutes to additional C,D,F
schools
$2.0
Add 20% Pre-K seats,
focusing on FRL and ELL kids $7.9
Sub-total Stu.
Perf Improv.
0.56 0.43 0.17 0.10 0.05
Source: ERS analysis.
The result is typically aggregated measures of
student performance and teacher effectiveness
89
-1.6
-1.4
-1.2
-1.0
-0.8
-0.6
-0.4
-0.2
0.0
Year
0
Year
1
Year
2
Year
3
Year
4
Year
5
Year
6
Year
7
Year
8
Year
9
Year
10
DistancefromMathProficiency(SD)
Proficiency Gains for Lowest-Performing
Students
Baseline Intervention
56% 59%
0%
10%
20%
30%
40%
50%
60%
70%
80%
90%
100%
Year
0
Year
1
Year
2
Year
3
Year
4
Year
5
Year
6
Year
7
Year
8
Year
9
Year
10
District-wide Change in Math Proficiency
Rates over Time
Intervention Baseline
Where we are in this work…
 Proof of concept model using Python: models out
changes in, e.g., teacher retention/attrition and small-
group instruction (Complete)
 Adding 1-2 additional interventions over the next
several months (Not started)
 Sensitivity analysis: How does the quality of the
teacher pipeline impact the efficacy of strategic
retention/attrition? (In Progress)
 Learning from others who have related expertise, or
are working on similar problems (In Progress)
90
Therefore, for the foreseeable future, system leaders
should…
1. Ensure “Impact/Return on Investment” mindset for
decision-makers:
 Clear on the “logic model” and expected impact of
investments, including synergy among initiatives
 Focused on maximizing returns across functions v. within
 Committed to monitoring results and adapting based on data
2. Ensure budget development processes span
departmental boundaries and include structural
costs/strategies
3. Invest in data collection and analysis opportunistically
to inform discussion of strategic options
91
Goal of this exercise:
Help District X use its limited resources strategically to improve
student achievement and meet our goals.
1. Identify the core needs
2. Consider broad range of investment and savings options
3. Weigh investment and savings options
4. Make coordinated, strategic investment and savings decisions
that drive student performance improvement
93
 Create a “hand” of impact and savings cards that represents
a new budget for District X
 Your hand must meet the district’s priorities (see handout)
 Your hand must achieve a cost neutral status and improve
student achievement
94
The Object of the Game
Add 60 min of learning time
to the school day in the 25%
lowest performing schools
Extended learning time can raise
student achievement if it is
targeted on core instruction with
high quality teachers who are
expert in critical subject and
instructional areas.
1.7%
Student impact
points
Investment (+) or
Savings (-) as % of
budget
Explanation
Note: Extending learning time
can be costly. Ensure that the
schools in which you invest have
leaders and teaching staff who
can deliver high quality
instruction to struggling
students.
Note
There are also wild cards
that let you add more
savings or investment
options.Turnaround schools
Some cards can have
stronger impact when
played together
Time+
What’s a Hold’em card?
Things to consider
 Select cards thoughtfully – consider your priorities
 Consider inter-relationships between cards and try to get
those bonus points
 Acknowledge approximation
 Be bold
 Consider different staffing allocations
 Use Wild Cards
 Have fun!
96
Let’s Play!
Directions:
98
Step 2
1 min
Choose someone to read the cards and
someone to record decisions online
Step 3
45 min
The card reader will read the cards aloud
(just the title and description), and your
group will collectively sort them into Yes
and No piles. Try to reach consensus,
but if you can’t, put it in a Maybe pile
Step 4
15 min
After your first pass, go back through your Maybe pile and make changes
in order to reach your target. Calculate your budget and student impact.
Step 5
2 min
Take stock: Consider the expected performance outcomes of your choices
– are you maximizing impact given resource limitations and district
priorities?
Step 1
5 min
Read the District X fact sheet individually. Note priorities and challenges.
Online Scoring Instructions
1. Go to:
erstrategies.org/scoresheet
2. Enter your team’s “Access
Token” (on your table)
3. Enter decisions as you go (it
will recalculate your budget
% each time)
Debrief on
Hold’em
Discussion questions
100
1. What were the biggest insights and/or surprises in
your choices?
2. Which options are off the table or challenging, but
promising, interesting, or important? What must
change to make them a real option?
3. How did this exercise influence your thinking on:
a. How to improve outcomes with limited resources?
b. The use of impact data for leadership decision-making?
101
Agenda
Time Topic
55 min Introductions and Setting the stage
What we heard from you, and how it shaped our goals and agenda
Why resource strategy matters
40 min System 2020
How we think about resource use and school system transformation
30 min Lunch
15 min Connecting to Oakland: Informing Equity
45 min Strategic Systems in Action
Denver, CO and Lawrence, MA Case Studies
20 min School Support
The role district leaders play in ensuring schools are set up for success
15 min Break
90 min Investing in Innovation and Evaluating Strategies
Impact modeling and Budget Hold ’Em for Districts: Making real-life tradeoffs to
drive success at the system level
20 min Closing Debrief
Guiding questions – from up on the balcony
1. What is my district’s/CMO’s overall resource picture
with regard to strategic vs. non-strategic use?
2. What process does my district/CMO use for making
resource decisions? How can I influence that
process?
3. What aspects of resource use do I control? How can I
have the most impact with the control I have?
4. What will I do when I get back to work?
Districts and CMOs
Guiding questions – from up on the balcony
1. What state policies or practices are intended to
support districts’ strategic resource use? How well do
they currently accomplish that aim?
2. What tools/supports/data does my state offer districts
to support their resource decision-making?
3. How can I influence the policies/tools/etc. within my
control and support their effective use? How can I
have the most impact with the control I have?
4. What will I do when I get back to work?
States
Resources for SSLF available on the ERS website!
https://www.erstrategies.org/tap/school_systems_leaders_
fellowship_resources
104
Wednesday, February 14, 2018

Weitere ähnliche Inhalte

Was ist angesagt?

20 outstanding schools did it in challenging circumstances !
20 outstanding schools did it in challenging circumstances !20 outstanding schools did it in challenging circumstances !
20 outstanding schools did it in challenging circumstances !Sahr O Fasuluku
 
One School's Journey to Outstanding | Whole Education Annual Conference 2013
One School's Journey to Outstanding | Whole Education Annual Conference 2013One School's Journey to Outstanding | Whole Education Annual Conference 2013
One School's Journey to Outstanding | Whole Education Annual Conference 2013Wholeeducation
 
The key school leaders at outstanding schools - fergal roche - room b - wor...
The key   school leaders at outstanding schools - fergal roche - room b - wor...The key   school leaders at outstanding schools - fergal roche - room b - wor...
The key school leaders at outstanding schools - fergal roche - room b - wor...Challenge Partners
 
School Leadership in Chicago_Baseline Report
School Leadership in Chicago_Baseline ReportSchool Leadership in Chicago_Baseline Report
School Leadership in Chicago_Baseline ReportLauren Rapp
 
2019 legislative presentation for sbe fall work session 10.31.2018
2019 legislative presentation for sbe fall work session 10.31.20182019 legislative presentation for sbe fall work session 10.31.2018
2019 legislative presentation for sbe fall work session 10.31.2018EducationNC
 
Thousand Smiles Project: Community Mobilization For School Accountability
Thousand Smiles Project: Community Mobilization For School AccountabilityThousand Smiles Project: Community Mobilization For School Accountability
Thousand Smiles Project: Community Mobilization For School AccountabilitySarthak Satapathy
 
Conclusion of the West London Zone Steering Group
Conclusion of the West London Zone Steering GroupConclusion of the West London Zone Steering Group
Conclusion of the West London Zone Steering Groupwestlondonzone
 
Bryant University - Resume writing
Bryant University - Resume writingBryant University - Resume writing
Bryant University - Resume writingAmy Weinstein
 
Belk Foundation 2018 Annual Report
Belk Foundation 2018 Annual ReportBelk Foundation 2018 Annual Report
Belk Foundation 2018 Annual ReportAnalisa Sorrells
 
Outstanding School Governance
Outstanding School GovernanceOutstanding School Governance
Outstanding School GovernanceJames Hargrave
 
Almeer Ahsan Asif_EDU 506_Individual Reflection Paper_TFB2014
Almeer Ahsan Asif_EDU 506_Individual Reflection Paper_TFB2014Almeer Ahsan Asif_EDU 506_Individual Reflection Paper_TFB2014
Almeer Ahsan Asif_EDU 506_Individual Reflection Paper_TFB2014Almeer Ahsan Asif
 
Fas 101 short deck 10 16-15
Fas 101 short deck 10 16-15Fas 101 short deck 10 16-15
Fas 101 short deck 10 16-15kevin_donovan
 
West London Zone: Operational plan
West London Zone: Operational planWest London Zone: Operational plan
West London Zone: Operational planwestlondonzone
 
Ofsted Annual Report 2018/19
Ofsted Annual Report 2018/19 Ofsted Annual Report 2018/19
Ofsted Annual Report 2018/19 Ofsted
 
President-Principal Model Presentation
President-Principal Model PresentationPresident-Principal Model Presentation
President-Principal Model PresentationXavier High School
 
Improvements in performance version 2
Improvements in performance version 2Improvements in performance version 2
Improvements in performance version 2Peter Billington
 
Jones_Paideia_Family_Engagement_Plan
Jones_Paideia_Family_Engagement_PlanJones_Paideia_Family_Engagement_Plan
Jones_Paideia_Family_Engagement_PlanMichael R. Adkins
 
survey2013-14web
survey2013-14websurvey2013-14web
survey2013-14weblaef_laef
 

Was ist angesagt? (20)

20 outstanding schools did it in challenging circumstances !
20 outstanding schools did it in challenging circumstances !20 outstanding schools did it in challenging circumstances !
20 outstanding schools did it in challenging circumstances !
 
One School's Journey to Outstanding | Whole Education Annual Conference 2013
One School's Journey to Outstanding | Whole Education Annual Conference 2013One School's Journey to Outstanding | Whole Education Annual Conference 2013
One School's Journey to Outstanding | Whole Education Annual Conference 2013
 
The key school leaders at outstanding schools - fergal roche - room b - wor...
The key   school leaders at outstanding schools - fergal roche - room b - wor...The key   school leaders at outstanding schools - fergal roche - room b - wor...
The key school leaders at outstanding schools - fergal roche - room b - wor...
 
Blue Engine Webinar
Blue Engine WebinarBlue Engine Webinar
Blue Engine Webinar
 
School Leadership in Chicago_Baseline Report
School Leadership in Chicago_Baseline ReportSchool Leadership in Chicago_Baseline Report
School Leadership in Chicago_Baseline Report
 
2019 legislative presentation for sbe fall work session 10.31.2018
2019 legislative presentation for sbe fall work session 10.31.20182019 legislative presentation for sbe fall work session 10.31.2018
2019 legislative presentation for sbe fall work session 10.31.2018
 
Thousand Smiles Project: Community Mobilization For School Accountability
Thousand Smiles Project: Community Mobilization For School AccountabilityThousand Smiles Project: Community Mobilization For School Accountability
Thousand Smiles Project: Community Mobilization For School Accountability
 
Conclusion of the West London Zone Steering Group
Conclusion of the West London Zone Steering GroupConclusion of the West London Zone Steering Group
Conclusion of the West London Zone Steering Group
 
Bryant University - Resume writing
Bryant University - Resume writingBryant University - Resume writing
Bryant University - Resume writing
 
Belk Foundation 2018 Annual Report
Belk Foundation 2018 Annual ReportBelk Foundation 2018 Annual Report
Belk Foundation 2018 Annual Report
 
Outstanding School Governance
Outstanding School GovernanceOutstanding School Governance
Outstanding School Governance
 
Almeer Ahsan Asif_EDU 506_Individual Reflection Paper_TFB2014
Almeer Ahsan Asif_EDU 506_Individual Reflection Paper_TFB2014Almeer Ahsan Asif_EDU 506_Individual Reflection Paper_TFB2014
Almeer Ahsan Asif_EDU 506_Individual Reflection Paper_TFB2014
 
Fas 101 short deck 10 16-15
Fas 101 short deck 10 16-15Fas 101 short deck 10 16-15
Fas 101 short deck 10 16-15
 
West London Zone: Operational plan
West London Zone: Operational planWest London Zone: Operational plan
West London Zone: Operational plan
 
Why Junior Achievement
Why Junior AchievementWhy Junior Achievement
Why Junior Achievement
 
Ofsted Annual Report 2018/19
Ofsted Annual Report 2018/19 Ofsted Annual Report 2018/19
Ofsted Annual Report 2018/19
 
President-Principal Model Presentation
President-Principal Model PresentationPresident-Principal Model Presentation
President-Principal Model Presentation
 
Improvements in performance version 2
Improvements in performance version 2Improvements in performance version 2
Improvements in performance version 2
 
Jones_Paideia_Family_Engagement_Plan
Jones_Paideia_Family_Engagement_PlanJones_Paideia_Family_Engagement_Plan
Jones_Paideia_Family_Engagement_Plan
 
survey2013-14web
survey2013-14websurvey2013-14web
survey2013-14web
 

Ähnlich wie District Resource Strategy: Presentation for SSLF

Transformation or Decline: How can states promote restructuring in tough times?
Transformation or Decline: How can states promote restructuring in tough times?Transformation or Decline: How can states promote restructuring in tough times?
Transformation or Decline: How can states promote restructuring in tough times?Education Resource Strategies
 
Leveraging Resource Allocation Reviews to Drive Meaningful Change for Students
Leveraging Resource Allocation Reviews to Drive Meaningful Change for StudentsLeveraging Resource Allocation Reviews to Drive Meaningful Change for Students
Leveraging Resource Allocation Reviews to Drive Meaningful Change for StudentsEducation Resource Strategies
 
SSATB INH TEST
SSATB INH TEST SSATB INH TEST
SSATB INH TEST tfrazzetto
 
How States Can Support Transformation in Tough Times
How States Can Support Transformation in Tough TimesHow States Can Support Transformation in Tough Times
How States Can Support Transformation in Tough TimesEducation Resource Strategies
 
NGL Phase 3 Overview
NGL Phase 3 OverviewNGL Phase 3 Overview
NGL Phase 3 Overviewmrchase
 
February Superintendent SBE Report 1.12.23_347984yturdpaadaely1a0jhvpvg0k.pdf
February Superintendent SBE Report 1.12.23_347984yturdpaadaely1a0jhvpvg0k.pdfFebruary Superintendent SBE Report 1.12.23_347984yturdpaadaely1a0jhvpvg0k.pdf
February Superintendent SBE Report 1.12.23_347984yturdpaadaely1a0jhvpvg0k.pdfEducationNC
 
NC State Principal Preparation
NC State Principal PreparationNC State Principal Preparation
NC State Principal PreparationAnalisa Sorrells
 
Signature Assignment CUR 528: Planning a Needs Assessment
Signature Assignment CUR 528: Planning a Needs Assessment Signature Assignment CUR 528: Planning a Needs Assessment
Signature Assignment CUR 528: Planning a Needs Assessment EricaLJonesMAEd
 
Rane Garcia-resume-2 pages (2)
Rane Garcia-resume-2 pages (2)Rane Garcia-resume-2 pages (2)
Rane Garcia-resume-2 pages (2)Rane Garcia
 
Woodland Preparatory School Alabama #Gulen #SonerTarim
Woodland Preparatory School Alabama #Gulen #SonerTarimWoodland Preparatory School Alabama #Gulen #SonerTarim
Woodland Preparatory School Alabama #Gulen #SonerTarimGulen Cemaat
 
LCH Annual Report January- December 2010
LCH Annual Report January- December 2010LCH Annual Report January- December 2010
LCH Annual Report January- December 2010lchprincipal
 
009 11 01 London Presentation Deckfor Academic Fiscal Solvency
009 11 01 London Presentation Deckfor Academic Fiscal Solvency009 11 01 London Presentation Deckfor Academic Fiscal Solvency
009 11 01 London Presentation Deckfor Academic Fiscal SolvencyGabrielaCr
 
Superintendent Entry Plan.Andrew.Kelly.Lyle.Schools
Superintendent Entry Plan.Andrew.Kelly.Lyle.SchoolsSuperintendent Entry Plan.Andrew.Kelly.Lyle.Schools
Superintendent Entry Plan.Andrew.Kelly.Lyle.SchoolsAndrew Kelly
 
State Board Leg Priorities Feb 2021
State Board Leg Priorities Feb 2021State Board Leg Priorities Feb 2021
State Board Leg Priorities Feb 2021EducationNC
 
GISA Symposium Presentation 2022.pdf
GISA Symposium Presentation 2022.pdfGISA Symposium Presentation 2022.pdf
GISA Symposium Presentation 2022.pdfNancyBent2
 
Review of the SIP.pptx
Review of the SIP.pptxReview of the SIP.pptx
Review of the SIP.pptxRenaeStewart1
 
Continuing to Improve Teaching Quality During Tough Economic Times
Continuing to Improve Teaching Quality During Tough Economic TimesContinuing to Improve Teaching Quality During Tough Economic Times
Continuing to Improve Teaching Quality During Tough Economic TimesEducation Resource Strategies
 

Ähnlich wie District Resource Strategy: Presentation for SSLF (20)

Transformation or Decline: How can states promote restructuring in tough times?
Transformation or Decline: How can states promote restructuring in tough times?Transformation or Decline: How can states promote restructuring in tough times?
Transformation or Decline: How can states promote restructuring in tough times?
 
Leveraging Resource Allocation Reviews to Drive Meaningful Change for Students
Leveraging Resource Allocation Reviews to Drive Meaningful Change for StudentsLeveraging Resource Allocation Reviews to Drive Meaningful Change for Students
Leveraging Resource Allocation Reviews to Drive Meaningful Change for Students
 
Sustaining Turnaround at Scale: Realizing
Sustaining Turnaround at Scale: RealizingSustaining Turnaround at Scale: Realizing
Sustaining Turnaround at Scale: Realizing
 
SSATB INH TEST
SSATB INH TEST SSATB INH TEST
SSATB INH TEST
 
How States Can Support Transformation in Tough Times
How States Can Support Transformation in Tough TimesHow States Can Support Transformation in Tough Times
How States Can Support Transformation in Tough Times
 
NGL Phase 3 Overview
NGL Phase 3 OverviewNGL Phase 3 Overview
NGL Phase 3 Overview
 
Avoyelles parish 2020 final shareout for release
Avoyelles parish 2020 final shareout for releaseAvoyelles parish 2020 final shareout for release
Avoyelles parish 2020 final shareout for release
 
Scaling and sustaining change
Scaling and sustaining changeScaling and sustaining change
Scaling and sustaining change
 
February Superintendent SBE Report 1.12.23_347984yturdpaadaely1a0jhvpvg0k.pdf
February Superintendent SBE Report 1.12.23_347984yturdpaadaely1a0jhvpvg0k.pdfFebruary Superintendent SBE Report 1.12.23_347984yturdpaadaely1a0jhvpvg0k.pdf
February Superintendent SBE Report 1.12.23_347984yturdpaadaely1a0jhvpvg0k.pdf
 
NC State Principal Preparation
NC State Principal PreparationNC State Principal Preparation
NC State Principal Preparation
 
Signature Assignment CUR 528: Planning a Needs Assessment
Signature Assignment CUR 528: Planning a Needs Assessment Signature Assignment CUR 528: Planning a Needs Assessment
Signature Assignment CUR 528: Planning a Needs Assessment
 
Rane Garcia-resume-2 pages (2)
Rane Garcia-resume-2 pages (2)Rane Garcia-resume-2 pages (2)
Rane Garcia-resume-2 pages (2)
 
Woodland Preparatory School Alabama #Gulen #SonerTarim
Woodland Preparatory School Alabama #Gulen #SonerTarimWoodland Preparatory School Alabama #Gulen #SonerTarim
Woodland Preparatory School Alabama #Gulen #SonerTarim
 
LCH Annual Report January- December 2010
LCH Annual Report January- December 2010LCH Annual Report January- December 2010
LCH Annual Report January- December 2010
 
009 11 01 London Presentation Deckfor Academic Fiscal Solvency
009 11 01 London Presentation Deckfor Academic Fiscal Solvency009 11 01 London Presentation Deckfor Academic Fiscal Solvency
009 11 01 London Presentation Deckfor Academic Fiscal Solvency
 
Superintendent Entry Plan.Andrew.Kelly.Lyle.Schools
Superintendent Entry Plan.Andrew.Kelly.Lyle.SchoolsSuperintendent Entry Plan.Andrew.Kelly.Lyle.Schools
Superintendent Entry Plan.Andrew.Kelly.Lyle.Schools
 
State Board Leg Priorities Feb 2021
State Board Leg Priorities Feb 2021State Board Leg Priorities Feb 2021
State Board Leg Priorities Feb 2021
 
GISA Symposium Presentation 2022.pdf
GISA Symposium Presentation 2022.pdfGISA Symposium Presentation 2022.pdf
GISA Symposium Presentation 2022.pdf
 
Review of the SIP.pptx
Review of the SIP.pptxReview of the SIP.pptx
Review of the SIP.pptx
 
Continuing to Improve Teaching Quality During Tough Economic Times
Continuing to Improve Teaching Quality During Tough Economic TimesContinuing to Improve Teaching Quality During Tough Economic Times
Continuing to Improve Teaching Quality During Tough Economic Times
 

Mehr von Education Resource Strategies

ERS System 20/20 Analysis of Denver Public Schools March, 2017
ERS System 20/20 Analysis of Denver Public Schools March, 2017ERS System 20/20 Analysis of Denver Public Schools March, 2017
ERS System 20/20 Analysis of Denver Public Schools March, 2017Education Resource Strategies
 
Same resources better student outcomes - adapted webinar deck
Same resources better student outcomes -  adapted webinar deckSame resources better student outcomes -  adapted webinar deck
Same resources better student outcomes - adapted webinar deckEducation Resource Strategies
 
ESSA Financial Reporting Implications for Resource Equity
ESSA Financial Reporting Implications for Resource EquityESSA Financial Reporting Implications for Resource Equity
ESSA Financial Reporting Implications for Resource EquityEducation Resource Strategies
 
Leading Education Reform in an Era of Limited Resources
Leading Education Reform in an Era of Limited ResourcesLeading Education Reform in an Era of Limited Resources
Leading Education Reform in an Era of Limited ResourcesEducation Resource Strategies
 
School Budget Hold ‘Em - Educate Texas Leadership Forum
School Budget Hold ‘Em - Educate Texas Leadership ForumSchool Budget Hold ‘Em - Educate Texas Leadership Forum
School Budget Hold ‘Em - Educate Texas Leadership ForumEducation Resource Strategies
 
Presentation to the DPS Board:Resource Mapping Summary Report
Presentation to the DPS Board:Resource Mapping Summary ReportPresentation to the DPS Board:Resource Mapping Summary Report
Presentation to the DPS Board:Resource Mapping Summary ReportEducation Resource Strategies
 
Transforming District Resources to Improve Teaching and Learning: State Optio...
Transforming District Resources to Improve Teaching and Learning: State Optio...Transforming District Resources to Improve Teaching and Learning: State Optio...
Transforming District Resources to Improve Teaching and Learning: State Optio...Education Resource Strategies
 
Deborah McGriff – Partner, NewSchools Venture Fund Presentation
Deborah McGriff – Partner, NewSchools Venture Fund PresentationDeborah McGriff – Partner, NewSchools Venture Fund Presentation
Deborah McGriff – Partner, NewSchools Venture Fund PresentationEducation Resource Strategies
 
Don Fraynd, Chief School Improvement Officer, Chicago Public Schools Presenta...
Don Fraynd, Chief School Improvement Officer, Chicago Public Schools Presenta...Don Fraynd, Chief School Improvement Officer, Chicago Public Schools Presenta...
Don Fraynd, Chief School Improvement Officer, Chicago Public Schools Presenta...Education Resource Strategies
 

Mehr von Education Resource Strategies (20)

Access to a Sound Basic Education
Access to a Sound Basic EducationAccess to a Sound Basic Education
Access to a Sound Basic Education
 
Maximizing Resources for School Improvement, Part 1
Maximizing Resources for School Improvement, Part 1Maximizing Resources for School Improvement, Part 1
Maximizing Resources for School Improvement, Part 1
 
Maximizing Resources for School Improvement, Part 2
Maximizing Resources for School Improvement, Part 2Maximizing Resources for School Improvement, Part 2
Maximizing Resources for School Improvement, Part 2
 
ERS System 20/20 Analysis of Denver Public Schools March, 2017
ERS System 20/20 Analysis of Denver Public Schools March, 2017ERS System 20/20 Analysis of Denver Public Schools March, 2017
ERS System 20/20 Analysis of Denver Public Schools March, 2017
 
Same resources better student outcomes - adapted webinar deck
Same resources better student outcomes -  adapted webinar deckSame resources better student outcomes -  adapted webinar deck
Same resources better student outcomes - adapted webinar deck
 
ESSA Financial Reporting Implications for Resource Equity
ESSA Financial Reporting Implications for Resource EquityESSA Financial Reporting Implications for Resource Equity
ESSA Financial Reporting Implications for Resource Equity
 
Philadelphia Findings May 2015
Philadelphia Findings May 2015Philadelphia Findings May 2015
Philadelphia Findings May 2015
 
Student-Based Budgeting Webinar
Student-Based Budgeting WebinarStudent-Based Budgeting Webinar
Student-Based Budgeting Webinar
 
Rennie Center Presentation
Rennie Center PresentationRennie Center Presentation
Rennie Center Presentation
 
Leading Education Reform in an Era of Limited Resources
Leading Education Reform in an Era of Limited ResourcesLeading Education Reform in an Era of Limited Resources
Leading Education Reform in an Era of Limited Resources
 
NCSL Session
NCSL SessionNCSL Session
NCSL Session
 
Tennessee School Design Class
Tennessee School Design ClassTennessee School Design Class
Tennessee School Design Class
 
Weighted Student Funding Overview
Weighted Student Funding OverviewWeighted Student Funding Overview
Weighted Student Funding Overview
 
School Budget Hold ‘Em - Educate Texas Leadership Forum
School Budget Hold ‘Em - Educate Texas Leadership ForumSchool Budget Hold ‘Em - Educate Texas Leadership Forum
School Budget Hold ‘Em - Educate Texas Leadership Forum
 
Presentation to the DPS Board:Resource Mapping Summary Report
Presentation to the DPS Board:Resource Mapping Summary ReportPresentation to the DPS Board:Resource Mapping Summary Report
Presentation to the DPS Board:Resource Mapping Summary Report
 
Tough Times as opportunity
Tough Times as opportunityTough Times as opportunity
Tough Times as opportunity
 
Transforming District Resources to Improve Teaching and Learning: State Optio...
Transforming District Resources to Improve Teaching and Learning: State Optio...Transforming District Resources to Improve Teaching and Learning: State Optio...
Transforming District Resources to Improve Teaching and Learning: State Optio...
 
Deborah McGriff – Partner, NewSchools Venture Fund Presentation
Deborah McGriff – Partner, NewSchools Venture Fund PresentationDeborah McGriff – Partner, NewSchools Venture Fund Presentation
Deborah McGriff – Partner, NewSchools Venture Fund Presentation
 
Wrap Up Reflections
Wrap Up ReflectionsWrap Up Reflections
Wrap Up Reflections
 
Don Fraynd, Chief School Improvement Officer, Chicago Public Schools Presenta...
Don Fraynd, Chief School Improvement Officer, Chicago Public Schools Presenta...Don Fraynd, Chief School Improvement Officer, Chicago Public Schools Presenta...
Don Fraynd, Chief School Improvement Officer, Chicago Public Schools Presenta...
 

Kürzlich hochgeladen

HMCS Vancouver Pre-Deployment Brief - May 2024 (Web Version).pptx
HMCS Vancouver Pre-Deployment Brief - May 2024 (Web Version).pptxHMCS Vancouver Pre-Deployment Brief - May 2024 (Web Version).pptx
HMCS Vancouver Pre-Deployment Brief - May 2024 (Web Version).pptxmarlenawright1
 
Fostering Friendships - Enhancing Social Bonds in the Classroom
Fostering Friendships - Enhancing Social Bonds  in the ClassroomFostering Friendships - Enhancing Social Bonds  in the Classroom
Fostering Friendships - Enhancing Social Bonds in the ClassroomPooky Knightsmith
 
Key note speaker Neum_Admir Softic_ENG.pdf
Key note speaker Neum_Admir Softic_ENG.pdfKey note speaker Neum_Admir Softic_ENG.pdf
Key note speaker Neum_Admir Softic_ENG.pdfAdmir Softic
 
Jual Obat Aborsi Hongkong ( Asli No.1 ) 085657271886 Obat Penggugur Kandungan...
Jual Obat Aborsi Hongkong ( Asli No.1 ) 085657271886 Obat Penggugur Kandungan...Jual Obat Aborsi Hongkong ( Asli No.1 ) 085657271886 Obat Penggugur Kandungan...
Jual Obat Aborsi Hongkong ( Asli No.1 ) 085657271886 Obat Penggugur Kandungan...ZurliaSoop
 
Towards a code of practice for AI in AT.pptx
Towards a code of practice for AI in AT.pptxTowards a code of practice for AI in AT.pptx
Towards a code of practice for AI in AT.pptxJisc
 
Interdisciplinary_Insights_Data_Collection_Methods.pptx
Interdisciplinary_Insights_Data_Collection_Methods.pptxInterdisciplinary_Insights_Data_Collection_Methods.pptx
Interdisciplinary_Insights_Data_Collection_Methods.pptxPooja Bhuva
 
Python Notes for mca i year students osmania university.docx
Python Notes for mca i year students osmania university.docxPython Notes for mca i year students osmania university.docx
Python Notes for mca i year students osmania university.docxRamakrishna Reddy Bijjam
 
Wellbeing inclusion and digital dystopias.pptx
Wellbeing inclusion and digital dystopias.pptxWellbeing inclusion and digital dystopias.pptx
Wellbeing inclusion and digital dystopias.pptxJisc
 
Single or Multiple melodic lines structure
Single or Multiple melodic lines structureSingle or Multiple melodic lines structure
Single or Multiple melodic lines structuredhanjurrannsibayan2
 
How to Add New Custom Addons Path in Odoo 17
How to Add New Custom Addons Path in Odoo 17How to Add New Custom Addons Path in Odoo 17
How to Add New Custom Addons Path in Odoo 17Celine George
 
This PowerPoint helps students to consider the concept of infinity.
This PowerPoint helps students to consider the concept of infinity.This PowerPoint helps students to consider the concept of infinity.
This PowerPoint helps students to consider the concept of infinity.christianmathematics
 
Google Gemini An AI Revolution in Education.pptx
Google Gemini An AI Revolution in Education.pptxGoogle Gemini An AI Revolution in Education.pptx
Google Gemini An AI Revolution in Education.pptxDr. Sarita Anand
 
Beyond_Borders_Understanding_Anime_and_Manga_Fandom_A_Comprehensive_Audience_...
Beyond_Borders_Understanding_Anime_and_Manga_Fandom_A_Comprehensive_Audience_...Beyond_Borders_Understanding_Anime_and_Manga_Fandom_A_Comprehensive_Audience_...
Beyond_Borders_Understanding_Anime_and_Manga_Fandom_A_Comprehensive_Audience_...Pooja Bhuva
 
Salient Features of India constitution especially power and functions
Salient Features of India constitution especially power and functionsSalient Features of India constitution especially power and functions
Salient Features of India constitution especially power and functionsKarakKing
 
2024-NATIONAL-LEARNING-CAMP-AND-OTHER.pptx
2024-NATIONAL-LEARNING-CAMP-AND-OTHER.pptx2024-NATIONAL-LEARNING-CAMP-AND-OTHER.pptx
2024-NATIONAL-LEARNING-CAMP-AND-OTHER.pptxMaritesTamaniVerdade
 
Understanding Accommodations and Modifications
Understanding  Accommodations and ModificationsUnderstanding  Accommodations and Modifications
Understanding Accommodations and ModificationsMJDuyan
 
ICT Role in 21st Century Education & its Challenges.pptx
ICT Role in 21st Century Education & its Challenges.pptxICT Role in 21st Century Education & its Challenges.pptx
ICT Role in 21st Century Education & its Challenges.pptxAreebaZafar22
 
Micro-Scholarship, What it is, How can it help me.pdf
Micro-Scholarship, What it is, How can it help me.pdfMicro-Scholarship, What it is, How can it help me.pdf
Micro-Scholarship, What it is, How can it help me.pdfPoh-Sun Goh
 
Sociology 101 Demonstration of Learning Exhibit
Sociology 101 Demonstration of Learning ExhibitSociology 101 Demonstration of Learning Exhibit
Sociology 101 Demonstration of Learning Exhibitjbellavia9
 

Kürzlich hochgeladen (20)

HMCS Vancouver Pre-Deployment Brief - May 2024 (Web Version).pptx
HMCS Vancouver Pre-Deployment Brief - May 2024 (Web Version).pptxHMCS Vancouver Pre-Deployment Brief - May 2024 (Web Version).pptx
HMCS Vancouver Pre-Deployment Brief - May 2024 (Web Version).pptx
 
Mehran University Newsletter Vol-X, Issue-I, 2024
Mehran University Newsletter Vol-X, Issue-I, 2024Mehran University Newsletter Vol-X, Issue-I, 2024
Mehran University Newsletter Vol-X, Issue-I, 2024
 
Fostering Friendships - Enhancing Social Bonds in the Classroom
Fostering Friendships - Enhancing Social Bonds  in the ClassroomFostering Friendships - Enhancing Social Bonds  in the Classroom
Fostering Friendships - Enhancing Social Bonds in the Classroom
 
Key note speaker Neum_Admir Softic_ENG.pdf
Key note speaker Neum_Admir Softic_ENG.pdfKey note speaker Neum_Admir Softic_ENG.pdf
Key note speaker Neum_Admir Softic_ENG.pdf
 
Jual Obat Aborsi Hongkong ( Asli No.1 ) 085657271886 Obat Penggugur Kandungan...
Jual Obat Aborsi Hongkong ( Asli No.1 ) 085657271886 Obat Penggugur Kandungan...Jual Obat Aborsi Hongkong ( Asli No.1 ) 085657271886 Obat Penggugur Kandungan...
Jual Obat Aborsi Hongkong ( Asli No.1 ) 085657271886 Obat Penggugur Kandungan...
 
Towards a code of practice for AI in AT.pptx
Towards a code of practice for AI in AT.pptxTowards a code of practice for AI in AT.pptx
Towards a code of practice for AI in AT.pptx
 
Interdisciplinary_Insights_Data_Collection_Methods.pptx
Interdisciplinary_Insights_Data_Collection_Methods.pptxInterdisciplinary_Insights_Data_Collection_Methods.pptx
Interdisciplinary_Insights_Data_Collection_Methods.pptx
 
Python Notes for mca i year students osmania university.docx
Python Notes for mca i year students osmania university.docxPython Notes for mca i year students osmania university.docx
Python Notes for mca i year students osmania university.docx
 
Wellbeing inclusion and digital dystopias.pptx
Wellbeing inclusion and digital dystopias.pptxWellbeing inclusion and digital dystopias.pptx
Wellbeing inclusion and digital dystopias.pptx
 
Single or Multiple melodic lines structure
Single or Multiple melodic lines structureSingle or Multiple melodic lines structure
Single or Multiple melodic lines structure
 
How to Add New Custom Addons Path in Odoo 17
How to Add New Custom Addons Path in Odoo 17How to Add New Custom Addons Path in Odoo 17
How to Add New Custom Addons Path in Odoo 17
 
This PowerPoint helps students to consider the concept of infinity.
This PowerPoint helps students to consider the concept of infinity.This PowerPoint helps students to consider the concept of infinity.
This PowerPoint helps students to consider the concept of infinity.
 
Google Gemini An AI Revolution in Education.pptx
Google Gemini An AI Revolution in Education.pptxGoogle Gemini An AI Revolution in Education.pptx
Google Gemini An AI Revolution in Education.pptx
 
Beyond_Borders_Understanding_Anime_and_Manga_Fandom_A_Comprehensive_Audience_...
Beyond_Borders_Understanding_Anime_and_Manga_Fandom_A_Comprehensive_Audience_...Beyond_Borders_Understanding_Anime_and_Manga_Fandom_A_Comprehensive_Audience_...
Beyond_Borders_Understanding_Anime_and_Manga_Fandom_A_Comprehensive_Audience_...
 
Salient Features of India constitution especially power and functions
Salient Features of India constitution especially power and functionsSalient Features of India constitution especially power and functions
Salient Features of India constitution especially power and functions
 
2024-NATIONAL-LEARNING-CAMP-AND-OTHER.pptx
2024-NATIONAL-LEARNING-CAMP-AND-OTHER.pptx2024-NATIONAL-LEARNING-CAMP-AND-OTHER.pptx
2024-NATIONAL-LEARNING-CAMP-AND-OTHER.pptx
 
Understanding Accommodations and Modifications
Understanding  Accommodations and ModificationsUnderstanding  Accommodations and Modifications
Understanding Accommodations and Modifications
 
ICT Role in 21st Century Education & its Challenges.pptx
ICT Role in 21st Century Education & its Challenges.pptxICT Role in 21st Century Education & its Challenges.pptx
ICT Role in 21st Century Education & its Challenges.pptx
 
Micro-Scholarship, What it is, How can it help me.pdf
Micro-Scholarship, What it is, How can it help me.pdfMicro-Scholarship, What it is, How can it help me.pdf
Micro-Scholarship, What it is, How can it help me.pdf
 
Sociology 101 Demonstration of Learning Exhibit
Sociology 101 Demonstration of Learning ExhibitSociology 101 Demonstration of Learning Exhibit
Sociology 101 Demonstration of Learning Exhibit
 

District Resource Strategy: Presentation for SSLF

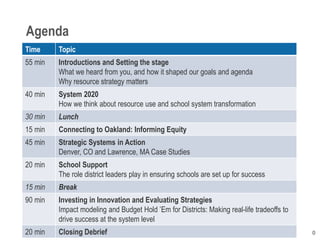
  • 1. 0 Agenda Time Topic 55 min Introductions and Setting the stage What we heard from you, and how it shaped our goals and agenda Why resource strategy matters 40 min System 2020 How we think about resource use and school system transformation 30 min Lunch 15 min Connecting to Oakland: Informing Equity 45 min Strategic Systems in Action Denver, CO and Lawrence, MA Case Studies 20 min School Support The role district leaders play in ensuring schools are set up for success 15 min Break 90 min Investing in Innovation and Evaluating Strategies Impact modeling and Budget Hold ’Em for Districts: Making real-life tradeoffs to drive success at the system level 20 min Closing Debrief
  • 2. © Education Resource Strategies, Inc., 2013 District Resource Strategy SSLF  February 14, 2018
  • 3. Resources for SSLF available on the ERS website! https://www.erstrategies.org/tap/school_systems_leaders_ fellowship_resources 2 Wednesday, February 14, 2018
  • 4. The following CONTENT will be made available for THIS AUDIENCE following today’s session
  • 5. Education Resource Strategies is a non-profit that partners with system and school leaders to transform how they use resources—people, time, and money so that regardless of race, income, or ability, every child is ready for tomorrow. Our Mission
  • 6. Who we are: ERS partners with districts across the country to transform resource use so that every school succeeds for every student. WEST COAST California Sacramento, Oakland, Los Angeles Colorado Denver SOUTHWEST 15 Arizona Arizona Community Foundation New Mexico Santa Fe, Albuquerque Oklahoma Tulsa Texas El Paso, Austin, Aldine, Spring Branch MIDWEST Minnesota St. Paul Illinois Chicago Indiana Indianapolis Ohio Cleveland, Cincinnati Michigan Michigan State University SOUTH Tennessee Memphis, Nashville, Knox County, TN Dept. of Education Georgia Atlanta, GA Dept. of Education Florida Duval County, Lake County, Palm Beach County North Carolina Charlotte-Mecklenburg Louisiana Avoyelles Parish, LA Dept. of Education NORTHEAST Massachusetts Boston, Cambridge, Holyoke Rhode Island Providence Connecticut Hartford, Waterbury, New Haven, Connecticut Council for Education Reform New York Buffalo, Rochester, Syracuse, New York City, NY State Dept. of Education Pennsylvania Philadelphia New Jersey Newark Maryland Baltimore, Prince George’s County Washington, D.C. D.C. Public Schools Current State Work Past State Work Current District Work Past District Work
  • 7. Wait, so does this mean…?? 6
  • 9. But first… here’s what we heard from you 8 Funding and budgeting best practice What are the key decisions successful states make behind how funding is determined for districts? What are effective approaches to building school-based and district- level budget models? How do you make difficult funding choices during times when there are resource constraints?
  • 10. But first… here’s what we heard from you 9 Interest in strategic school design and effective school support How do you effectively align resources to schools with the most need – and support them? How do you structure professional development that is both district wide and school based? What is the connection between leadership and teaching? How do we align the right types of central office supports to empower schools leaders?
  • 11. But first… here’s what we heard from you 10 Prioritization and decision-making What do we do when the data doesn't provide us with information necessary to make smart funding decisions (i.e. 99% of teachers rated effective or highly effective)? What do you do if the areas that need the most improvement are outside of your wheelhouse? How do I help districts use their data to evaluate their needs and then strategically target their resources? Where do you start, as superintendent or c- level, if the vast majority of the resource check was "sometimes"? Which resources are MOST important for district transformation? How do you effectively share this information with senior leaders to spark conversation and action, not controversy?
  • 12. 11 How you see yourselves: Resource Check
  • 13. How you see yourselves: Resource Check 12 1 2 4 6 7 4 2 3 1 The district empowers each school leader to organize resources to support his or her chosen instructional model and student and staff needs. Portfolio: The district actively plans school sizes and configurations, balancing student needs for effective programs with available staff, facility, and funding resources. Strongly Disagree Disagree Agree Strongly Agree Don't know 5 3 1 6 8 5 6 4 4 3 5 4 4 1 4 4 4 1 3 The district has a deliberate turnaround strategy for… The district's central office promotes a supportive culture for schools and differentiates support and resources based on the… The district sets clear and meaningful targets for academic performance growth for all schools. The district integrates student, teacher, and resource data and… The district actively manages central costs and service quality. Never/ Strongly Disagree Sometimes/ Disagree Frequently/ Agree Always/ Strongly Agree Don't know School Design School Support
  • 14. With that in mind, our goals for today are: 1. Establish a common set of principles about strategic resource use that apply to all types of school systems 2. Identify ways that innovative schools are organizing people, time and money most strategically 3. Assess the role district leaders play in supporting and enabling school-level strategic resource use 4. Simulate the process of identifying and making real-life resource tradeoffs at the system level 13
  • 15. Norms Ask questions throughout the day* Draw on each other’s experiences Maintain a healthy respect for the clock * no, there are no dumb ones 14
  • 16. 15 Agenda Time Topic 55 min Introductions and Setting the stage What we heard from you, and how it shaped our goals and agenda Why resource strategy matters 40 min System 2020 How we think about resource use and school system transformation 30 min Lunch 15 min Connecting to Oakland: Informing Equity 45 min Strategic Systems in Action Denver, CO and Lawrence, MA Case Studies 20 min School Support The role district leaders play in ensuring schools are set up for success 15 min Break 90 min Investing in Innovation and Evaluating Strategies Impact modeling and Budget Hold ’Em for Districts: Making real-life tradeoffs to drive success at the system level 20 min Closing Debrief
  • 17. What is the current state of education funding? Setting the stage:
  • 18. Until the great recession hit, real spending on education had increased nearly every year since 1920 17 $0 $2,000 $4,000 $6,000 $8,000 $10,000 $12,000 $14,000 National Public K-12 Expenditures Per Pupil (1920-2014) ($M) Current expenditures Per Pupil (Real) Current expenditures Per Pupil (Nominal)* Source: National Center for Education Statistics: Digest of Education Statistics. *Nominal expenditures expressed in constant 2016 dollars.
  • 19. Spending varies widely across districts... 18Source: ERS database $7,800 $8,300 $9,200 $10,200 $10,800 $13,000 $14,100 $14,400 $16,800 $21,100 Aldine, TX Charlotte Knox County, TN Fulton County, GA Denver Prince George's County, MD Baltimore Cleveland D.C. Newark Per-Pupil Spending on Education ~3x
  • 20. Systemic Budget Gaps cost structure rises regardless of revenue 19 • Longevity based teaching salaries grow at ~2-4% annually • Benefits growing at ~10+% annually • SPED spending continues to grow • Pre-set COLA increases • Tax revenue falling • Enrollment declining • Drop in Federal Funds
  • 21. What do districts spend their money on?
  • 22. School Spending Quiz: Central administration consumes a significant portion of district funding True or False?
  • 23. False: Most urban districts spend less on central overhead than commonly perceived 22 District Governance, Management of the support services provide to Schools Example: Superintendent, Board, Strategy, Dir. of Math, Dir. of Transportation Leadership & Management “Central Overhead” All FTEs, services, and materials allocated directly to schools in the district expenditures Example: SBB Allocations, Non-SBB Resources All FTEs, services, and materials not reported on the school budget, but support schools on a regular and predictable basis Example: Athletics, Prep Kitchens, PSNs School- attributed All FTEs, services, and materials that provide support to schools in ways that leverage scale across schools Example: Transportation, Maintenance Shared Services “School- Attributed” This is what ERS uses to compare spending across schools. District X 7% 13% 8% 72%
  • 24. School Spending Quiz: Instruction is the primary business and consumes what % of the budget? 1. 50-60% 2. 60-70% 3. 75%+
  • 25. Typically 50-60% of most districts’ budgets is spent on instruction in schools 24 56% 56% 58% 53% 55% 58% 59% 52% 57% 6% 5% 6% 6% 6% 6% 5% 6% 6% 20% 19% 20% 23% 21% 20% 18% 22% 16% 7% 9% 5% 6% 6% 6% 8% 8% 8% 8% 7% 8% 8% 8% 7% 7% 8% 8% 4% 5% 3% 4% 4% 3% 3% 4% 5% District Average Palm Beach Duval CoutyLake County Aldine Charlotte Fulton PGC Denver Breakdown of Total Operating Spending: % by Use Business Services Leadership Pupil Services & Enrichment O&M ISPD Instruction Source: SDPBC FY15 Expenditures, ERS analysis, ERS Benchmark Database Adj. $pp $9.4 $9.8 $8.5 $7.4 $7.9 $9.7 $10.4 $11.6 Year 2014-2015 2009-2010 2011-2012 2012-2013 2013-2014 2010-2011 2012-2013 2009-2010 PreK-12 Enrollment 166 (K) 121 (K) 36 (K) 66 (K) 137 (K) 88 (K) 126 (K) 77 (K)
  • 26. School Spending Quiz: School level spending goes mostly to people and consumes what % of the budget? 1) 60-70% 2) 70-80% 3) 80-90%
  • 27. 80-90% of a schools budget is typically spent on staff; therefore, strategic budget reform must look first and foremost at people or “Who does What?” 26 65% 5% 2% 5% 8% 1% 2% 9% School X Teachers Instructional Aides Student support Administration Clerks & Other Staff Substitutes Supplies & Contracted Services Utilities & Maintenance
  • 28. Linking dollars to student performance: A one-word research history and the word is “no.” 27 A generation of research: Do resources/inputs matter?  Hanushek summarizes the existing literature to say “no.”  Dollars per pupil are NOT systematically related to student outcomes  Very consistent finding over time  Consistently cited as reason to oppose spending increases
  • 30. Many districts and schools still invest in practices with little impact on student outcomes 29 Restructuring Resources for High Performing Schools .(2011). Watertown, MA: Education Resource Strategies Up to $0.40 of every $1 spent is not correlated with student outcomes Teacher comp. not aligned with student learning Whole day class size reductions in all subjects Students in overly restrictive settings Time not varied for student proficien cy 5-15¢ 10-15¢ 3-5¢ 3-5¢ “Resource Misalignments”
  • 31. Four types of Resource Misalignments Underinvestment in the right things Non-strategic over- investment in “good things” Piecemeal investment in an integrated solution Opportunities for Reallocation Opportunities for Strategic Investment Resources tied up in the wrong things
  • 32. Example: Investing more time for struggling students 24% 25% 24% 29% 21% 19% 20% 16% 19% 21% 17% 15% 15% 14% 16% Fulton Hall Treutlen Vidalia Marietta % Time in 9th Grade Math, by Prior Year Proficiency Did not meet standards Proficient Advanced Source: ERS Piecemeal investment in an integrated solution 24% 14% Math Support Teachers All Math Teachers % of All Teachers that are Novice Most GA districts gave additional time to struggling students…. However, these classes were disproportionately staffed by novice teachers
  • 33. Reflection (3 minutes) 32 Turn to your neighbor: What resource misalignments have you seen in your district, CMO, or across your state? Why do you think they persist?
  • 34. The status quo persists because re-aligning resources is hard  Pure operating efficiencies are small and miss the point  Quick timelines inhibit significant changes  Complex reallocations are multi-year, some with up-front investment  Hard to mobilize around the “from” without a clear vision for the “to”  Can require eliminating policy barriers and/or changing peoples’ jobs  Realigning resources may not be what the public or board wants
  • 35. Re-aligning resources is necessary  Dramatic, stubborn achievement gaps  Perennially limited resources  Higher standards / Common Core  Demand for information-age learning  Increasing competition for students between traditional and charter schools  Our pursuit of equity and social justice require us to act
  • 36. Guiding questions – from up on the balcony 1. What is my district’s/CMO’s overall resource picture with regard to strategic vs. non-strategic use? 2. What process does my district/CMO use for making resource decisions? How can I influence that process? 3. What aspects of resource use do I control? How can I have the most impact with the control I have? 4. What will I do when I get back to work? Districts and CMOs
  • 37. Guiding questions – from up on the balcony 1. What state policies or practices are intended to support districts’ strategic resource use? How well do they currently accomplish that aim? 2. What tools/supports/data does my state offer districts to support their resource decision-making? 3. How can I influence policies/tools/etc. within and support their effective use? How can I have the most impact with the influence I have? 4. What will I do when I get back to work? States
  • 38. 37 Agenda Time Topic 55 min Introductions and Setting the stage What we heard from you, and how it shaped our goals and agenda Why resource strategy matters 40 min System 2020 How we think about resource use and school system transformation 30 min Lunch 15 min Connecting to Oakland: Informing Equity 45 min Strategic Systems in Action Denver, CO and Lawrence, MA Case Studies 20 min School Support The role district leaders play in ensuring schools are set up for success 15 min Break 90 min Investing in Innovation and Evaluating Strategies Impact modeling and Budget Hold ’Em for Districts: Making real-life tradeoffs to drive success at the system level 20 min Closing Debrief
  • 39.  Inspiring innovation: Transform Now video 38 Transform Now
  • 40. The School System 20/20 framework
  • 41. Transforming outcomes for all students requires tackling outmoded structures 40 System 20/20 Domain From To Standards & Instructional Resources Inconsistent or inadequate standards with little support for teachers. Rigorous, information-age standards supported by effective curricula and assessments. Teaching Isolated teachers with limited support, flexibility, opportunities for growth. A new way we hire, assign, support, team, pay, and promote teachers. School Design A one-size-fits-all learning environment that holds everyone back. A re-imagined school day with new schedules, dynamic groupings and targeted instruction. Leadership Limited autonomy, flexibility & support to develop and reward strong leaders. Clear standards, support, and account- ability for principals and district leaders. School Support & Accountability Central office staff responsibilities that focus on compliance and oversight. The central office is a service and strategy partner in sharing best practices and ensuring all schools reach learning goals. Funding & Portfolio Wide funding variances across schools. Systems that allocate resources equitably and flexibly across schools. Community Engagement Schools providing a wide range of services in addition to their core educational mission. Partnering to create innovative and cost- effective ways to serve students better.
  • 42. 1. Revise funding formulas to achieve greater equity, transparency and flexibility 2. Implement strategic school designs that personalize learning for students based on need 3. Restructure investments in PD and teacher time to create “connected professional learning” for teachers and leaders 41 Three high-priority levers for transformation:
  • 43. Elements of a healthy school funding system Flexibility School leaders define the resources they need to drive student achievement Equity Resources are distributed equitably based on student need Transparency Clear and easily understood rules for where, how, and why dollars flow
  • 44. $0 $2,000 $4,000 $6,000 $8,000 $10,000 $12,000 $14,000 $16,000 60 15 39 367 346 51 61 99 34 114 82 105 79 42 14 90 49 54 88 107 31 103 327 109 69 48 384 93 94 315 83 359 19 63 106 391 356 44 55 87 96 57 74 302 58 16 43 70 65 621 716 618 501 614 723 626 617 708 School Attributed $ per Weighted Pupil ($pwp) Magnet Traditional 43 After adjusting for student need, District X still has a significant amount of variation in its student funding Source: ERS analysis Median: $7.3K Hi-Lo Spread: 1.9x Median: $8.9K Hi-Lo Spread: 2.3x ES/K-8 HS
  • 45. The extent to which spending levels vary based on need varies across systems 44 R² = 0.767 $0 $2,000 $4,000 $6,000 $8,000 $10,000 $12,000 $14,000 1.00 1.10 1.20 1.30 1.40 R² = 0.2562 $0 $2,000 $4,000 $6,000 $8,000 $10,000 1.00 1.10 1.20 1.30 1.40 1.50 1.60 R² = 0.499 $0 $2,000 $4,000 $6,000 $8,000 $10,000 $12,000 $14,000 1.00 1.10 1.20 1.30 1.40 1.50 R² = 0.1437 $0 $2,000 $4,000 $6,000 $8,000 $10,000 $12,000 1.00 1.10 1.20 1.30 1.40
  • 46. 45 Districts should determine if variation is intentional and strategic and then adjust accordingly to improve equity District Strategy School opening/closure $ School Level $ School Type $ Student Need Special Education $$$ English Language Learners $$ Economic Disadvantage $$ Other Student Needs $ Unplanned Enrollment/ School Size $$$ Teacher Compensation $ Building Utilization $ Enrollment Projections $ Ad-hoc exceptions $
  • 47. 1. Revise funding formulas to achieve greater equity, transparency and flexibility 2. Implement strategic school designs that personalize learning for students based on need 3. Restructure investments in PD and teacher time to create “connected professional learning” for teachers and leaders 46 Three high-priority levers for transformation:
  • 48. 47 Most schools organize people, time, and money the same way they did 50+ years ago One teacher per class 20-30 students per class Studying a particular subject For a set period of time (e.g., 50 min/day) For a set duration (e.g., full year)
  • 49. 48 ERS’ Strategic School Design Essentials Expert-led Collaborative Work and Professional Learning Organize teachers into expert-led teams focused on the design and delivery of instruction, and provide ongoing growth- oriented feedback Talent Management and Teacher Leadership Attract and retain the best teachers, and assign roles and responsibilities to match skills to school and student need Empowering Curricula, Instruction, and Assessment Uphold rigorous, college-and- career-ready standards and use effective curricula, instructional strategies, and assessments to achieve them Personalized Time and Attention Match student grouping, learning time, technology and program to individual student needs Responsive Learning Community Ensure students are deeply known and more intensive social and emotional supports are integrated when necessary Growth-oriented Adult Culture Grow a collaborative culture where teachers and leaders share ownership of a common instructional vision and student learning
  • 50. Most districts have opportunities to strategically raise class size… 49 Source: Elementary Grades Homeroom file Oct 2009; Includes elementary schools and K-8 schools (grades K0-5); excludes classes that are special education 60%+, ELL 60%+; includes Advanced Work classes; excludes schools with Two-Way bilingual program; excludes classes with “mixed” grade (mainly due to teacher data NA); ERS analysis 21 22 22 2222 25 28 31 Grades K-2 Grades 3-5 Grades 6-8 Grades 9-12 In this District Class Sizes are Far from Maximum and Do Not Vary by Grade Average class size Contract max
  • 51. …and to target class sizes to priority subjects and students *Core class defined as ELA, Math, Science, Social Studies; Non-core defined as Arts, Computer Literacy, Vocational, Foreign Language Source: District A and B 9th and 12th grade course data (internal – Resource Mapping presentation); ERS analysis In these districts class sizes for core subjects are higher than non-core 27 21 18 18 District T District L Average Class Size by Course Type 9th Grade Core Class Size* 12th Grade Non-Core Class Size 50
  • 52. Most schools have the opportunity to optimize time by subject… 51Source: ERS analysis 0% 10% 20% 30% 40% 50% 60% 70% 80% 90% 100% ES 7-9 10-12 PE Electives Foreign Language Science Social Studies Math ELA Typical District Percent of Student Time By Grade and Subject
  • 53. ….And by student need 52 Note: % Time is based on the instructional time throughout the school day. It only includes periods entered in PowerSchool and does not include passing time, lunch, recess or maintenance/homeroom classes. Source: ERS Analysis, CMS SY2013-2014 Course Schedule PowerSchool Data, CMS SY2012-2013 EOG Performance Data 22% 22% 22% 22% 16% 14% 16% 14% 2% 5% Below Basic Proficient %ofInstructionalTime Prior Year ELA EOG Avg. % of Time by Core Subject for Below Basic and Proficient Middle School Students Foreign Lang. Social Studies Science ELA Math
  • 54. Many districts have an opportunity to increase instructional time by increasing the school day 53 Sources: District figures are from Time and Attention in Urban High Schools: Lessons for School Systems (Frank, 2010) and from ERS analyses for the Aspen CFO network. Leading Edge school figures are from Shields, R. A., and K. H. Miles. 2008. Strategic Designs: Lessons from Leading Edge Small Urban High Schools. Watertown, MA: Education Resource Strategies. Charter school figures are from The Boston Foundation report (May 2010) “Out of the Debate and Into the Schools.” ERS analysis. 963 1080 1110 1120 1125 1138 1160 1170 1180 1200 1210 1250 1250 1260 1276 1476 Chicago PG County LA Boston Seattle St Paul Milwaukee Washington DC Rochester Denver Baltimore Pittsburgh Philadelphia Atlanta Leading Edge schools Boston Charters Student Hours Per Year National Avg. = 1170
  • 55. To target individual attention to students, in the short term, you can... 54 To Support Sustainable Transformation Invest transition resources to  Provide expert PD to increase teacher capacity to use individual attention strategies  Create and use formative assessments and tools to enable targeted instruction and grouping Lay the groundwork for long-term change by…  Build understanding of impact of targeted group sizes & teaching effectiveness in strategic designs To Reverse Misalignments Reduce spending by…  Increasing general class size targets  Increasing class size for specific low need students, grade levels, and subjects  Leveraging technology for high cost courses and selected lessons Increase spending to …  Reduce group size for high need students, skills, grade levels and subjects
  • 56. How does Revere High’s ninth grade academy reflect the Strategic School Design Essentials? Introduction: Revere High School has prioritized the 9th grade student experience though a 9th grade academy. The academy is designed to provide additional support and time to students as they face more rigorous content through flipped learning and flexible groupings. As you watch, consider:  Which design essentials are most evident in Revere’s ninth grade strategy?  How do the design essentials identified relate to the larger System 20/20 Framework?  In what specific ways can we draw a connection between the conditions we as system leaders we create and the empowerment of school leaders to support students in creative ways? 55
  • 57.  Revere 9th grade Academy: Video 56 How does Revere High provide personalized learning to students?
  • 58. Foundational concepts 1. There are consistent guiding principles for strategic resource use, regardless of the specific priorities and sequence of action a single district pursues 2. In successful systems, strategy and resource allocation decisions connect to actual improvement in outcomes, however they can 3. Strategic resource decisions have implications at all levels – for schools, for how you think about supporting schools, and for each district function 57
  • 60. 59 Agenda Time Topic 55 min Introductions and Setting the stage What we heard from you, and how it shaped our goals and agenda Why resource strategy matters 40 min System 2020 How we think about resource use and school system transformation 30 min Lunch 15 min Connecting to Oakland: Informing Equity 45 min Strategic Systems in Action Denver, CO and Lawrence, MA Case Studies 20 min School Support The role district leaders play in ensuring schools are set up for success 15 min Break 90 min Investing in Innovation and Evaluating Strategies Impact modeling and Budget Hold ’Em for Districts: Making real-life tradeoffs to drive success at the system level 20 min Closing Debrief
  • 61.  Informing Equity: A study of resource allocation across Oakland’s charter and traditional district schools  Discussion questions: 1. What were the most striking resource misalignments both between systems of schools and within each system? 2. To what extent do the findings here resonate with your experience in your home cities/states? 3. What do you see as the key opportunities to begin moving toward a more equitable system of schools across Oakland? 60 Connecting to Oakland: Informing Equity
  • 62. 61 Agenda Time Topic 55 min Introductions and Setting the stage What we heard from you, and how it shaped our goals and agenda Why resource strategy matters 40 min System 2020 How we think about resource use and school system transformation 30 min Lunch 15 min Connecting to Oakland: Informing Equity 45 min Strategic Systems in Action Denver, CO and Lawrence, MA Case Studies 20 min School Support The role district leaders play in ensuring schools are set up for success 15 min Break 90 min Investing in Innovation and Evaluating Strategies Impact modeling and Budget Hold ’Em for Districts: Making real-life tradeoffs to drive success at the system level 20 min Closing Debrief
  • 63. Strategic Systems: Examples of Transformation In Action 62 Denver, CO Lawrence, MA
  • 64. Denver timeline 63 Standards Teaching School Design Leadership School Support Funding Partners 2008-11 Enabling Conditions 2012-14 Empowering Schools 2015-16+ Continued Growth
  • 65. Denver: Summary of actions 64
  • 66. Denver: Summary of actions 65
  • 67. Denver: Summary of results 66 Proficiency 2004 2014 ∆ ELA proficiency 24% 47% +23 pts Math proficiency 45% 54% +9 pts Graduation Rate 2010 2016 ∆ HS graduation 54% 67.2% +13.2 pts
  • 68. Lawrence timeline 67 Standards Teaching School Design Leadership School Support Funding Partners Spring 2012 Actions with immediate impact 2012-13 Targeted supports Enabling cond’ns 2013-14+ Empowering schools
  • 69. Lawrence: Summary of actions 68
  • 70. Lawrence: Summary of results 69 Success metric 2011 2014 Change Math proficiency 28% 41% +13 pts ELA proficiency 41% 44% +3 pts SGP: Math 39% 57% +18 pts SGP: ELA 45% 52% +7 pts HS graduation 52% 61% (2013) +9 pts Exceed state average
  • 71. Digging into the Denver and Lawrence cases Take 10 minutes to review how one district has approached its transformation. Then, share what you learned with a colleague (5 min each), addressing the following questions: 1. In your view, what was the most important decision/s the district made? Why? 2. What did you like most about the choices the district made? What did you like least? 3. What feedback would you give Tom or Jeff based on what you have observed? 70
  • 72. Applying lessons in your context Reflect individually and consider: 1. What would you tell your superintendent/state leadership about the Denver and Lawrence case examples? 2. District/CMO: What do these cases imply about the trajectory your district/ CMO is on – both what makes sense and what the district’s/CMO’s leadership team might want to re-consider? 3. State: What do these cases imply about your support of districts – both those in turnaround and those working to make incremental, strategic change? 71
  • 73. 72 Agenda Time Topic 55 min Introductions and Setting the stage What we heard from you, and how it shaped our goals and agenda Why resource strategy matters 40 min System 2020 How we think about resource use and school system transformation 30 min Lunch 15 min Connecting to Oakland: Informing Equity 45 min Strategic Systems in Action Denver, CO and Lawrence, MA Case Studies 20 min School Support The role district leaders play in ensuring schools are set up for success 15 min Break 90 min Investing in Innovation and Evaluating Strategies Impact modeling and Budget Hold ’Em for Districts: Making real-life tradeoffs to drive success at the system level 20 min Closing Debrief
  • 74. In one word, how would you describe the relationship between school leaders and the central office in your district?
  • 75.
  • 76. Principals in most districts do not rate central office support highly 75 12% 14% 19% 24% 21% 9% 18% 17% 29% 31%26% 34% 31% 29% 28% 30% 25% 17% 13% 14%24% 9% 16% 5% 5% Staff evaluation Budget Hiring Curriculum and Instruction Professional Development Q: On a scale of 1 to 5, with 1 being “Very Poor” and 5 being “Excellent,” how would you describe the quality of support you receive from your district’s central office in the following areas? 5 4 3 2 1 Average 3.5 3.0 2.9 2.5 2.5 Source: ERS Survey of Principals, 2014
  • 77. Principals seek more flexibility in many areas 76 Don’t have and don’t want (8) • Set base compensation and benefits • Contract with food service vendors • Contract with transportation partners Don’t have but want (26) • Hire non-instructional staff • Determine how many gen ed teachers are placed at the school • Eliminate a position based on school needs • Exit staff based on philosophy, commitment or team contribution • Hire/allocate social/emotional positions • Set student assessment schedule • Choose student assessment instruments Have and want to keep (6) • Screen general education teachers for fit and qualification • Assign teachers to leadership positions • Final say on which teachers to hire Have but don’t want (0) Bulleted items are a sub-set of flexibilities in the category. Have/want based on at least 50% of principals surveyed answering that they have and/or want the autonomy Source: Principal survey, ERS analysis Of 40 flexibilities tested in the context of improving student learning, at least half of school leaders say they…
  • 78. Empowering principals with high-leverage flexibility 77 Don’t have but want (26) • Hire non-instructional staff • Determine how many gen ed teachers are placed at the school • Eliminate a position based on school needs • Exit staff based on philosophy, commitment or team contribution • Hire/allocate social/emotional positions • Set student assessment schedule • Choose student assessment instruments Bulleted items are a sub-set of flexibilities in the category. Have/want based on at least 50% of principals surveyed answering that they have and/or want the autonomy Source: Principal survey, ERS analysis  Why do principals want these flexibilities?  What can we do to empower principals in these areas?  If we can’t provide these flexibilities, what’s the root cause? What’s the workaround?
  • 79. Why focus on improving the quality of school support?  Perceptions of central office support correlate with principals’ likelihood to stay in the system  Especially in systems where rules around flexibility vary, district leaders must ensure that each school is making the most of the resources they have  Mistrust between school and district leaders distracts from everyone’s ability to do what’s best for our students 78 Retention Equity Impact
  • 80. Without a strong central office partnership, schools are unable to realize their full potential 79 Data/ Reports Process Policies/ Accountabilities Tools Expertise/ Illustrations StrategicFunctional The right information Clear and understood Limited to requirements User- friendly Compliance- focused Benchmark against best practices Design & needs driven Aligned with school accountability system Push thinking School design focused How strategic district leaders can better support principals Note that Functional and Strategic are distinct dimensions - it is entirely possible that you are neither, both, some of each, etc.
  • 81. Self-Assessment: How can district leaders best support principals? Consider the functional area you have direct responsibility for or the district’s/ CMO’s support to principals overall (up to you on where you want to focus) - State Fellows, think of a district in your states or your support of districts overall: 1. What is one of your bright spots? What examples can you cite within the framework of effective functional and/or strategic support to school leaders? 2. What is one of your biggest gaps? What current structures, teams, processes are furthest from being strategic? 3. What is one barrier to improvement? What is preventing/will prevent improvement in the area(s) you cite as having the biggest gaps? 4. What is one opportunity for improvement? What can you or your system/CMO/state readily do that will enable more strategic support to school leaders? 80
  • 83. 82 Agenda Time Topic 55 min Introductions and Setting the stage What we heard from you, and how it shaped our goals and agenda Why resource strategy matters 40 min System 2020 How we think about resource use and school system transformation 30 min Lunch 15 min Connecting to Oakland: Informing Equity 45 min Strategic Systems in Action Denver, CO and Lawrence, MA Case Studies 20 min School Support The role district leaders play in ensuring schools are set up for success 15 min Break 90 min Investing in Innovation and Evaluating Strategies Impact modeling and Budget Hold ’Em for Districts: Making real-life tradeoffs to drive success at the system level 20 min Closing Debrief
  • 85. Impact modeling is an ERS R&D initiative that helps connect actions to student outcome goals districts are setting  Help make the case to district leaders for actions that will have the most impact on students by  Illustrating the relative impact and cost of different actions  Drawing attention to the magnitude of effort needed to accomplish goals  Translating research for practitioners and district context  Help District leaders build stronger plans to achieve their goals that take a holistic approach to improvement 84
  • 86. Broadly, how we are thinking about this…  What change is the district trying to accomplish?  What are goals around student outcomes?  What improvement is necessary to meet those goals?  How does this compare to what other districts have accomplished?  To what extent are district initiatives likely to contribute to meeting its goals?  Detailed: Impact Model, a customized tool that models out the potential impact of different actions  High level: Budget Hold’em, an interactive exercise that helps district leaders and stakeholders explore tradeoffs in building budgets to help all students succeed 85
  • 87. How is this work different from currently available research/modeling? 86 Other Research/Modeling Our Modeling  Targeted at academics and practitioners with a deep understanding of research methods  Targeted at practitioners and policymakers regardless of understanding of research methods  One action/intervention in isolation  Combinations of actions  Requires translation to context  Uses district specific data to estimate in their context (e.g. student mobility, effectiveness of new hires)  Scenarios that aren’t always realistic or scalable (e.g. The average student impact of permanently removing teachers below a 5th or 10th percentile cutoff from the current workforce and the hiring pool Hanushek, 2009)  Scenarios customized to represent scenarios more likely to occur (e.g. increase attrition among bottom 10 percentile of teachers)
  • 88. We estimate district-wide impact by “spreading out” student-level effects observed in research 87 Improvement initiative Per student effect size (SD*) % of all Students Impacted Districtwide Impact (SD) Workforce Management 0.30 6% 0.02 Tutoring 0.21 7% 0.01 How does this translate to strategies implemented across the district? District-Wide impact depends on the # of students affected, as well as the effect size. Where do we get effect sizes? Peer-reviewed research Experimental/Quasi-experimental Meta-analysis where available otherwise individual studies *SD: Standard Deviation
  • 89. Our methodology allows us to estimate the impact of interventions targeted to different groups of students, such as by school and performance level 0.21 0.16 - - - 0.14 0.11 0.07 0.05 0.02 0.12 0.11 0.07 0.05 0.03 0.09 0.05 0.02 0.00 0.00 - 0.10 0.20 0.30 0.40 0.50 0.60 0.70 0.80 Lvl 1 Lvl 2 Lvl 3 Lvl 4 Lvl 5 StudentPerformanceImprovement(SD) Student Performance Level Small Group Tutoring Reduce Class size to 15 Extend School Day by 60 min Add Pre-K 88 Strategy Cost ($M) Implement small group tutoring of 8:1 for Lvl 1 and 2 students in C,D and F schools $2.5 Reduce 3rd grade class size from 18 to 15 in C, D, F schools $5.0 Extend school day by 60 minutes to additional C,D,F schools $2.0 Add 20% Pre-K seats, focusing on FRL and ELL kids $7.9 Sub-total Stu. Perf Improv. 0.56 0.43 0.17 0.10 0.05 Source: ERS analysis.
  • 90. The result is typically aggregated measures of student performance and teacher effectiveness 89 -1.6 -1.4 -1.2 -1.0 -0.8 -0.6 -0.4 -0.2 0.0 Year 0 Year 1 Year 2 Year 3 Year 4 Year 5 Year 6 Year 7 Year 8 Year 9 Year 10 DistancefromMathProficiency(SD) Proficiency Gains for Lowest-Performing Students Baseline Intervention 56% 59% 0% 10% 20% 30% 40% 50% 60% 70% 80% 90% 100% Year 0 Year 1 Year 2 Year 3 Year 4 Year 5 Year 6 Year 7 Year 8 Year 9 Year 10 District-wide Change in Math Proficiency Rates over Time Intervention Baseline
  • 91. Where we are in this work…  Proof of concept model using Python: models out changes in, e.g., teacher retention/attrition and small- group instruction (Complete)  Adding 1-2 additional interventions over the next several months (Not started)  Sensitivity analysis: How does the quality of the teacher pipeline impact the efficacy of strategic retention/attrition? (In Progress)  Learning from others who have related expertise, or are working on similar problems (In Progress) 90
  • 92. Therefore, for the foreseeable future, system leaders should… 1. Ensure “Impact/Return on Investment” mindset for decision-makers:  Clear on the “logic model” and expected impact of investments, including synergy among initiatives  Focused on maximizing returns across functions v. within  Committed to monitoring results and adapting based on data 2. Ensure budget development processes span departmental boundaries and include structural costs/strategies 3. Invest in data collection and analysis opportunistically to inform discussion of strategic options 91
  • 93.
  • 94. Goal of this exercise: Help District X use its limited resources strategically to improve student achievement and meet our goals. 1. Identify the core needs 2. Consider broad range of investment and savings options 3. Weigh investment and savings options 4. Make coordinated, strategic investment and savings decisions that drive student performance improvement 93
  • 95.  Create a “hand” of impact and savings cards that represents a new budget for District X  Your hand must meet the district’s priorities (see handout)  Your hand must achieve a cost neutral status and improve student achievement 94 The Object of the Game
  • 96. Add 60 min of learning time to the school day in the 25% lowest performing schools Extended learning time can raise student achievement if it is targeted on core instruction with high quality teachers who are expert in critical subject and instructional areas. 1.7% Student impact points Investment (+) or Savings (-) as % of budget Explanation Note: Extending learning time can be costly. Ensure that the schools in which you invest have leaders and teaching staff who can deliver high quality instruction to struggling students. Note There are also wild cards that let you add more savings or investment options.Turnaround schools Some cards can have stronger impact when played together Time+ What’s a Hold’em card?
  • 97. Things to consider  Select cards thoughtfully – consider your priorities  Consider inter-relationships between cards and try to get those bonus points  Acknowledge approximation  Be bold  Consider different staffing allocations  Use Wild Cards  Have fun! 96
  • 99. Directions: 98 Step 2 1 min Choose someone to read the cards and someone to record decisions online Step 3 45 min The card reader will read the cards aloud (just the title and description), and your group will collectively sort them into Yes and No piles. Try to reach consensus, but if you can’t, put it in a Maybe pile Step 4 15 min After your first pass, go back through your Maybe pile and make changes in order to reach your target. Calculate your budget and student impact. Step 5 2 min Take stock: Consider the expected performance outcomes of your choices – are you maximizing impact given resource limitations and district priorities? Step 1 5 min Read the District X fact sheet individually. Note priorities and challenges. Online Scoring Instructions 1. Go to: erstrategies.org/scoresheet 2. Enter your team’s “Access Token” (on your table) 3. Enter decisions as you go (it will recalculate your budget % each time)
  • 101. Discussion questions 100 1. What were the biggest insights and/or surprises in your choices? 2. Which options are off the table or challenging, but promising, interesting, or important? What must change to make them a real option? 3. How did this exercise influence your thinking on: a. How to improve outcomes with limited resources? b. The use of impact data for leadership decision-making?
  • 102. 101 Agenda Time Topic 55 min Introductions and Setting the stage What we heard from you, and how it shaped our goals and agenda Why resource strategy matters 40 min System 2020 How we think about resource use and school system transformation 30 min Lunch 15 min Connecting to Oakland: Informing Equity 45 min Strategic Systems in Action Denver, CO and Lawrence, MA Case Studies 20 min School Support The role district leaders play in ensuring schools are set up for success 15 min Break 90 min Investing in Innovation and Evaluating Strategies Impact modeling and Budget Hold ’Em for Districts: Making real-life tradeoffs to drive success at the system level 20 min Closing Debrief
  • 103. Guiding questions – from up on the balcony 1. What is my district’s/CMO’s overall resource picture with regard to strategic vs. non-strategic use? 2. What process does my district/CMO use for making resource decisions? How can I influence that process? 3. What aspects of resource use do I control? How can I have the most impact with the control I have? 4. What will I do when I get back to work? Districts and CMOs
  • 104. Guiding questions – from up on the balcony 1. What state policies or practices are intended to support districts’ strategic resource use? How well do they currently accomplish that aim? 2. What tools/supports/data does my state offer districts to support their resource decision-making? 3. How can I influence the policies/tools/etc. within my control and support their effective use? How can I have the most impact with the control I have? 4. What will I do when I get back to work? States
  • 105. Resources for SSLF available on the ERS website! https://www.erstrategies.org/tap/school_systems_leaders_ fellowship_resources 104 Wednesday, February 14, 2018

Hinweis der Redaktion

  1. Talking points: 1. Speak to the fact there will be 1 break throughout the time (15 min to allow for Hold’em setup – they should log into scoresheets)
  2. Use this time for Fellows to do brief intros too
  3. Note: The question they answered when submitting these comments was: “Given any learnings or reflections from completing ERS’s Resource Check assessment and exploring the ERS website, what questions or issues would you most like to explore during our session on strategic resource use?” These quotes are a mix of verbatim responses and other responses that I turned into questions for the sake of this conversation.
  4. Note: The majority of the comments in the survey were about prioritization and decision making. We could have had several slides dedicated to just that, but these represent the key themes we heard.
  5. Things to hit on: The “!” represents areas of opportunity across this group, while the “thumbs up” highlight your collective strengths We’re going to look a layer deeper at School Design and School Support, as those are going to be a big focus of our time together today NOTE! This slide should be quick – the next slide is 20 min of time.
  6. Notes: The yellow arrow indicates where to focus discussion Ordering on screen may not match print out = these are sorted for easier review side by side These data includes everyone who submitted to the group, plus those where we were able to find responses. The important thing is that Fellows are able to reference their own reports during the discussion. Facilitation: 20 min total ( could cut this time down to 10 min by looking at fewer Qs or cutting table discussion and focusing on whole-group) Beginning with the School Design Q (then discuss, and repeat this process with School Support Qs) 5 min: At your table: Someone who shared “Agree” or “Strongly Agree” – Share your reflection on what your CMO, State, or District are doing that led you to select that level. What strengths can you share with the table? On the other end, where do you see an opportunity to improve – for anyone that didn’t select the top rating? Or, what question do you have for the group that we should capture to talk to today? 5 min: Group discussion: Popcorn out a strength you heard from someone at your table Popcorn out a question you have about School Design To do: Joe facilitating, so Joy to write these Strengths and Questions on two posters to reflect back on throughout the day Goal: Capture their reflections to use to refer back to as it makes sense throughout the day rather than using this one slide to go super deep on any specific concepts 5 min: At your table - Repeat table and group discussion for School Support 5 min: Group discussion and popcorn
  7. Why? Rights to Education Movement & growth of categorical programs… Gen Ed class sizes haven’t changed much at all… The Adequacy Movement: How much should we spend on education? And should courts decide? (ex: Michael Rebell: NY’s $6B man)
  8. When we look across spending across districts, we see that spending varies widely. These are a sample of the districts we have worked with. These are geographically adjusted numbers, and so you’ve got Aldine spending $8K and Newark spending $21K. Anyone here from DC or Newark? You might think that the districts with more dollars are being way more strategic with those dollars, but what we tend to see, is that dollars are tied up in similar things across all districts and that some of the places where Newark and DC were spending more, weren’t the highest impact things. Ie. Newark and DC, spending tied up in benefits, small schools, and special ed… If someone asks, what about outcomes- What do you think? (one or two responses) Hold that thought
  9. Okay, we so what do districts spend their money on? We are going to take a pop quiz to find out. If you get all the answers right, you get the satisfaction of having a deep understanding of district finances 
  10. True or false, central admin consumes a large portion of district funding. Raise your hands for true/false
  11. Central office isn’t a large %. When people think about cutting they often think about central office but that will only get you so much. 30% central office reduction is just 2% of total budget…
  12. Question 2: what % of the budget does instruction go to? Show one finger for 1, 2 for 2, 3 for 3
  13. 50-60% Point here: 50-60% of budget is spent on instruction Another 5 is % is spent on instructional support and professional development (things like coaches, typical PD spending, etc.) These two things combined, that is really the budget that supts and CAOs can deeply influence. Through your decisions on class size mandates, how you support instruction, etc. This is what your decisions influence. Even if HR is making some of these decisions, it is still your responsibility to advocate for smart decisions in how teachers are compensated and developed…
  14. :
  15. 80-90% is personnel, so when we talk about making changes to resource use, we are implicitly talking about changes to peoples jobs. And this makes it really hard sometimes to make change. These are people who have dedicated lives to education and changes resource use may mean, in some cases, getting rid of jobs, or asking people to flex different muscles and take on new roles.
  16. Eric Hanushek at Stanford. Education researcher and economist.
  17. Okay so we mentioned that dollars go towards the wrong things, so let’s take a closer look at common misalignments
  18. In one analysis we did, we found that 40 cents on every dollar is going to things that research suggests are not correlated with student outcomes. So let’s dig into this a little more.
  19. There are two big buckets: Piecemeal investments- in order to make it work, we need to make three in parallel, but only doing one- will get to in a little bit)… underinvestment, making good decisions but just to an inconsequential degree. The opposite of that is investing in lots of things that go to wrong tings- when we think about wasteful spending, this is it. Non-strategic, yes its nice to have small class sizes but if doing in every single class for every kids, not the most strategic use of resources.
  20. This is an example of piecemeal investment. In Georgia we saw that all districts were giving additional time to struggling students in Math. However, when we looked at who was teaching the class, it was all novice teachers. And we know that in Math, that years of experience is correlated with improved effecetivenss. So they were making a massive investment (a period a day) but weren’t seeing results.
  21. SO WHAT DOES THIS MEAN FOR A WHAT A DISTRICT LEADER MUST KNOW DO AND ASK? So why do these misalignments persist? Well they don’t exist because people are malicious and don’t know what smart decisions would be. They exist because of perfectly rational reasons. You all have mentioned many of these already I want to highlight the bottom three: The decisions are tough, and require making decisions that affect people’s jobs (like we talked about) and this might be really hard to sell to the board or public. Right, it’s tough to say, hey maybe we should shift resources away from giving additional time to struggling students or to increase class sizes. And it’s even harder to do that if you don’t have a clear vision of what you are moving to. So what are we moving to?
  22. This slide starts blank and is a discussion prompt – why is it necessary? What challenges do we face today?
  23. Notes: There’s a corresponding set of questions for the state (on next slide) These are for sharing, not discussion or reflection at this point – we’ll come back to them Ultimately, the focus is to… First – understand what I like and don’t like about what we’re doing – how we’re investing our time people and money… Then…what can I do about this… Can I influence our decision-making process? Can I take action where I have control? What can I do on Monday? To be clear, we’re saying Monday/ASAP from the perspective of being biased toward action...that said, we’re also intending to share insight and foster your own thinking that may not be immediately actionable
  24. Notes: For the state, the guiding questions revolve around how well you are setup – with policies and practices – to support districts in strategic resource use
  25. Video length: 2 min 58 sec
  26. Talking point: These are three high-priority levers - We will talk through the first two today in some depth in the next 20 or so minutes For the third, I encourage you to visit the Fellows resource page – there’s some great resources there, including our most recent publication diving very deep into what we call Connected Professional Learning.
  27. Vertical axis = $pp at each school Horizontal axis = Student based “need index” – a weighted value ERS calculates based on the mix of special education, ELL, and economically disadvantaged students at the school QUESTION for participants: After looking for the relationship between spending and need, this look at the data can raise questions like… Why do two schools with the same need get very different funding? What’s driving that difference? (tees up drivers of funding variation slide next)
  28. Talking points: 1. Size of text here is intentional – Bigger font = bigger driver
  29. Level 1 students spend same % of day on core as level 3+ peers. In some cases, level 3+ students have even more time on core due to Foreign Language. Level 1 students have extra non-core instead of Foreign Language
  30. Answers: Flipped Learning Flexible Grouping Differentiated Class Size Block Scheduling
  31. Video length: 8 min 22 sec
  32. Talking point: Objective = Solidify the core tenants of a Strategic System by examining 2 districts who approached improvement work in different ways Divide into groups Re-skim your assigned case for 5 min to get head back into it
  33. Our understanding is that many of you were principals prior to your current role, so perhaps this will be a bit too familiar, but… In one word, how would you describe the relationship between school leaders and the central office in your district?
  34. We probably don’t need to belabor this point, and you may have your own take on it given your own experience, but we believe focusing on improving the quality of school support is grounded in three areas: Retention, equity, and impact So, how can this support play out? (intro to Support Framework slide)
  35. Facilitation: [5 min] Self reflection [10 min] Group discussion Take a poll to see, across the group, where their bright spot and gaps were. Raise your hand if you chose Data/ Reports as your biggest Bright Spot (tally #) – How many of you thought it was your Biggest Gap? (tally #) Repeat for each column To do: Joy to write on a poster paper the tally of responses Observe where the group is falling – Are there trends where folks see gaps or bright spots? Popcorn: Ask Fellows to share out their reflection on their opportunity for improvement In their share out, tell the group where they fell in Bright Spot vs. Biggest Gap, then go into opportunity (and barrier, if desired) To do: Joy to write on poster paper the opportunities
  36. Notes: Use this time to setup Hold’em materials and help folks log into scoresheets – they won’t need them for a little bit, but it’s best to try to access them now vs. later Fellows will be playing in teams at their current tables (a mixed conversation will be beneficial for sharing perspectives across CMO-District-State)
  37. Notes: Yes, more cats, since that’s all that’s on the internet Use this slide to explain what we mean by “impact” and “modeling” as a transition into its purpose on the next slide
  38. Introduce some interesting
  39. Tutoring can be targeted more than workforce management. . .
  40. So the 0.21 from the last slide is translated in the light blue bar on the chart here. (For clarity’s sake, we’ve assumed that there are no level 1 students in A and B schools. . ., while there are some level 2 students in those schools.)
  41. So important to avoid the “lasagna” of initiatives Use of ROI analysis for school systems is alluring, hard & imperfect ROI analysis cannot drive decision-making Instead, leaders must make judgments about the best use of their limited resources driven by an ROI mindset, informed by ROI analysis and qualitative discussions
  42. Note: Fellows will be playing in teams at their current tables (a mixed conversation will be beneficial for sharing perspectives across CMO-District-State)
  43. Therefore, The object of the game is to create a “hand” of investments and savings cards that help District X meets its target budget (some of your are cost neutral and some of you are operating in a budget deficit) while STILL moving towards improved district performance. So in other words, you have to weigh the potential investments you want to make against the savings you’ll need to make to pay for them. At the end of the game, you need to have a subset of cards where the numbers at the top – the saving/investment amounts – net to District X goal You must also improve student achievement (ideally by 5 impact arrows) we’ll explain what we mean in a moment
  44. So, how does Hold’em work? Each card in the deck shows a category in the upper middle part of the deck with a description of a decision. Detail about the rationale for the decision is in italics below, as well as any specific concerns that you might want to consider. On the upper right hand side is the percentage of the budget that will be saved or invested as a result of the decision. We approximated these numbers based on the typical data that we’ve seen in school districts around the country. On the upper left hand side, we have impact on student achievement. These are estimates based on research supported effect sizes for various interventions. So, you’ll want to achieve at least 5 impact arrows. We ask that you don’t get caught up in the number and instead focus more on the MAGNITUDE of decisions. Cards will have a different impacts on the budget, and we want you to understand the RELATIVE difference across scenarios: one decision might save you only point two percent and another could save you a full 1 percent. Also, I want to add Hold’em can be more than just a game. For a district that wants to be more precise, they can re-calculate these scenarios and the budget percentages to fit their specific budget. Memphis Public Schools, for example, had great success using Hold’em has part of their budget planning process.
  45. Select cards thoughtfully– not all the choices are strategic; larger hands mean more initiatives in place; some choices might reduce budget but won’t improve stu perf Consider inter-relationships – Some cards work better when paired with others. So for some cards, we’ve created bundles, meaning you get extra student impact points if you play them together. For example: Accept approximation – The budget percentages are estimates based on ERS’ work in urban districts over the past 15 years. They are averages and include high-level assumptions. They are meant to be directionally correct. Districts are more than welcome to substitute their own estimates, but for those non-district groups we’ve found that these estimates work well. Be bold – Don’t avoid a card for fear of feasibility in the real world. A controversial choice may be difficult to implement but well worth the effort in the improvement it can create. And, of course, discussion of the “hard choices” is a key objective of the exercise. Don’t avoid staffing cuts – Most districts will not be able to reach budget reduction targets without reducing staff. As you may recall from earlier in today’s discussion, personnel costs are typically 80-90% of district budgets. Key is to try to choose the staff reduction options that move toward transformation & support overall priorities. Use Wild Cards – The card deck includes 5 wild cards. If you have a district priority not found in the Hold’em cards, consider estimating its costs and benefits on a wild card. Remember the value is in discussion, so getting the cost or benefit estimate exactly accurate is not a big priority.
  46. Facilitator’s Notes:  Ideal discussion is as a group, for 5 min (which will lead into broader, deeper reflection on the day next) If they are quieter or it doesn’t look like anyone will volunteer readily, begin this with a Think-Pair-Share Choose one of these questions and take one minute to answer silently. Write your answer down. Then, at your tables, share what you’ve written. Then, we’ll come together as a full group to share out together. Potential Pitfalls: Watch out for piling all sorts of diff stuff. Almost all of these have significant impacts on lives of principals – are we really setting them up for success. Many Area Supt’s (princ supervisors) think of their jobs as protecting principals from central…making resource allocation and strategy decisions centrally without deep consideration of implementation impact on school leaders is an example of why. Coherence with system strategy & theory of action: Consider not just what the changes mean for school leaders’ ability to implement, but also about what your theory of action is around the role of schools and central and school autonomy. Are you going to prescribe that all schools implement some specific change like double-blocking? Or are you going to create the enabling conditions tools & supports for schools to differentiate time & attention in ways that make the most sense or them? The processes that most systems use to make budget decisions tend to result in top-down thinking – and that runs counter to how a lot of districts are now thinking about their school portfolio and school autonomy. So think about what you wan to tell your CFO about what you see as the requirements of a strong budget development process. The best budget development conversations are actually academic strategy conversations at their core [cite example of a convo is this group about merits of double-blocking, extending time, etc.). So think about what that means for who you want leading the budget decision-making v. facilitating the budget process (hint: not necessarily the same folks)
  47. Facilitation: (Guiding Q slides to be printed) [5 min] Self-reflection (on these [6 min – 3 min each] Pair-share OPTIONAL: State folks listen in to district/CMO reflections and needs, with an ear toward what you can take away as to how your state could support a district/CMO like them [5 min] Popcorn out [4 min] Joe’s closing summary – Reflection on the day and closing thoughts based on what you heard here and reflecting back on the posters where you took down notes from the Resource Check conversation Also remind them about the resources for them on our website! (See final slide) Notes: There’s a corresponding set of questions for the state (on next slide) These are for sharing, not discussion or reflection at this point – we’ll come back to them Ultimately, the focus is to… First – understand what I like and don’t like about what we’re doing – how we’re investing our time people and money… Then…what can I do about this… Can I influence our decision-making process? Can I take action where I have control? What can I do on Monday? To be clear, we’re saying when I “get back to work” ASAP from the perspective of being biased toward action...that said, we’re also intending to share insight and foster your own thinking that may not be immediately actionable
  48. Notes: For the state, the guiding questions revolve around how well you are setup – with policies and practices – to support districts in strategic resource use