1. Former EMBS students
QUALITY MANAGEMENT
Exercises E
PROBLEMS
1. Management is concerned that workers create more product defects at the very
beginning and end of a work shift than at other times of their eight hour workday.
Construct a scatter diagram with the following data, collected last week. Is
management justified in its belief?
Products defects
Hours of work Number of defects
MONDAY TUESDAY WEDNESDAY THURSDAY FRIDAY
1 12 9 6 8 7
2 6 5 3 4 5
3 5 2 4 3 3
4 4 0 5 2 3
5 1 6 2 4 5
6 4 3 3 2 1
7 7 4 4 6 3
8 5 7 8 5 9
Total defects 44 36 35 34 31
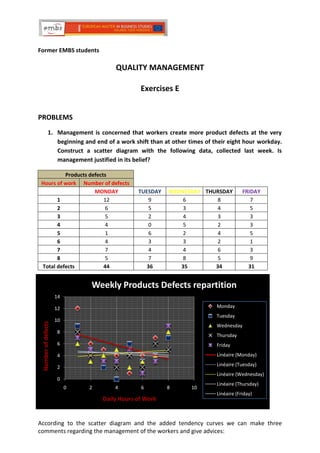
Weekly Products Defects repartition
14
12 Monday
Tuesday
10
Number of defects
Wednesday
8
Thursday
6 Friday
4 Linéaire (Monday)
Linéaire (Tuesday)
2
Linéaire (Wednesday)
0
Linéaire (Thursday)
0 2 4 6 8 10
Linéaire (Friday)
Daily Hours of Work
According to the scatter diagram and the added tendency curves we can make three
comments regarding the management of the workers and give advices:
2. -Anyway we can see that especially on Monday and in general when we look at the points
directly on the graph, that it is during the morning that the highest numbers of products
defects are realized and the less at half of the working day.
-Nevertheless the point all together are representing a U curve and are representing the fact
that in the mornings and evenings but in less proportion, are the period of time when the
most of the products defects are realized and the less during the mid-time working hours.
So clearly the belief is justified that the defects are creating during beginning and ending
working hours every day and also at the beginning and at the end of the week .(the highest
point on the graph of the first working hour is on Monday and the highest point on the graph
for the 8th working hour is on Friday).
-The managing department should focus on the day of Monday because it is during this day
that the more defect are producing comparing with all the other days of the week.
-Focus their action of management during the beginning the working days and then on the
ending periods.
3. 2. Perform a Pareto analysis on the following information:
Reason for unsatisfying stay at hotel Frequency
Unfriendly staff 6
Room not clean 2
Room not ready at check-in 3
No towels at pool 33
No blanket for pull-out sofa 4
Pool water too cold 3
Breakfast of poor quality 16
Elevator too slow or not working 23
Took too long to register 7
Bill incorrect 3
Total 100
Pareto analysis definition:
Pareto principle states that only a “vital few” factors are responsive for producing most of
the problems. This principle can be applied to quality improvement to extent that a great
majority of problem (80%) are produced by a few key causes (20%). If we correct these few
causes, we will have a greater probability of success.
Perform a Pareto analysis:
Analysis:
Here we see that 20% of the causes:
- No towel at pool;
- Elevators too slow or not working;
- Breakfast of poor quality;
are responsible of almost 80% of quality issues.
A large majority of the problems(80%), are produced by a few key causes (20%) which are
those three.
So in this configuration the quality manager should focus primarily on those three tasks.
4. Question 5: Perform a cause-and-effect diagram
Definition
A graphic tool used to explore and display opinion about sources of variation in a process.
(Also called a Cause-and-Effect or Fishbone Diagram.)
Purpose
To arrive at a few key sources that contributes most significantly to the problem being
examined. These sources are then targeted for improvement. The diagram also illustrates
the relationships among the wide variety of possible contributors to the effect.
The basic concept in the Cause-and-Effect diagram is that the name of a basic problem of
interest is entered at the right of the diagram at the end of the main "bone". The main
possible causes of the problem (the effect) are drawn as bones off of the main backbone.
The "Four-M" categories are typically used as a starting point: "Materials", "Machines",
"Manpower", and "Methods". Different names can be chosen to suit the problem at hand,
or these general categories can be revised. The key is to have three to six main categories
that encompass all possible influences. Brainstorming is typically done to add possible
causes to the main "bones" and more specific causes to the "bones" on the main "bones".
This subdivision into ever increasing specificity continues as long as the problem areas can
be further subdivided. The practical maximum depth of this tree is usually about four or five
levels. When the fishbone is complete, one has a rather complete picture of all the
possibilities about what could be the root cause for the designated problem.
The Cause-and-Effect diagram can be used by individuals or teams; probably most effectively
by a group. A typical utilization is the drawing of a diagram on a blackboard by a team leader
who first presents the main problem and asks for assistance from the group to determine
the main causes which are subsequently drawn on the board as the main bones of the
diagram. The team assists by making suggestions and, eventually, the entire cause and effect
diagram is filled out. Once the entire fishbone is complete, team discussion takes place to
decide what are the most likely root causes of the problem. These causes are circled to
indicate items that should be acted upon, and the use of the tool is complete.
The Ishikawa diagram, like most quality tools, is a visualization and knowledge organization
tool. Simply collecting the ideas of a group in a systematic way facilitates the understanding
and ultimate diagnosis of the problem. Several computer tools have been created for
assisting in creating Ishikawa diagrams. A tool created by the Japanese Union of Scientists
and Engineers (JUSE) provides a rather rigid tool with a limited number of bones. Other
similar tools can be created using various commercial tools.
Only one tool has been created that adds computer analysis to the fishbone. Bourne et al.
(1991) reported using Dempster-Shafer theory (Shafer and Logan, 1987) to systematically
organize the beliefs about the various causes that contribute to the main problem. Based on
the idea that the main problem has a total belief of one, each remaining bone has a belief
assigned to it based on several factors; these include the history of problems of a given
bone, events and their causal relationship to the bone, and the belief of the user of the tool
about the likelihood that any particular bone is the cause of the problem.
5. How to Construct:
Place the main problem under investigation in a box on the right.
Have the team generate and clarify all the potential sources of variation.
Use an affinity diagram to sort the process variables into naturally related groups.
The labels of these groups are the names for the major bones on the Ishikawa
diagram.
Place the process variables on the appropriate bones of the Ishikawa diagram.
Combine each bone in turn, insuring that the process variables are specific,
measurable, and controllable. If they are not, branch or "explode" the process
variables until the ends of the branches are specific, measurable, and controllable.
Environment (place) Service (method)
General presentation of the place Reactive
Cleanness Welcoming
Clarity Polite
Dissatisfied customer
of wedding reception
caterer
Staff (Wokring force) Food and beverage (material) Tools
Motivated Choice Dishes
Smilling Quality Cleaness
Nice Taste
Decoration
Variety
6. 6. A refrigeration and heating company—one that installs and repairs home central
air and heating systems—has asked your advice on how to analyze their service
quality. They have logged customer complaints. Here's a recent sampling. Use the
supplied template to construct a conventional cause-and-effect diagram. Place
each of the complaints onto a main cause; justify your choice with a brief comment
as necessary.
First, the sampling is considered in the cause-and-effect diagram, as follows:
Customers' complaints Associated Reference in the
number diagram
1. "I was overcharged—your labour rates are too high." 1 Overcharging labour
rates
2. "The repairman left trash where he was working." 2 Trash after leaving
3. "You weren't here when you said you would be. You should 3 Delay without
call when you must be late." communication
4. "Your repairman smoked in my house." 4 Smocking employee
5. "The part you installed is not as good as the factory 5 Quality default of
original." the material
6. "Your repairman was here for over two hours, but he 6 Un-seriousness of
wasn't taking his work seriously." the employee
7. "You didn't tighten some of the fittings properly—the 7 Imprecision of the
system's leaking." repair
8. "Your estimate of repair costs was WAY off." 8 Inappropriate cost
estimation
9. "I called you to do an annual inspection, but you've done 9 Un-respect of
more—work that I didn't authorize." contract
10. "Your mechanic is just changing parts—he doesn't have a 10 Bad knowledge of
clue what's really wrong." employee
11. "Your bill has only a total—I wanted to see detail billing." 11 Lack of transparency
in the bill
12. "Your testing equipment isn't very new—are you sure 12 Oldness of testing
you've diagnosed the problem?" equipment
13. "One of the workmen tracked mud into my living room." 13 Uncleanness of
employee
7. The cause-and-effect diagram
PERSONNEL: MATERIALS:
10. Bad knowledge of employee
2. Trash after leaving 12. Oldness of testing equipment
4. Smocking employee
6. Un-seriousness of the employee
13. Uncleanness of employee
PROBLEM / ISSUE:
Dissatisfied customer
of refrigeration and
heating company's
service
PROCEDURES: EQUIPMENT:
1. Overcharging labor rates 5. Quality default of the material
3. Delay without communication 7. Imprecision of the repair
8. Inappropriate cost estimation
9. Un-respect of contract
11. Lack of transparency in the bill
PERSONNEL:
On my opinion, the personnel category gathers all the problems which are caused directly by
a human behavior such as: the employee who left trash after working, the one who smoked
while working, the un-seriousness of one, and the one who was not clean. All of these
problems are related to a personal mistake of an employee in his relation with the customer,
and which deals with unprofessional consciousness.
MATERIALS:
The materials category concerns: the bad knowledge of an employee and the oldness of
testing equipment. The knowledge of the company’s employee and his tools are the two key
materials this service requires. The material is necessary to provide the service; this is a
mean to provide it, not an equipment delivered by the service.
PROCEDURES:
The procedures category includes: the overcharging of labor rates, the delay without
contacting the customer, the inappropriate cost estimation, the un-respect of contract with
the customer, and the lack of transparency in the bill. This is how the process, the service is
done. These problems are related to company failures in its procedures realization, to the
gap between the promised or desired service and delivered one.
EQUIPMENT:
The equipment category gathers: the quality default of a used material, and the imprecision
of the repair done by an employee. This concerns the availability of the technical part of the
provided service: the technical quality of a part, the quality of a repair, maintenance. This
deals directly with the equipment.