00 steo appendix energy price volatility and uncertainty 2009 sp 05
1. Energy Information Administration/Short-Term Energy Outlook Supplement — October 2009
1
October 2009
Short‐Term Energy Outlook Supplement:
Energy Price Volatility and Forecast Uncertainty1
Summary
It is often noted that energy prices are quite volatile, reflecting market participants’
adjustments to new information from physical energy markets and/or markets in energy-
related financial derivatives. Price volatility is an indication of the level of uncertainty,
or risk, in the market. This paper describes how markets price risk and how the market-
clearing process for risk transfer can be used to generate “price bands” around observed
futures prices for crude oil, natural gas, and other commodities. These bands provide a
quantitative measure of uncertainty regarding the range in which markets expect prices to
trade.
The Energy Information Administration’s (EIA) monthly Short-Term Energy Outlook
(STEO) publishes “base case” projections for a variety of energy prices that go out 12 to
24 months (every January the STEO forecast is extended through December of the
following year). EIA has recognized that all price forecasts are highly uncertain and has
described the uncertainty by identifying the market factors that may significantly move
prices away from their expected paths, such as economic growth, Organization of
Petroleum Exporting Countries (OPEC) behavior, geo-political events, and hurricanes.
However, these descriptions do not provide a quantitative measure of the range of
uncertainty regarding an expected future price. Nor do they indicate whether the
uncertainty has increased or decreased since the last forecast was published.
Beginning with the October 2009 issue, the STEO will publish confidence intervals for
crude oil and natural gas futures prices. A confidence interval is a range of prices
between a low and a high price, i.e., the confidence limits. The range of the confidence
interval is determined by the confidence level. The confidence level represents the
probability that the final market price for a particular futures contract, e.g., December
2010 crude oil, will fall somewhere within the lower and upper range of prices. For
1
Bob Ryan (robert.ryan@eia.doe.gov) and Dr. Tancred Lidderdale (tancred.lidderdale@eia.doe.gov).
For helpful comments and suggestions, the authors thank Dr. Robert Pindyck of the Massachusetts Institute
of Technology; Dr. George Jabbour of George Washington University; Dr. Zimin Lu of BP Energy
Company; Dr. Robert Biolsi of CME Group; James Colburn of MF Global; Dr. Stephanie Curcuru and Dr.
Charles P. Thomas of the Federal Reserve Board; Dr. Richard Newell, Dr. Howard Gruenspecht, Dr.
Margot Anderson, Dr. Carol Joyce Blumberg, Dr. Richard Yan, Douglas MacIntyre, Dr. Tyler Hodge, Kobi
Platt, Alex King, Ruey-Pyng Lu, and Dr. Thomas Lee of EIA; and Kara Callahan of Onlocation/Energy
Systems Consulting.
2. Energy Information Administration/Short-Term Energy Outlook Supplement — October 2009
2
example, if a confidence level of 95 percent is specified, then a range of prices can be
estimated for any future month within which there is a 95-percent probability the price of
the commodity in the expired contract’s delivery month will fall within that range. The
higher the specified confidence level, the wider the range between the lower and upper
confidence limits.
Confidence intervals for expected prices can be calculated using a variety of alternative
techniques, including estimates based on past price volatility, statistical analysis of past
forecast errors, or estimates of parameter uncertainty in an econometric energy price
forecasting equation. Such backward-looking approaches, notwithstanding their merits,
cannot reflect changes in current market conditions and expectations that may lead to
greater or lesser uncertainty about the future at any given time.
The STEO will instead focus on a measure of uncertainty derived from the New York
Mercantile Exchange (NYMEX) light sweet crude oil options and natural gas options
markets. EIA will derive confidence intervals around expected futures prices using the
“implied volatilities” of these options. Implied volatility is nothing more than a standard
deviation for expected returns embedded in the option’s price. If an option’s price is
observed in the market, then a pricing model can be “run backwards” to calculate the
volatility embedded in that price. This represents a market-cleared estimate of implied
volatility, i.e., a buyer and seller have agreed on the value of an option. The advantage of
this method is that it produces an assessment of future price uncertainty based directly on
current market data and highly informed market participants’ expectations. This
approach is used by the U.S. Federal Reserve Board and the Bank of England to assess
market uncertainty. Commercial banks also use implied volatilities to derive probability
estimates that market participants assign to different price outcomes. As an estimate of
risk, the use of implied volatility is well accepted in the financial literature.1
Based on our review of the relevant empirical literature, as summarized in the latter
sections of this report, EIA has determined that implied volatilities currently provide the
most useful estimate of the market’s expectation for the range in which prices likely will
trade. Therefore, EIA will use this method to generate its confidence intervals around the
NYMEX futures prices.
The markets represented by the NYMEX light, sweet crude oil and natural gas futures
prices are directly related to the markets represented by the STEO West Texas
Intermediate (WTI) crude oil and Henry Hub natural gas spot-price forecasts. However,
while the NYMEX and STEO prices are expected values for physical commodities
delivered to equivalent physical markets, and they generally are close, they are not
identical. The NYMEX price is a firm price at which delivery is made in the month
specified in the futures contract. The terminal NYMEX price at which all outstanding
futures contracts go to physical delivery is determined on the last day of trading for a
particular futures contract. Typically, this termination occurs in the calendar month
preceding the delivery month (e.g., the terminal futures price for December 2010 WTI
delivered to Cushing, OK, is determined on the last day of trading for that contract:
November 19, 2010.) The STEO forecasts are average daily spot prices expected in the
3. Energy Information Administration/Short-Term Energy Outlook Supplement — October 2009
3
actual delivery month (e.g., during December 2010). These daily prices are reported by
industry publications on a daily day-ahead basis during the delivery month (e.g., the
average natural gas price for Henry Hub, LA, for next-day delivery during the month of
December 2010). While both forecasts reflect delivered prices for the same commodity
at the same location, they are measuring expected prices over different pricing intervals.
Because the implied volatilities and confidence intervals derived from the NYMEX
options markets are derived from prices on the NYMEX futures and options markets, the
confidence intervals are presented in relation to the NYMEX futures prices and not the
STEO forecast price.
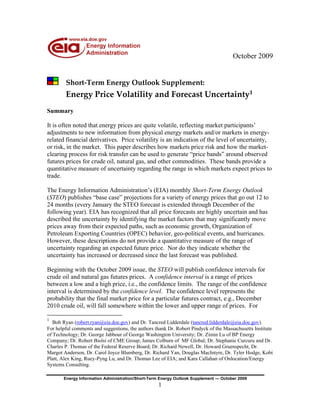
As shown in Figure 1, the implied volatility from options can imply a wide range of
future price uncertainty. For example, as of July 27, 2009, the 95-percent confidence
interval for the January 2010 WTI futures price ranged from $42 to $124 per barrel. At a
lower confidence level, the price band narrows, but even a 68-percent confidence interval
ranges from $55 to $95 per barrel. Moreover, confidence intervals typically widen as the
length of the forecast horizon grows. By July 2010, the 95-percent confidence interval
for the WTI price ranges from $38 to $152 per barrel.
In Figure 2, the 95-percent confidence interval for the January 2010 NYMEX Henry Hub
natural gas futures ranges from $2.93 and $10.69 per million Btu (MMBtu). The 68-
percent confidence interval ranges from $4.03 to $7.78 per MMBtu. By July 2010, the
95-percent confidence interval for the natural gas futures price ranges from $2.60 to
$13.00 per MMBtu.
Figure 1. NYMEX WTI oil futures price
with two confidence intervals
$20
$40
$60
$80
$100
$120
$140
$160
$180
Sep-09 Oct-09 Nov-09 Dec-09 Jan-10 Feb-10 Mar-10 Apr-10 May-10 Jun-10 Jul-10 Aug-10
Price($/bbl)
STEO NYMEX settle
68% CI lower limit 68% CI upper limit
95% CI lower limit 95% CI upper limit
Source: NYMEX.
Based on NYMEX average prices and implied volatilities, July 27-31, 2009.
Note: CI is abbreviation for Confidence Interval.
4. Energy Information Administration/Short-Term Energy Outlook Supplement — October 2009
4
Figure 2. NYMEX natural gas futures price
with two confidence intervals
$0.00
$2.00
$4.00
$6.00
$8.00
$10.00
$12.00
$14.00
$16.00
Sep-09 Oct-09 Nov-09 Dec-09 Jan-10 Feb-10 Mar-10 Apr-10 May-10 Jun-10 Jul-10 Aug-10
Price($/MMBtu)
STEO NYMEX settle
68% CI lower limit 68% CI upper limit
95% CI lower limit 95% CI upper limit
Source: NYMEX.
Based on NYMEX average prices and implied volatilities, July 27-31, 2009.
Note: CI is abbreviation for Confidence Interval.
The 95-percent confidence intervals for future oil and natural gas prices derived from
market data are quite wide, reflecting market participants’ view that prices can change
rapidly and cover a wide range in a short time interval. Additionally, realized prices at a
future date can, and often do, diverge significantly from prices at which futures contracts
for that delivery date are traded at earlier points in time. EIA believes that such
confidence intervals provide important insight into the uncertainty inherent in price
projections developed by EIA and other forecasting organizations, and provide a useful
context for evaluating forecast performance.
Section 1 of this paper provides a general background on commodity futures and options
markets, paying particular attention to the energy futures and options markets operated by
the NYMEX. Section 2 describes institutional features of these markets necessary to
understand the processes, procedures, and rules under which futures and options are
traded. Section 3 lays out how market participants offset their risks or take on exposures
via the trading process itself. Next, Section 4 examines the history of the analysis of
randomness, focusing in particular on random price behavior, which is necessary for an
understanding of the models employed to quantify the market’s risk assessments. Section
5 shows how EIA and other analysts calculate confidence intervals for energy commodity
prices, and then, Section 6 documents the parameters used to construct these measures.
Section 7 summarizes daily procedures EIA will use to map confidence intervals for
NYMEX energy futures. And, lastly, Section 8 outlines areas for future EIA research
5. Energy Information Administration/Short-Term Energy Outlook Supplement — October 2009
5
regarding confidence-interval estimation using market-derived parameters of expected
price distributions.
1. Background on Commodity Futures and Options Markets
Futures and options markets evolved to manage the risks associated with commodity-
price volatility. The earliest recorded instance of a formal futures market occurs in 1730
with the Dojima Rice Exchange in Osaka, Japan (Matao, 1999). These markets provide
producers, consumers, merchants, and speculators a risk-transfer mechanism in the form
of contracts for the future delivery of a physical commodity. Via the trading process,
futures markets continually process information from these agents, and reflect it back as a
price at which supply and demand clears the market.
The deepest, most liquid global markets for oil futures and options are the NYMEX light,
sweet crude oil markets. These markets comprise what is known colloquially in the oil
industry as the WTI market. Trading in WTI futures began on March 30, 1983, at
NYMEX. Options on WTI futures began trading November 14, 1986. The NYMEX
futures call for physical delivery of WTI in Cushing, Oklahoma. WTI is the benchmark
crude oil for the Americas, meaning most spot-, forward- and over-the-counter-market
transactions are priced on the basis of WTI prices discovered as a result of NYMEX
trading.
0
100,000
200,000
300,000
400,000
500,000
600,000
1983
1984
1985
1986
1987
1988
1989
1990
1991
1992
1993
1994
1995
1996
1997
1998
1999
2000
2001
2002
2003
2004
2005
2006
2007
2008
2009
Contracts/day(1,000bbl/Contract)
Average daily WTI option volume
Average daily WTI futures volume
Source: New York Mercantile Exchange, CME Group
(2009 is year-to-date to June)
Figure 3. NYMEX WTI
Futures and options volume
The WTI futures are the most actively traded physical commodity futures in the world.
Figure 3 shows that trading in NYMEX WTI futures during 2008 averaged more than
6. Energy Information Administration/Short-Term Energy Outlook Supplement — October 2009
6
500,000 contracts per day, which is equivalent to 500 million barrels of oil (each contract
is for 1,000 barrels). NYMEX options trading volume approached almost 140,000
contracts per day in 2008. Average daily NYMEX WTI futures volume in the January-
through-June 2009 period was 528,496 contracts. Options on WTI futures averaged
97,956 contracts per day over the same period.
NYMEX natural gas futures also are physical-delivery contracts, specifying delivery of
10,000 MMBtu of pipeline-quality natural gas per contract to the Henry Hub, Louisiana,
pipeline system. Natural gas futures began trading on NYMEX April 3, 1990. Options
on NYMEX natural gas futures began trading November 2, 1992. The NYMEX natural
gas futures contract is the benchmark for North American physical hub trading.
Contracts in the United States and Canada are traded on a “basis,” or price differential, to
NYMEX futures, with the basis depending on the location of a particular hub or trading
location.
Figure 4. NYMEX natural gas (Henry Hub)
Futures and options volume
0
20,000
40,000
60,000
80,000
100,000
120,000
140,000
160,000
180,000
1990
1991
1992
1993
1994
1995
1996
1997
1998
1999
2000
2001
2002
2003
2004
2005
2006
2007
2008
2009
Contracts/day(10,000MMBtu/Contract)
Average daily financially settled NG options volume
Average daily natural gas futures volume
Source: New York Mercantile Exchange, CME Group
(2009 is year-to-date to June)
In 2008 and the first half of 2009, trading in NYMEX natural gas futures averaged more
than 151,000 contracts per day (Figure 4). NYMEX natural gas options trading volume
averaged more than 6,500 contracts per day in 2008 and the first half of 2009, according
to the CME Group, parent company of the NYMEX. In the January-through-June 2009
period, an average 149,781 NYMEX natural gas futures contracts traded, while an
average 3,833 options that exercise into the underlying futures contract traded daily. The
deeper NYMEX financially settled natural gas options, launched August 15, 2005, traded
an average 110,365 contracts per day for the first six months of 2009 – almost 30 times
the daily volume of the option settling into a futures contract.2
The financially settled
7. Energy Information Administration/Short-Term Energy Outlook Supplement — October 2009
7
options’ terminal values are calculated using the underlying futures price settlement for
the business day prior to the futures final settlement date (i.e., penultimate settle).3
2. Institutional Features of Futures and Options Markets
The futures and options markets operated by the NYMEX are the most transparent and
accessible of the major trading venues for crude oil in the world. Other markets, i.e., the
over-the-counter financial markets, the spot and forward physical markets, while active,
do not have the high visibility of the exchange-traded futures and options contracts.4
U.S. futures exchanges like the NYMEX are self-regulatory organizations (SROs),
subject to Federal oversight by the Commodity Futures Trading Commission (CFTC).
Trading can be conducted via open-outcry on a trading floor at the exchange (wherein
buyers and sellers literally shout the prices at which they are willing to trade), or
electronically on platforms operated by the exchange.
Commodity futures traded on the NYMEX are binding legal obligations to make or take
delivery of a specific physical commodity at a particular date in the future. Every
element of the deliverable commodity is specified in the contract: grade and quality (e.g.,
light, sweet crude oil or pipeline-quality natural gas); volume (1,000 barrels per contract
for WTI; 10,000 MMBtu per contract for natural gas); timing and mode of delivery (via
pipeline during the delivery month); delivery location (Cushing, OK, or Henry Hub, LA);
force majeure events; pricing conventions (dollars and cents per barrel or per MMBtu);
and other terms and conditions specified by the Exchange. As the delivery month
approaches, the futures price and the spot-market price of the commodity converge. This
is due to arbitrage between the physical and financial markets. If futures prices are above
spot prices, market participants with access to physical supplies will buy oil to deliver
against the futures obligation, thus raising spot prices relative to futures, and vice versa.5
All contract terms are standardized except the price at which delivery occurs. Price is
determined via trading. After a deal is consummated, the exchange clearinghouse steps
in to become seller to all buyers and buyer to all sellers. Since the exchange is now a
party to the transaction, the clearinghouse requires collateral in the form of a performance
bond on every open contract. Failure to maintain this collateral results in liquidation of
the position.
Futures are “marked to market” daily, meaning the price of outstanding contracts at the
close of today’s trading session is compared to the previous session’s close. Gains and
losses are allocated by the clearinghouse among buyers and sellers, so that all collateral
accounts for open positions have been credited or debited appropriately based on changes
in position values that day. At the start of the next trading session, all gains and losses
will have been realized from the previous day, and a new trading session will begin. This
process will be repeated until positions are either liquidated (i.e., traded out of), the
contracts go to delivery, or are financially settled.
8. Energy Information Administration/Short-Term Energy Outlook Supplement — October 2009
8
Futures options also are legally binding contracts conferring the right, but not the
obligation, to buy or sell a futures contract. The right to buy a futures contract is known
as a “call option.” The right to sell the underlying futures contract is known as a “put
option.” Because these contracts confer rights, not obligations, they are known as
“contingent claims.” The option buyer, also known as the “holder” of the contract, does
not have to exercise his right to buy or sell the underlying futures contract if doing so
causes him to incur a loss. Option sellers, on the other hand, known as “grantors,” must
stand ready to perform if the option they’ve sold is exercised by the holder. On the
NYMEX, “American-style” options are traded, which allow holders to exercise any time
prior to expiry; other types of options are “European-style,” which permit exercise only at
expiry, and “Asian-style” options, which reference an average price as the underlying
variable against which the option settles.
Like futures, options contracts are completely specified by the exchange, including:
the underlying contractual obligation that is to be delivered in the event of
exercise, e.g., a specific futures contract such as December 2015 crude oil or
natural gas futures contracts;
the price at which a buyer can exercise the option into the underlying future, also
known as a “strike price”;
the expiration date of the option, the “expiry”; and
the deadline by which a buyer must convey intent to exercise to the
clearinghouse.6
The only term not defined in the contract is the price of the option, known as the
“premium,” which is discovered via the trading process.
3. The “Long” and “Short” of Futures and Options Markets
Trading in futures and options markets occurs between exchange members. The public
trades anonymously through member-brokers on the exchange’s platforms. Market
participants, hedgers or speculators, seeking to get “long,” i.e., benefit from prices going
up, can:
1. Buy a call. In return for paying the option premium, the buyer has the right to
exercise into a “long” position, i.e., the option holder buys futures, in the
underlying futures contract if its price exceeds the strike price of the call option,
i.e., the call is “in the money”. The maximum loss an option buyer faces is the
premium paid for the call. If the option is “out of the money,” i.e., futures prices
are less than the strike price, on the expiration date the option is abandoned, and
the premium is forgone.
2. Buy a futures contract. If the contract’s price goes up, the position gains penny
for penny with each tick above the price level at which the contract was
purchased; if prices go down the position will lose penny for penny.
9. Energy Information Administration/Short-Term Energy Outlook Supplement — October 2009
9
3. Sell a put. In return for granting the option, the put seller receives a premium.
This is the maximum gain an option seller can realize. Upon exercise, the put
seller is made long a futures contract by the clearinghouse if prices settle below
the option’s strike, i.e., if the put is in the money.
Those seeking to get “short,” i.e., benefit from prices going down, can:
1. Buy a put. The put holder has the right to exercise into the underlying futures
contract if prices fall below the strike price of the option, i.e., the put is “in the
money”. The premium paid for the option is the maximum loss the buyer can
incur. If the futures price is above the strike, the put expires out of the money.
2. Sell a futures contract. If the contract’s price goes down, the position gains
penny for penny with each tick below the level at which the contract was sold; if
prices go up, the position will lose one-for-one.
3. Sell a call. Again, the maximum gain to the grantor from selling an option is the
premium. The call seller will be made short a futures contract upon exercise at
the call’s strike price, if the contract-month price settles above the strike price of
the option granted.
4. The Behavior of Futures and Options Prices
“We would expect people in the market place, in pursuit of avid and intelligent
self-interest, to take account of those elements of future events that in a
probability sense may be discerned to be casting their shadows before them.
(Because past events cast their shadows after them, future events can be said to
cast their shadows before them.)” Samuelson (1965, p. 44).
Commodity prices are volatile. Unexpected changes in weather, political regimes, global
economic shocks, and countless other factors impact energy markets on a continual basis.
News of such events arrives randomly to market participants—sometimes to all,
sometimes to a few—and when it does, it causes current assessments of future prices and
the range in which prices will trade to change. Sometimes the “news” correctly reflects a
change in supply or demand, or both; sometimes it does not.
Understanding the random behavior of prices, commodity and otherwise, has occupied
some of the greatest minds of the 20th
century, beginning with Louis Bachelier, whose
theorie de la speculation, published in 1900, ignited a revolution in the study of
randomness in science and finance and marked the beginning of the study of Brownian-
motion processes (Courtault, et al, 2000).7
In the 1930s and 1940s, Holbrook Working (1962) suggested an efficient-markets
hypothesis by asserting that volatility in prices indicated futures markets were adjusting
exactly as they should to the arrival of new information. “Pure random walk in a futures
price is the price behavior that would result from perfect functioning of a futures market,
10. Energy Information Administration/Short-Term Energy Outlook Supplement — October 2009
10
the perfect futures market being defined as one in which the market price would
constitute at all times the best estimate that could be made, from currently available
information, of what the price would be at the delivery date of the futures contracts.”8
Nobel laureate Paul Samuelson (1965) formally demonstrated this proposition.9
The high-water mark of these investigations into risk and randomness in financial
markets occurred in 1973 with the publication of two papers by Fischer Black, Myron
Scholes (1973), and Robert Merton (1973), which presented a closed-form model for the
valuation of stock options.10
The Black-Scholes-Merton (B-S-M) model, as it’s come to
be known, was extended to commodities by Black (1976).
In Black’s model, an option’s value, i.e., its “premium,” is determined by:
the volatility of the underlying asset’s price;
its strike price;
the price of the underlying asset itself, not its return;
the risk-free interest rate; and
the time to expiration of the option.
A call’s value increases if the underlying futures price increases, volatility increases, or
time to expiration increases, all else being equal. A call loses value if interest rates
increase or if the strike price is increased, all else being equal. A put’s value increases if
futures prices decrease, volatility increases, or time to expiration increases, all else being
equal. A put loses value if interest rates increase or futures prices increase, all else being
equal, again.11
A particular type of random walk is assumed in the B-S-M and Black models, known as a
geometric Wiener process.12
In such a process, the likelihood of a 1-percent upward
move in an asset’s price is equal to the likelihood of a 1-percent downward move over a
very small time increment. The most an asset can lose is 100% of its value (i.e., the price
distribution is bounded at zero). This means returns would be normally distributed, with
constant volatility, while absolute prices would be log-normally distributed at the
option’s expiry.13
The impact of these models on market functioning is significant. Stephen Figlewski
(1989) notes, “Among all theories in finance, the Black-Scholes option pricing model has
perhaps had the biggest impact on the real world of securities trading. Virtually all
market participants are aware of the model and use it in their decision making.
Academics regularly test the model’s valuation on actual market prices and typically
conclude that, while not every feature is accounted for, the model works very well in
explaining observed option prices.” This also is the case in the commodity option
markets, particularly in the oil markets. Most commodity option models start with the
Black model and build or modify from there.14
In Black’s model, commodity futures prices are assumed to be log-normally distributed,
so log returns are assumed to be normally distributed.15
This can be represented in
equation (1) below, in which the continuously compounded rate of return over some
11. Energy Information Administration/Short-Term Energy Outlook Supplement — October 2009
11
small period of time is equal to the average rate of return plus a stochastic term. In other
words, commodity returns follow a random walk, which is assumed to be zero-drift, plus
a random “shock” component.16
(1) dtzdtf/f kkk,tk),dtt( ln , where
ln = Napierian logarithm, or natural logarithm
ktf , = observed futures price at time = t for the kth
-nearby contract
kdttf ),( = futures price at dtt for the kth
-nearby contract (dt > 0)
k = mean logarithmic return
dt = infinitesimal change in time (∆t, as ∆t → 0)
dtk = the “drift” term
k = standard deviation of the kth
-nearby contract’s returns
z = standard normal random variable with mean = 0, var = 1
dtzk random-shock17
This diffusion process can be used to derive Black’s commodity option pricing model
under the risk-neutrality argument, as Yoshiki Ogawa (1988) demonstrates. Given these
assumptions, we can derive the expected value of a futures price and then specify a
confidence interval around this expected value, as is done below.
5. Methodology for Calculating Confidence Intervals
The expected values of the log returns and the futures price are shown in Appendix I to
be:
(2) k,tk,k,tk, f/dff/fln EE , and
(3) E expff k,tk, , where
(4) ,22
/kk with
= time to expiry (as a percent of a 252-day trading year).
12. Energy Information Administration/Short-Term Energy Outlook Supplement — October 2009
12
In the standard formulation of the confidence interval (CI) for the returns, the expected
value is set to zero, consistent with the martingale assumption for futures,18
so
(5) 22
/kk , and
the confidence interval19
around the expected value of the returns would be given by
(6) 122Prob 2
2
k2
2
k/kk/k *z/*z/ , where
1 confidence coefficient, or the degree of confidence; e.g., when =0.05,
the degree of confidence is 95 percent,20
and
2/z = Standardized normal value for level of confidence.
This is a confidence interval for the normally distributed percent returns of the futures
price. The mean and variance fully describe the expected distribution of returns.
In price terms, the confidence interval would be:
(7) k/kk,tk, *z/exp*ff 2
2
2E for the lower limit,
and
(8) k/kk,tk, *z/exp*ff 2
2
2E for the upper limit.
This is the standard confidence interval formulation for a lognormally distributed random
variable. However, in the case of upper limit for the CI, this formulation produces
inconsistent results for small confidence levels and for narrow CIs over longer time
intervals, i.e., the upper limit of the CI could be less than the forward price anchoring the
interval in such instances, depending on the confidence level specified.
A formulation for a confidence interval in which the upper limit is less than the forward
curve used to compute the limit severely restricts the explanatory power regarding the
range of price uncertainty. Therefore, we impose a correction equal to 22
/k on either
side of the confidence-interval calculation, which forces the upper confidence limit to
converge on the forward price for small and narrow CI specifications, as the negative
sigma-squared term’s effect is negated. Thus the CI takes the form (for price):
(9) k/k,tk, *zexp*ff 2E for the lower limit,
and
13. Energy Information Administration/Short-Term Energy Outlook Supplement — October 2009
13
(10) k/k,tk, *zexp*ff 2E for the upper limit.
This is consistent with similar imposed corrections in the literature.21
The intuition of this confidence interval is consistent with the assumption of the
geometric Wiener process. The expected futures price is dependent on a zero-drift term
and a random-shock term. Per the assumptions and model, the only source of variation in
the futures price between the time a price is observed and the as-yet-to-be-realized price
at the expiry of the associated options contract are the random shocks resulting from the
arrival of new information in the market. Thus, the zero-drift process is maintained while
the futures price traverses a path consistent with the stochastic term, i.e., dtz* , in this
model.
6. Which to Use: Implied or Historical Volatility?
The above methodology for determining the confidence interval for the energy futures
price requires an appropriate measure of variance for the price distribution.
The k input to the Black pricing equation can be estimated in a variety of ways using
historical futures price realizations. Typically, the historical volatility for the kth
-nearby
futures contract ( h
k
ˆ ) is computed using the maximum-likelihood estimator and daily
historical futures price relatives:
h
k
*1-1/n
2
1 n
i kk,i ]RR[
Ri,k = daily price relative = k,tk,t f/fln 1 , with i = t, t-1, …, t-n
Here, “n” is the number of days used to construct the historical volatility estimate,
e.g., for 20 price observations, n = 20, we have 19 daily returns in the volatility
estimate beginning with today’s price relative at time t through to the price
relative at time 19t days ago.
kR = nR
n
i ki /][1 ,
= calculated average return of daily price relatives of the kth
nearby contract.
Alternatively, an historical volatility also can be estimated via econometric methods, such
as autoregressive conditional heteroskedasticity (ARCH)-based models and regime-
switching models, as was done by Duffie and Gray (1995).22
An entirely different tack can be taken by inverting the Black option pricing model.23
All
of the pricing inputs required to run Black’s model are readily observable, with the
exception of the volatility, i.e., the standard deviation of returns, or “ k ”, of the kth
futures contract. Consequently, given the underlying futures price, the strike price,
14. Energy Information Administration/Short-Term Energy Outlook Supplement — October 2009
14
interest rates, and time to expiry, the volatility for options written on the kth
-nearby
futures contract that equates the Black model with the cleared option premium that trades
in the market can be solved for by running Black’s model “backwards.” This is known as
the market-based “Black implied volatility,”24
denoted i
k .
The Black implied volatility turns out to be a better estimate of realized volatility for
commodities than the various historical volatilities, based on empirical tests of the
markets. The implied volatility, also referred to as “the implied” by market participants,
is a forward-looking estimate of the expected volatility for prices derived from the
market-clearing process. Like the futures price, the implied is a cleared market-based
parameter of an expected distribution. Hence, in terms of describing the range in which
futures prices have the highest likelihood of trading, the implieds are expected to be more
accurate than any of the historical measures of volatility.
Stein (1989) summarizes options-based estimates of volatility thusly: “Options can be
thought of as reflecting a speculative market in volatility – the implied volatility on a
given option (obtained by inverting a Black-Scholes-type formula) should equal the
average volatility that is expected to prevail over the life of that option.”
In an empirical analysis of crude oil, heating oil and natural gas trading markets, Duffie
and Gray (1995) found that “Black-Scholes option-implied volatility, when available,
provides a more reliable forecast of future volatility than either historical volatility, or
than can be obtained from the standard Markovian models of volatility that we have
examined; the latter included simple regime-switching models and ARCH-based models
such as GARCH, EGARCH and multi-variate GARCH.”25
Szakmary, Ors, Kim and Davidson (2003) assessed implied versus historical volatility
and GARCH-based estimates in their analysis of 35 futures markets. Included in their
study were crude oil, heating oil, gasoline, and natural gas futures. In particular, they
find the implied volatilities of the energy options to be among the best predictors of
realized volatility in the futures contracts they studied.
As a practical matter, financial markets in which futures and options trade collect the
most current information on supply, demand and expectations vis-à-vis the future
available. Bernanke (2004b) notes: “To assess recent developments in the oil market, it
would be useful to know whether the high price of oil we observe today is a temporary
spike or is instead the beginning of an era of higher prices. Although no one can know for
sure how oil prices will evolve, financial markets are one useful place to learn about
informed opinion. Contracts for future deliveries of oil, as for many other commodities,
are traded continuously on an active market by people who have every incentive to
monitor the energy situation quite closely. Derivative financial instruments, such as
options to buy or sell oil at some future date, are also actively traded. The prices observed
in these markets can be used to obtain useful information about what traders expect for
the future course of oil prices, as well as the degree of uncertainty they feel in predicting
the future.”
15. Energy Information Administration/Short-Term Energy Outlook Supplement — October 2009
15
These findings are consistent with other studies surveyed by Poon (2005), who notes,
“the volatility forecasting contests show overwhelmingly that option implied volatility
has superior forecasting capability, outperforming many historical price volatility models
and matching the performance of forecasts generated from time series models that use a
large amount of high-frequency data.” A similar point was made by Engle (2002), citing
research by Poon: “Do GARCH models out-forecast implied volatility models? The
answer is complex depending upon the statistical approach to forecast evaluation, but
generally it is found that implied volatilities are more accurate forecasts of future
volatility than are GARCH models.”26
Szakmary, et al, (2003) state, “Our findings … are consistent with the weak-form
efficiency of futures options markets, in that the volatility information embedded in
current option prices is a better predictor of future volatility than historical measures of
volatility, regardless of how the latter are modeled.”27
They suggest institutional and
structural effects, e.g., commodity options and futures typically trade in the same venue
and have lower transactions costs versus equities and their associated options, partly
explain these results.
Any test of a market’s efficiency using a model is a joint test of the model used and the
market’s efficiency, as noted by Jorion (1995), Dimson and Mussavian (1998), Szakmary
et al (2003) and Poon (2005).28
Essentially, market participants trading the options are
assumed to behave as if the model reflects reality, and the market is assumed to behave in
a manner that would be consistent with the underlying assumptions of the model.
Additionally, implied volatility can be treated as a sufficient statistic and used to derive a
confidence interval around the mean of the returns distribution. Because the returns are
assumed to be normally distributed, their expected mean and variance fully characterize
the expected distribution.29
7. Procedure Observed for Mapping NYMEX Futures Confidence Intervals
Using standard normal probability distribution tables found in most statistics textbooks, a
price range, e.g., a 95-percent confidence interval, or multiple confidence intervals can be
described.
The individual parameters used in mapping confidence intervals for WTI and Henry Hub
natural gas futures are simple five-day averages computed from NYMEX settlement
prices and the NYMEX at- and near-the-money implied volatilities published nightly by
the Exchange.30
These data are used by the Exchange to calculate margins for futures
and options portfolios using the Exchange’s Standard Portfolio Analysis of Risk
(SPAN).31
Averaging these observations reduces the likelihood a single observation will
be overweighted by a large trade, or, at the other extreme, the likelihood a single day’s
trading is too sparse to produce prices with significant economic information. This
averaging is a procedure referenced elsewhere in the literature.32
The graphical output produced using these procedures (Figure 1 and 2) shows
16. Energy Information Administration/Short-Term Energy Outlook Supplement — October 2009
16
The current STEO forecast
The current NYMEX forward curve.
The 68-percent (one standard-deviation) CI, and a 95-percent CI around the
NYMEX forward curve are specific to each contract month, as the calculation
relies on each contract month’s futures price and implied volatility to form CIs.
The EIA confidence-interval model for energy futures deliberately chooses at- or near-
the-money options to calculate the variance parameter, given the well-known “volatility
smile” effects documented in numerous options markets – i.e., the tendency for deep-out-
and deep-in-the-money options to have volatilities different from the at- and near-the-
money options. This is done for two reasons: 1) The at- and near-the-money options
typically are the most liquid options traded; and, 2) they are most sensitive to changes in
information affecting the estimation of volatility.
Over the decades during which this phenomenon has been studied, sophisticated models
designed to extract market participants’ expectations from the “smile” have been
developed to provide policy-makers real-time assessments of market uncertainty and the
affects their innovations have on asset values, as Clews et al (2000), Melick and Thomas
(1992), Jackwerth (2004), Bernanke (2004a), and Figlewski (2008) note.33
There are
numerous avenues for further research along these lines and elsewhere for energy
markets, as we note below.
8. Areas for Future Research
The use of implied volatility as the best predictor of future realized volatility still is a
source of debate. In addition, as one reviewer of this article noted, many of the academic
studies cited herein were done for markets other than crude oil and natural gas futures.
Results of any econometric test will be a function of the underlying financial variables
and the time period covered in the tests. Therefore, results for energy markets will
produce valid results for the time period studied. The reviewer also noted that futures
have not been conclusively demonstrated to be superior predictors of realized future
commodity values. Some studies indicate they are biased predictors of realized values.
Another reviewer noted the model assumed for EIA confidence intervals—geometric
Brownian motion— does not explain the extraordinarily sharp price movements seen
during the 2008-09 period, when WTI futures traded to more than $145/bbl and months
later fell below $40/bbl, only to trade back up to around $70/bbl by mid-2009. He
suggested testing for lognormality in prices to assess deviations from this assumption. In
addition, he too questioned whether the lognormal price assumption underestimates the
likelihood of extreme price realizations going forward (i.e., extreme outcomes are more
likely than are implied by the distribution assumed after the Black (1976) model is
inverted to recover the variance estimate).
The EIA model uses implied volatilities published by NYMEX, which, as mentioned
above, inverts Black’s model (i.e., a European-style option model) to calculate implied
volatilities. This means the volatility parameter of the expected price distributions for
17. Energy Information Administration/Short-Term Energy Outlook Supplement — October 2009
17
WTI crude oil and natural gas futures is based on the Black model’s assumption the
options can only be exercised at expiry. For natural gas, this is wholly consistent with the
Exchange’s methodology, since it inverts a Black model to solve for the volatility of its
financially settled natural gas options, which are European-style options. Crude oil
options, however, are American-style options, thus inverting a Black model to solve for
implied volatility may underestimate volatility. As part of EIA’s ongoing benchmarking
of its model, we will test whether the volatility from an American-style model is
significantly different from the European model inverted by NYMEX to solve for
volatility. Two reviewers noted, the EIA model uses “the prices of American-style
options, but their model is for European-style options. We did a quick comparison of the
current prices of American and European-style options on WTI futures and found that the
value of early exercise has little to no value. …”34
EIA will be conducting ongoing tests to benchmark its volatility model and its
assumptions, as well as examining recently developed risk-neutral-density techniques to
see if they offer better forecasts of realized volatility than the simple implied-volatility
model using at- and near-the-money options presented herein. Lastly, EIA will be back-
testing this model vis-à-vis confidence intervals developed using historical data and then
checking to see if the model contain the realized prices predicted by this specification.
18. Energy Information Administration/Short-Term Energy Outlook Supplement — October 2009
18
Appendix I: Derivation of the Confidence Interval for Futures Prices
To derive the confidence intervals for futures prices under the assumptions of the Black
(1976) and Cox-Ross-Rubenstein (1979) models, we begin with
(1) dtzdtf/f kkk,tk),dtt( ln , with notation as before in Section 4.
First following Ogawa (1988) and Jarrow and Rudd (1983),35
both sides of (1) are
exponentiated, so
(2) dtzdtexpf/f kkk,tk),dtt(
This expression can be used to derive the expected value of the percent returns. Using
Maclaurin’s expansion for equation (2) gives
ktkdtt ff ,),( / = ...!3/!2/1
32
dtzdtdtzdtdtzdt kkkkkk
Let k,tk,tk),dtt( dfff , therefore, re-arranging,
kdttf ),( = ktkt dff ,, , and dividing both sides by ktf , , gives
ktktktktkdtt fdffff ,,,,),( // , so
...!3/!2/1/1
32
,,
dtzdtdtzdtdtzdtfdf kkkkkkktkt
Thus,
...!3/
3
!2/
2
/ ,,
dtz
k
dt
k
dtz
k
dt
k
dtz
k
dt
k
fdf ktkt
Ignoring terms with order of dt > 1, since they get infinitesimally smaller as the order of
dt increases, yields
(3) dtzdtz/f/df kkkk,tk,t 2 22
Taking the expectation of (3) gives
(4) ...dt/f/df kkk,tk,t 2E 2
, as ,z 0E and 12
zE
19. Energy Information Administration/Short-Term Energy Outlook Supplement — October 2009
19
For expositional convenience, this is treated as an equality. Formula (4) is the expected
value of the percent returns. In Black’s (1976) formulation, the return to a futures
contract is zero. In section 2 of his paper, Black concludes: “For these commodities,
neither those with long futures positions nor those with short futures positions have
significantly positive expected dollar returns.” This is consistent with Samuelson’s proof
(1965) and Ogawa’s (1988) derivation, and recently was demonstrated by Hamilton
(2009).36
This is used to define a confidence interval for the return to holding a futures
contract.
Let 22
/kk , so (4) becomes
(5) dtf/df k,tk,t E
Jarrow and Rudd (1983) show the variance and standard deviations of the returns – i.e.,
ktkt fdf ,, / – are
(6) ,dtf/df kk,tk,t
2
Var therefore
(7) dtf/df kk,tk,t StDev
We also can derive an expression for the expected value of the futures price from the log-
normal diffusion above. Taking the expectation in (2) above, gives
dtzdtexpf/f kkk,tk),dtt( EE
dtzσexp*dtμexpf/f kkk,tk),dtt( EE
The second expression on the right-hand side in the exponent above, i.e., dtzkexp ,
is the moment-generating function for a normal random variable.37
Collecting terms
yields:
dt/exp*dtexpf/f kkk,tk),dtt( 2E 2
, so
dt/expff kkk,tk),dtt( 2E 2
, and, recalling 22
/kk , this becomes
(8) dtexpff k,tk),dtt( E
Here it is seen that the expected futures price can be expressed as the current observed
futures price times the expected return to holding the futures contract over an arbitrarily
small time interval. The mean and variance of the price-relative scale proportionately
with time in the geometric Wiener process assumed for futures prices,38
thus:
20. Energy Information Administration/Short-Term Energy Outlook Supplement — October 2009
20
dtk k , and
dtk
2
2
k , so
dtk k
Here, = time to expiration (as a percent of a year) in the kth
-nearby option contract.
Given the mean and variance are linear in time, the following relationships hold:
(5*
) k,tk,k,tk, f/dff/fln EE , and
(8*
) E expff k,tk,
The equation numerals above are starred (*) to indicate these expressions are scaled-by-
the-time-to-expiration versions of the original equations bearing those numerals.
In the standard formulation of the confidence interval for the returns, the expected value
is
(9) 22
/kk
As shown above. Setting 0 above, per Ogawa (1988, p. 55) to be consistent with the
martingale assumption, we see
(10) 22
/kk
and the confidence interval would be specified as
(11) 122Prob 2
2
k2
2
k/kk/k *z/*z/ ,
which, in price terms, would be:
(12) k/kk,tk, *z/exp*ff 2
2
2E for the lower limit,
and
(13) k/kk,tk, *z/exp*ff 2
2
2E for the upper limit.
This is the standard CI formulation. However, in the case of upper limit for for the CI,
this formulation produces inconsistent results for small confidence levels and for narrow
CIs over longer time intervals, i.e., the upper limit of the CI could be less than the
21. Energy Information Administration/Short-Term Energy Outlook Supplement — October 2009
21
forward price anchoring the interval in such instances, depending on the confidence level
specified.
A formulation for a CI in which the upper limit is less than the forward curve used to
compute the limit severely restricts the explanatory power regarding the range of price
uncertainty. Therefore, we impose a correction equal to 22
/k on either side of the
confidence-interval calculation, which forces the upper confidence limit to converge on
the forward price for small and narrow CI specifications, as the negative sigma-squared
term’s effect is negated. Thus the CI takes the form (for price):
(14) k/k,tk, *zexp*ff 2E for the lower limit,
and
(15) k/k,tk, *zexp*ff 2E for the upper limit.
This is consistent with similar imposed corrections in the literature – see, e.g., Newell and
Pizer (2003, p. 64).
22. Energy Information Administration/Short-Term Energy Outlook Supplement — October 2009
22
Appendix II: Derivation of the Cumulative Normal Density for Futures Prices
In this appendix, the cumulative normal density function for commodity prices is derived,
consistent with the Black commodity option pricing model.39
In Section 5 and Appendix I above, the confidence interval for expected futures prices
was obtained, given an implied volatility. In this appendix, that derivation is expanded to
show how the cumulative normal density function for commodity prices is derived within
the Cox-Ross-Rubinstein (1979) risk-neutral framework.
In a risk-neutral economy, where utility preferences are linear, a hedge position can be
constructed that earns the risk-free rate of return, and we can solve for the expected value
of a call option.
The derivation for the value of a call option proceeds by solving for the net present value
of the option on the kth
nearby future at the call’s expiration date at time = . As before,
the time to expiration of the kth
-nearby future = k = time to expiry as a percent of a year,
which, for notational convenience, is written as . As before, a 252-day trading year is
assumed, and business days between the current time t and expiry are counted.
Let k,C be the present value of the call, and k,CE be the expected value of the call at
expiry. Under the risk-neutral assumptions, all assets return the risk-free rate =
*rexp k , therefore, the expected value of the call in present-value terms would be
kk,k, rexp*CC E
For expositional ease, let kk, rexp , so the present value of the call would be
(1) k,k,k, *CC E
The call has value if the futures price at expiry is greater than its strike price kx ;
otherwise, it will expire worthless.40
This can be expressed as
(2) 0,xfmaxC kk,k, , so
(3) k,kk,k,k,k, *,xfmax*CC 0EE
Let kk, xfp Prob1 , which would render 00 k,k, *C
Let kk, xfp Prob , then k,kk,k, *xfC E
Collecting the mutually exclusive probabilities, yields
23. Energy Information Administration/Short-Term Energy Outlook Supplement — October 2009
23
k,kkk,k,k, *xxf|fppC E01 , which reduces to
(4) k,kkk,k,k, *xxf|fpC E
Concentrating specifically on the probability kk, xfp Prob , the second term in
brackets above is kx*p , which is simply the strike price kx times the probability the
kth
-nearby futures price is greater than the call option’s strike price (a constant value) at
the expiry of the option (ignoring the present-value discount factor). Given the log-
normal price assumption, this is equal to
kk x
k,k,kk,
x
k,kkk,kk dffL*xdffLxxfxp*x Prob* , where,
k,fL log-normal probability density function.
Recall from the derivation above, that the mean and variance of the price-relative scale
proportionately with time in the geometric Wiener process assumed for futures prices, so
zexpff kkk,tk, *E , therefore,
(5) kkkk,t xzexpfp *Prob
Going back to the “z” transformation, so as to work with a standard normal random
variable,
kkkk,t /xflnzp /Prob , and, this is equal to
(6) kkkk,t /xflnzp /Prob
Recalling 022
/kk above, 22
/kk , thus
(7) kkkk,t //xflnzp 2/Prob 2
, so
(8)
kkkk,t
k
//xfln
k
x
k,k,k dz/zexp*/xdffL*x
2/ 2
2
22
To be consistent with Black’s (1976) notation, let
(9) kkkk,t //xflnd 2/ 2
1 , thus (7) can written as
(10) 21Prob ddzp k , i.e.,
(11) kkkk,t //xflnd 2/ 2
2 , and equation (8) can be written as
24. Energy Information Administration/Short-Term Energy Outlook Supplement — October 2009
24
(12) 2d*xdffL*x k
x
k,k,k
k
, where
Cumulative normal distribution
From this derivation, we see that the probability the terminal futures price exceeds the
strike price of a given option is equal to the cumulative normal density of the “d2” term
above – i.e, 2Prob dxf kk, .
This is an especially useful result: It allows us to specify the probability the underlying
futures price against which a call option is written will exceed a given strike price, at the
expiry of the option. This is useful in assessing the market’s probability density
functions for given prices.
For example, given the underlying futures price and the implied volatility for a given
options contract, say, the at-the-money contract for December 2009 WTI futures, what is
the probability this will exceed $100 per barrel?3
On July 31, 2009, with the EIA-
calculated December 2009 WTI five-day futures average at $71.36 per barrel and the
calculated five-day implied volatility for December 2009 options at 45.33 percent, this
likelihood was 33.67 percent.
For natural gas, the comparable statistics were: December 2009 EIA-calculated futures
$5.32 per MMBtu for the Henry Hub futures average price and 56.40 percent for implied
volatility. The likelihood on July 31, 2009, that the December 2009 natural gas futures
would settle over $10.00 per MMBtu was 25.59 percent.41
This result for 2d also is used in the derivation of the Black commodity option pricing
model, which is given in Appendix III below.
25. Energy Information Administration/Short-Term Energy Outlook Supplement — October 2009
25
Appendix III: Black’s Commodity Option Formula
The Black commodity option pricing model for calls is
kC , = 21 d*xd*f kk,tk, , where
kC , = Present value of European Call written on futures contract with
price ktf ,
= Cumulative normal probability density function with
21 and dd as before in Appendix II
k, = )*exp( kkr = present-value discount factor, employing the risk-
free interest rate
ktf , = observed kth
-nearby futures contract’s value at time t, k = 1, 2, … n
kx = strike price corresponding to an option written on the kth
-nearby
futures contract
2
k = variance of the returns on the kth
-nearby futures contract
k = volatility
k = time to expiration of the kth
-nearby option contract (as a percent of a
252-day trading year)
Black’s model for Puts (P kt, ) can be solved using the put-call parity relationship42
kP , = 12 d*fd*x k,tkk, .
26. Energy Information Administration/Short-Term Energy Outlook Supplement — October 2009
26
End Notes
1
See Hodge, et al, (2009, pp. 4 – 5). See also Clews, et al, (2000), and Bernanke (2004a and 2004b, p. 2).
2
See endnote 30 and 34 below.
3
Source: New York Mercantile Exchange. See NYMEX Light Sweet Crude Oil futures and NYMEX
Natural Gas futures for additional detail on these contracts and markets. Physically and financially settled
contracts are traded on the NYMEX. In NYMEX’s natural gas markets, the financially settled options
allowing exercise only upon expiry (i.e., the European-style options) have higher volume and open interest
(i.e., contracts that have not been extinguished by delivery or offset) than the options settling into a
physically delivered futures contract. NYMEX uses the financially settled European-style options as to
determine the volatility of the less liquid American-style options that settle into the underlying futures
contract for its daily margining purposes. Given the Exchange uses the deeper options markets to
determine the volatility against which the financially settled and settlement-into-futures options to
determine daily margins, the EIA model effectively uses the European-style option’s volatility to estimate
the volatility parameter of the expected natural gas price distribution. The model is developed beginning in
Section 4. See NYMEX Monthly Volumes for data on energy futures trading volume. See Commodity
Futures Trading Commission, Commitments of Traders reports, for detail on open interest in WTI and
natural gas futures.
The IntercontinentalExchange(R)
, or ICE, is a competitor of the NYMEX, and operates the Brent Blend
futures market, which is the benchmark for North Sea crude oil. ICE calculates its futures settlements
based on the average price of trading in the 21-day North Sea Brent-Forties-Oseberg-Ekofisk market in the
relevant delivery month as reported and confirmed by the industry media. See ICE OTC, ICE Crude Oil,
for additional information. ICE also trades financial contracts settling against NYMEX WTI futures. In
addition, the ICE operates natural gas futures and OTC markets referencing the NYMEX futures and other
indices for settlement purposes. See ICE Homepage (https://www.theice.com/) for additional detail.
4
Commodities trade in four distinct markets: futures, forwards, spot and over-the-counter derivatives
markets. We discuss futures at length in this article. The other three markets are characterized by bilateral
contracting and individual collateral requirements that are negotiated between counterparties – i.e., there is
no clearinghouse interposition between buyer and seller in these bilateral markets. Buyers and sellers take
clearinghouse credit risk trading futures; however, in the bilateral markets they take counterparty credit
risk. In forward markets -- e.g., a long-dated natural gas physical sale – contracts are traded between
unique counterparties and payment is made per contract terms after delivery occurs (there is no requirement
contracts be marked to market, as is the case for futures, although there may be collateral requirements).
These principal-to-principal contracts can incorporate standard terms and conditions, but also allow for
customized terms. “Spot” contracts literally specify on-the-spot delivery – i.e., immediate or very-close-to-
immediate – delivery of a commodity, for which payment is made shortly thereafter. Financially settled
derivatives – e.g., swaps and options – typically are traded in the over-the-counter (OTC) markets. OTC
contracts typically reference generally accepted pricing indices for oil or gas against which the derivatives
settle. OTC markets also trade derivatives contracts that reference futures settlement prices. For
discussions of spot, forward and futures markets, see Black (1976), Williams (1989), and Duffie (1989).
See Hull (1997), Commodity Futures Trading Commission (September 2008), and Interagency Task Force
on Commodity Markets (2008) for discussions of futures and OTC markets.
On March 16, 2009, the Commodity Futures Trading Commission (CFTC), the U.S. futures markets
regulator, approved rules and amendments increasing oversight of so-called Exempt Commercial Markets
(ECMs), on which principal-to-principal transactions occur via electronic trading platforms. These rules
implemented provisions of the CFTC Reauthorization Act of 2008, creating a new regulatory category,
ECMs with significant price discovery contracts (SPDCs). These electronic trading facilities are now
subject to additional regulatory and reporting requirements.
27. Energy Information Administration/Short-Term Energy Outlook Supplement — October 2009
27
The overall size of the bilateral OTC oil market is difficult to gauge; the Bank for International Settlement
(BIS) estimates total notional OTC commodities contracts outstanding in 2008 stood at $4.4 trillion, down
by 66.5 percent from 2007 levels. However, the BIS does not break energy contracts out separately. See
Bank for International Settlements (May 2009, p.3), for additional information.
The U.S. Congress enacted the Food, Conservation, and Energy Act of 2008 on May 22, 2008, which
reauthorized the CFTC until 2013, and gave it additional regulatory and enforcement tools to regulate the
futures industry, particularly transactions in energy products. Hearings into energy futures market
regulation were conducted in late July 2009 by the CFTC – see CFTC’s Hearing on Speculative Position
Limits in Energy Futures Markets, July 29, 2009, for additional information.
5
For NYMEX’s WTI crude oil futures and Henry Hub natural gas futures specifications, see Light Sweet
Crude Oil Futures and Natural Gas Futures. See NYMEX Market Information for articles concerning
NYMEX futures markets published by the Exchange.
6
For complete specification of the NYMEX options, see Light Sweet Crude Oil options and Natural Gas
options.
7
See Connexions "Brownian Motion" module by Jason Holden and Kevin Kelly. The Brownian-motion
process is named in honor of the Scottish botanist Robert Brown. Holden and Kelly note: “The first person
to put forward an actual theory behind Brownian motion was Louis Bachelier, a French mathematician who
proposed a model for Brownian motion as part of his PhD thesis in 1900.” Brownian motion, Holden and
Kelly note, is a mathematical description of “the random movements of minute particles upon immersion in
fluids. As Brown once noted in his observations under a microscope, particulate matter such as, for
example, pollen granules, appear to be in a constant state of agitation and also seem to demonstrate a vivid,
oscillatory motion when suspended in a solution such as water.” Bachelier arrived at his groundbreaking
formulation studying price behavior in French financial markets.
8
Working was referencing his 1949 article, “The Investigation of Economic Expectations.” Working also
published “A Random-Difference Series for Use in the Analysis of Time Series,” in 1934, which showed
that price randomness is to be expected if markets are efficient. See Dimson and Mussavian (1998, pp. 91-
193), who note Working’s findings and others related to random-walk theories were overlooked by
economics researchers until the late 1950s. For a discussion of the evolution of the Efficient Markets
Hypothesis to its modern appreciation see Lo (2007). Engle (2004) has an excellent development of how
markets process “news” vis-à-vis volatility beginning on p. 407. This was Engle’s Nobel lecture; he was
awarded the Nobel Prize in 2003 for his contributions to understanding and modeling volatility, specifically
via his development of the autoregressive conditional heteroskedasticity (ARCH) model and its progeny.
9
Samuelson’s proof showed that a futures contract’s expected value is equal to the currently observed
futures price. This is known as the “martingale” property and is used extensively in modern finance.
Samuelson was instrumental in introducing the mathematics of random processes to the economics
profession in the late 1950s, according to Dimson and Mussavian (1998).
10
Merton and Scholes received the Nobel Prize in Economic Sciences in 1997 for their path-breaking
work, which has been applied and extended throughout finance and economics. Black died in 1995; the
award is not presented posthumously. See Merton (1998) and Scholes (1998) for their Nobel lectures.
11
See Cox and Rubinstein (1985, Chapter 5, section 8, beginning on p. 215): “How changes in the
variables affect Black-Scholes option values.” In these models, there are no restrictions on short selling in
the construction of risk-free portfolios; there are no taxes, transactions costs or arbitrage opportunities
available to market participants. See Hull (1997, p. 236) for complete listing of assumptions in B-S-M.
See Malone (2002), for a survey of studies where various assumptions in the B-S-M model are relaxed.
28. Energy Information Administration/Short-Term Energy Outlook Supplement — October 2009
28
12
The Wiener process is named after the American mathematician Norbert Wiener. See Jerison and
Stroock (1995), and Mandrekar (1995). This is also known as a geometric Brownian motion (GBM).
13
Under the assumptions of their model, B-S-M showed a risk-free portfolio could be constructed using
continuously traded stocks and options, which would earn the riskless rate of return. See Hull (1997, p.
236 for list of assumptions.) B-S-M’s arbitrage-based proof paved the way for further innovations in
options theory (see, e.g., Margrabe, 1978).
14
In the present note, for example, we employ, inter alia, Ogawa’s derivation (1988), which follows the
risk-neutral valuation methodology developed in Cox-Ross-Rubinstein (1979). The C-R-R article provides
a more tractable alternative to deriving the B-S-M (1973) and Black (1976) results. C-R-R note in their
article they use “elementary mathematics,” i.e., a binomial tree model, to derive the option-pricing
equation, which contains the B-S-M formula as a limiting case, whereas B-S-M and Black employ “quite
advanced” stochastic calculus to derive their result.
Musiela and Rutkowski (2005) provide an in-depth development of the risk-neutral methodology, also
known as the “martingale” method. See Melick and Thomas (1992 and 1998) for examples of how central
banks expand the C-R-R and Cox-Ross (1976) techniques to recover market-derived probabilities vis-a-vis
assessing monetary policy innovations. For a discussion of risk preference, see Fama and Miller (1972,
particularly Chapter 5), and Musiela and Rutkowski (2005, Chapter 1).
15
See Dimson and Mussavian (1999, p. 1762) for an excellent discussion of the development and evolution
of asset-pricing models, including C-R-R’s. They note: “The Cox-Ross-Rubinstein model has the
advantage that it can easily be adjusted to price other derivatives, such as American puts, which are
considerably harder to evaluate in the Black-Scholes framework. This approach is immensely popular, not
only in the classroom buy also among practitioners.”
16
The lognormal assumption for asset prices, which translates into a normal assumption for log returns, has
been a source of debate since at least the early 1960s. Numerous researchers have noted the distribution of
daily returns of many assets is leptokurtic, i.e., “fat-tailed” and peaked. Jackwerth (2004, pp. 39 - 40)
notes: “Two well-known reasons could be the cause. First, the return distribution may not be lognormal but
leptokurtic. Second, a return distribution may be nonstationary over long periods. Returns are likely to be
nonstationary if the economy fundamentally changes. … Over the 1928-96 period, the United States went
through the depression, World War II, the postwar growth, the oil crises of the early 1970s, the advent of
the computer revolution, and the modern service economy. For returns from each of these periods to look
systematically different from the next period’s returns and for their distributions to exhibit different
parameter values would not be surprising. Nonstationarity introduces leptokurtosis even if the true
underlying distribution is lognormal but with time-varying parameters.” Jackwerth (2004) tested the
lognormal assumption for S&P500 returns over the January 1928 – December 1996 period using a
Kolmogorov-Smirnov test, a nonparametric test to measure whether an observed distribution conforms to
an assumed distribution. He found support for the lognormal distribution hypothesis, which depended on
the type and length of the sample (e.g., daily returns over three-month intervals). See Jackwerth (2004, pp.
40 – 43.) EIA will be conducting similar research on oil and natural gas prices and returns.
17
See Cox and Ross (1976) for a description of the diffusion process. See also Ogawa (1988, p. 53), and
Duffie (1989, Chapter 6), “Statistical behavior of futures prices” for a discussion of modeling stochastic
processes.
18
See Ogawa (1988, p. 55).
19
See Freund and Walpole (1987, particularly Chapter 11).
20
See Freund and Walpole (1987, p. 365).
29. Energy Information Administration/Short-Term Energy Outlook Supplement — October 2009
29
21
See, e.g., Newell and Pizer (2003, p. 64).
22
See Duffie and Gray (1995), for a description and results of using such models.
23
See Appendix III herein for specification of Black’s (1976) model.
24
See Musiela and Rutkowski (2005, p. 222). Duffie and Gray (1995) and others suggest using a Newton-
Raphson search to determine the implied volatility for each option. EIA’s model uses implied volatilities
calculated by the New York Mercantile Exchange (NYMEX), which are used to compute margins for
options under the Standard Portfolio Analysis of Risk (SPAN) program used by the CME Group, the parent
company of the NYMEX. NYMEX inverts Black’s model (1976) to calculate i
k for calls and puts with
open interest in each contract month. See CME SPAN for an overview of CME clearinghouse Standard
Portfolio Analysis of Risk methodology.
25
Duffie and Gray (1995, p. 52). GARCH stands for Generalized ARCH model; EGARCH stands for
Exponential GARCH; see Engle (2004, p. 407). See also Green and Figlewski (1999), re GARCH
modeling, who note: “… GARCH has some serious shortcomings as a forecasting tool. One is that the
parameters must be estimated from past data, and this frequently requires quite a large data set.”
26
Engle (2002, p.3) cited a working paper by Poon and Granger that later was published as Poon, S.-H.,
and C.W.J. Granger (2003), “Forecasting financial market volatility: A review,” in the Journal of Economic
Literature, Vol. 41, 2, pp. 478-539. Poon cites this survey of the literature in the References of Poon
(2005, p. 211).
27
Szakmary, et al (2003, p, 2173). The regressions they estimated (p. 2158) generally follow the model
specified by Canina and Figlewski (1993), and take the form:
,ttt eV[]RV where
tRV = Realized volatility at time = t
= constant
tV[] = coefficient times either Implied Volatility tVI , or Historical Volatility tVH
te = error term
tt
'
tt eHVIVRV then is estimated to see if including HV adds explanatory power to
the regression including IV. Later, GARCH estimates are substituted for HV. An unbiased
predictor would have 1orand0 '
, .
28
Jorion (1995) found implied volatilities in foreign exchange (FX) options were superior estimators of
realized volatility (i.e., had superior information content) to GARCH and historical volatility estimators, a
finding cited by Szakmary, et al (2003) above, and confirmed for the 35 futures markets they examined.
Among the most robust results they found were those for the oil and natural gas futures options.
Jorion’s findings also were confirmed in Weinberg (2001). Weinberg’s discussion is an excellent summary
of the issues surrounding the use of implied volatilities as parameter estimators of the expected distribution
for prices generally. According to Weinberg, Jorion’s study was meant to test findings by Canina and
Figlewski (1993), which showed implied volatility had no explanatory power vis-à-vis realized volatility in
the S&P 100 index. The Canina-Figlewski results thus were not confirmed by either Jorion or Weinberg.
Of particular note, Weinberg finds Black-Scholes at-the-money implied volatility provided the best
estimate of realized volatility among the models tested for FX options, including recently developed
nonparametric techniques for estimating risk-neutral probability density functions for the underlying
futures contracts. The two measures of realized volatility were highly correlated, however. This suggests
30. Energy Information Administration/Short-Term Energy Outlook Supplement — October 2009
30
the more parsimonious model, the B-S-M or Black implied volatility for at- and near-the-money options,
will produce as good an estimate of realized volatility, hence the market’s expectation of price ranges, as
the more computationally intensive techniques for deep options markets. See also Figlewski (2008) for
additional discussion of risk-neutral density estimation.
An area for future study is the exploration of whether these techniques, particularly the use of risk-neutral
probability distributions recovered from options markets, improve the efficiency of confidence-interval
estimation for energy markets. See, for example, Melick and Thomas (1998, 1992). For an excellent
summary and literature survey regarding these techniques, see Jackwerth (2004).
29
This would be consistent with weak-form market efficiency – i.e., “… prices fully reflect the information
implicit in the sequence of past prices,” according to Dimson and Mussavian (1998). Thus, including
historical volatility in any estimate of future returns distributions would not add new information to the
estimate; the implied volatility already subsumes all of the information contained in the historical data and
statistics.
30
The NYMEX uses its deeper financially settled natural gas options to determine volatility for daily
margining purposes, which, as a result, are the volatility estimates EIA will use in its model. NYMEX’s
financially settled natural gas options allow exercise only upon expiry (i.e., the European-style options).
These options have nearly 30 times the volume of the options exercisable into a futures contract. NYMEX
uses the financially settled European-style options as to determine the volatility of the less liquid American-
style options. For crude oil options, the NYMEX inverts a Black (1976) model to solve for the implied
volatility, even though these options are American-style options allowing for exercise at any time during
the options’ life. EIA addresses this issue in endnote 34 below; further research is planned in this area as it
pertains to estimating the parameters of price distributions.
31
See footnote 24 above.
32
See, for example, Figlewski, (2004, particularly p. 79 and 93), and Poon (2005, Chapter 10, p. 115,
Section 10.1 and 10.2). Consistent with Szakmary, et al (2003), the EIA model herein requires an option to
have more than 10 trading days remaining in its life to be used the implied volatility calculation for that
option. See Szakmary, et al (2003, p. 2156 and p. 2159 footnote 11). At- and near-the-money options are
also used in the EIA model, for the reasons explained by Szakmary, et al (2003, p. 2156-57): They “are
least affected by the non-normal distribution of returns….” See Cox and Rubinstein (1985, Chapter 5,
section 8) re option sensitivities to changes in pricing parameters; at- and near-the-money options have the
highest “vega” – the first partial derivative of an option’s premium with respect to change in volatility –
making these the most sensitive options to volatility. See also Poon (2005, Chapter 10) for a discussion of
most-sensitive-option techniques and various weighting schemes vis-à-vis proximity to at-the-money
options employed to extract information from implied volatilities.
33
See Poon (2005, Chapter 10), for a survey of the literature concerning the information content of
different options (at- versus deep-out-of- and in-the-money options, e.g.). Considerable research over a
period spanning more than 30 years into the so-called “volatility smile” – also known as the “skew” –
suggests market participants price options to different volatilities to capture the leptokurtic, or “fat-tailed,”
price distribution that historically is observed in asset markets.
Recent research, particularly at central banks, makes use of the skew to estimate the distribution being
discounted by the options market participants, so as to better gauge the markets’ reactions to monetary
policy innovations. See, e.g., Clews, et al, (2000), for a discussion of central banks’ use of risk-neutral
probability techniques discussed above. See also Bernanke (2004a, particularly p. 14-5): “Financial data
provide insight about market uncertainty that is obtainable nowhere else. For example, the Board’s staff
regularly analyzes the prices of options on eurodollar futures to estimate the degree of uncertainty that
market participants have about monetary policy at different horizons. Indeed, by examining options with
different strike prices, and under some reasonable additional assumptions, one can produce a full
31. Energy Information Administration/Short-Term Energy Outlook Supplement — October 2009
31
probability distribution of market expectations for the level of the federal funds rate at various dates in the
future. Likewise, analysis of various types of options can generate distributions of expectations for
economic and financial variables ranging from oil prices to the exchange value of the dollar to future stock
prices.” Bernanke was referring to the risk-neutral techniques, some of which were refined at the Fed, to
render distributions with higher densities in the tails than would be produced in a constant-variance model.
This technique was first applied to oil markets by Melick and Thomas (1992). This is a topic of future EIA
research. See Jackwerth (2004) and Figlewski (2008) for in-depth discussions of these techniques re
strengths and weaknesses.
34
As an area of future research, EIA will, as part of its benchmarking process, explore whether, for the
purposes of estimating the variance parameter of a price distribution in the EIA model, there is a
meaningful difference between the volatility calculated using an American-style model versus a European-
style model. The standard deviation (volatility) can be tested vis-à-vis its assumed distribution (i.e., it is
assumed to be chi-square distributed per Freund and Walpole (1987, p. 379 - 380), so for the purposes of
our model, we can test whether European-style volatility is statistically different from American-style
volatility in a meaningful way when it comes to parameterizing the distribution. See Jorion (1995, pp. 512
– 514) for a discussion of this issue re using a European model to solve American-style implied volatilies
for foreign exchange futures. Jorion notes the difference between the models is very small. EIA will test
this for energy options in the future.
35
See Jarrow and Rudd (1983, pp. 86 – 93). See also Ritchken (1987, particularly chapters 5, 6, and 8), re
the risk-neutral economic argument. See also Hull (1997, particularly chapters 9, and 11), and Jackwerth
(2004) for further discussion of risk-neutral techniques.
36
The martingale property (or a close approximation thereof) for oil prices was demonstrated in Hamilton
(2009a, pp. 179 – 206). Hamilton estimated several models for quarterly crude oil price changes and price
levels over the period 1970 – 2008 and concludes, “… the broad inference with which we come away is
that the real price of oil is not easy to forecast. To predict the price of oil one quarter, one year, or one
decade ahead, it is not at all naïve to offer as a forecast whatever the price currently happens to be” (p.
181). Later, Hamilton (2009a, p. 184) observes, “It is sometimes argued that if economists really
understand something, they should be able to predict what will happen next. But oil prices are an
interesting example (stock prices are another) of an economic variable which, if our theory is correct, we
should be completely unable to predict.”
37
See Jarrow and Rudd (1983, p. 89).
38
See Ritchken (1987, Chapter 6, beginning on p. 118) re the representation of the geometric Wiener
process and the linear scaling of the mean and variance.
39
This derivation follows Ogawa (1988 pp. 54-55); Jarrow and Rudd (1983, pp. 90-92); and Ritchken
(1987, pp. 173-74).
40
This is a European-style option, i.e., it can be exercised only at expiry. The NYMEX trades American-
style options for crude oil. However, Merton (1973) shows the European and American calls typically
have the same value; since a call typically is worth more alive than dead it does not pay to early exercise.
41
See Bentley Trading Room for tips on using Excel functionality to calculate the 2d term, i.e., the
cumulative normal density (normsdist) function.
42
See Ogawa (1988, pp. 54-56), and Ritchken (1987, pp. 173-74) for derivations. See Hull (1997, Chapter
12, particularly pp. 273-80) re put-call parity.
32. Energy Information Administration/Short-Term Energy Outlook Supplement — October 2009
32
References
Bank for International Settlements, Monetary and Economic Department, OTC
derivatives market activity in the second half of 2008, (May 2009).
Bentley University, “Tutorial for option pricing using the Black Scholes Model,” Bentley
Trading Room.
Bernanke, Ben, “What Policy Makers Can Learn from Asset Prices,” Remarks by Ben S.
Bernanke, Member, Board of Governors of the Federal Reserve System before the
Investment Analyst Society of Chicago, Chicago, IL, April 15, 2004a. (Also available at
What Policy Makers Can Learn from Asset Prices on the Fed’s website.)
Bernanke, Ben, “Oil and the Economy,” Remarks by Governor Ben S. Bernanke at the
Distinguished Lecture Series, Darton, College, Albany, Georgia, October 21, 2004b.
Black, Fischer, “The Pricing of Commodity Contracts,” Journal of Financial Economics,
Vol. 3, (1976), pp. 167-79, reprinted with permission in Interrelations Among Futures,
Option, and Futures Option Markets (1992), the Board of Trade of the City of Chicago
publisher.
Black, Fischer and Myron Scholes, “The Pricing of Options and Corporate Liabilities,”
Journal of Political Economy, Vol. 81, May/June (1973), reprinted with permission in
Interrelations Among Futures, Option, and Futures Option Markets (1992), published by
the Board of Trade of the City of Chicago.
Canina, Linda, and Stephen Figlewski, “The informational content of implied volatility,”
Review of Financial Studies 6, (1993), pp. 659-681.
Clews, Roger, Nikolaos Panigirtzoglou and James Proudman, “Recent developments in
extracting information from options markets,” Bank of England Quarterly Bulletin
(February 2000), pp. 50 – 60.
CME Group, New York Mercantile Exchange, Brochures, re futures markets.
CME Group, New York Mercantile Exchange, Light Sweet Crude Oil Futures and
Natural Gas Futures.
CME Group, New York Mercantile Exchange, Light Sweet Crude Oil Options and
Natural Gas Options.
CME Group, New York Mercantile Exchange, Monthly Volumes.
CME Group, New York Mercantile Exchange, Standard Portfolio Analysis of Risk.
33. Energy Information Administration/Short-Term Energy Outlook Supplement — October 2009
33
Commodity Futures Trading Commission, Commitments of Traders Reports.
Commodity Futures Trading Commission, Hearing on Speculative Position Limits in
Energy Futures Markets, July 29, 2009.
Commodity Futures Trading Commission, Staff Report on Commodity Swap Dealers &
Index Traders with Commission Recommendations (September 2008).
Commodity Futures Trading Commission press release, CFTC Approves Final Rules and
Rule Amendments to Increase Oversight of ECMs (March 2009).
Connexions "Brownian Motion" module by Jason Holden and Kevin Kelly.
Cox, John C., Stephen A. Ross, and Mark Rubinstein, “Option Pricing: A Simplified
Approach,” the Journal of Financial Economics, Vol. 7 (1979), reprinted with permission
in Interrelations Among Futures, Option, and Futures Option Markets (1992), published
by the Board of Trade of the City of Chicago.
Cox, John C., Stephen A. Ross, “The Valuation of Options for Alternative Stochastic
Processes,” Journal of Financial Economics, Vol. 3, (Winter 1976), reprinted with
permission in Interrelations Among Futures, Option, and Futures Option Markets (1992),
published by the Board of Trade of the City of Chicago.
John C. Cox and Mark Rubinstein, Options Markets (1985), Prentice-Hall, Englewood
Cliffs, NJ.
Courtault, Jean-Michel; Yuri Kabanov; Bernard Bru; Pierre Crepel; Isabelle LeBon; and
Arnad Le Marchand, “Louis Bachelier: On the centenary of theorie de la speculation,”
Mathematical Finance, Vol.10, No. 3 (July 2000), 341–353.
Dimson, Elroy and Massoud Mussavian, “A brief history of market efficiency,”
European Financial Management, Volume 4, Number 1, March 1998, pp 91-193.
Dimson, Elroy and Massoud Mussavian, “Three Centuries of Asset Pricing,” Journal of
Banking & Finance (1999), Vol. 23, pp. 1745–1769.
Darrell Duffie, Futures Markets (1989), Prentice Hall, Englewood Cliffs, NJ.
Duffie, Darrell and Stephen Gray, “Volatility in Energy Prices,” in Managing Energy
Price Risk (1995), Risk Publications.
Engle, Robert F., “Risk and Volatility: Econometric Models and Financial Practice,” The
American Economic Review, Vol. 94, Issue 3, (2004), pp. 405-420.
34. Energy Information Administration/Short-Term Energy Outlook Supplement — October 2009
34
Engle, Robert, “New frontiers for ARCH Models,” Prepared for a conference entitled
Modeling and Forecasting Financial Volatility, Perth, Australia, September 2001 (draft
of June 6, 2002).
Eugene F. Fama and Merton H. Miller, The Theory of Finance (1972), Holt, Rinehart &
Winston, New York.
Figlewski, Stephen, “Options Arbitrage in Imperfect Markets,” The Journal of Finance,
Vol. XLIV, No. 5 (December 1989), pp. 1289-1311.
Figlewski, Stephen, “Forecasting Volatility,” monograph dated April 24, 2004.
Figlewski, Stephen, “Estimating the Implied Risk Neutral Density for the U.S. Market
Portfolio,” (July 30, 2008), in Volatility and Time Series Econometrics: Essays in Honor
of Robert F. Engle, Tim Bollerslev, Jeffrey R. Russell and Mark Watson, eds., Oxford,
UK: Oxford University Press, 2008.
John E. Freund and Ronald E. Walpole, Mathematical Statistics, Fourth Edition (1987),
Prentice-Hall Inc., Englewood Cliffs, NJ.
Green, Clifton T., and Stephen Figlewski, “Market Risk and Model Risk for a Financial
Institution Writing Options,” The Journal of Finance, Vol. LIV, No. 4 (August 1999), pp.
1465-1499.
Hamilton, James D., “Understanding Crude Oil Prices,” The Energy Journal, Vol. 30,
No. 2 (2009a), pp. 179 – 206.
Hamilton, James D., “Causes and Consequences of the Oil Shock of 2007-08,” Brookings
Papers on Economic Activity, Spring 2009, February 3, 2009, Revised April 27, 2009b.
Hodge, Tyler, Alex King, Kobi Platt, Modeling Uncertainty in the EIA Short-term
Energy Outlook, presented at the Energy Information Administration’s April 2 – 3, 2009,
meeting of the American Statistical Association Committee on Energy Statistics.
John C. Hull, Options, Futures, and Other Derivatives (1997), Third Edition, Prentice
Hall, Upper Saddle River, NJ.
Interagency Task Force on Commodity Markets, Interim Report on Crude Oil,
Washington D.C. (July 2008).
IntercontinentalExchange, ICE Crude Oil, and ICE Homepage.
Jackwerth, Jens Carsten, “Option-Implied Risk-Neutral Distributions and Risk
Aversion,” monograph dated March 31, 2004, published by Research Foundation of
AIMR.
35. Energy Information Administration/Short-Term Energy Outlook Supplement — October 2009
35
Robert A. Jarrow and Andrew Rudd, Option Pricing (1983), Dow Jones-Irwin,
Homewood, IL.
Jerison, David and Daniel Stroock, “Norbert Wiener,” Notices of the AMS, Vol. 42, No. 4
(April 1995).
Jorion, Philippe, “Predicting Volatility in the Foreign Exchange Market,” The Journal of
Finance, Volume 50, Number 2 (June 1995), pp. 507-28.
Lo, Andrew W., “Efficient Markets Hypothesis,” in The New Palgrave: A Dictionary of
Economics, L. Blume, S. Durlauf, eds,. 2nd Edition, Palgrave Macmillan Ltd. (2007).
Malone, Samuel W., “Alternative Price Processes for Black-Scholes: Empirical Evidence
and Theory,” monograph dated April 19, 2002.
Mandrekar, V., “Mathematical Work of Norbert Wiener,” Notices of the AMS, Vol. 42,
No. 6 (June 1995).
Marek Musiela and Marek Rutkowski, Martingale Methods in Financial Modelling,
Second Edition (2005), Springer-Verlag Berlin Heidelberg.
Margrabe, William, “The Value of an Option to Exchange One Asset for Another,”
Reprinted with permission from The Journal of Finance, Vol. XXXIII, No. 1 (March
1978), in Interrelations Among Futures, Option, and Futures Option Markets (1992),
published by the Board of Trade of the City of Chicago.
Matao, Miyamoto, “The Development of Commerce in the Edo Period,” Journal of
Japanese Trade and Industry (May/June 1999), pp. 38 – 40.
Melick, William and Charles Thomas, “Confidence intervals and constant-maturity series
for probability measures extracted from options prices,” in the Bank of Canada’s 1998
conference “Information in Financial Asset Prices” at Proceedings of a conference held at
the Bank of Canada, May 1998.
Melick, William and Charles Thomas, “War and Peace: Recovering the market’s
probability distribution of crude oil futures prices during the Gulf Crisis,” Board of
Governors of the Federal Reserve System, International Finance Discussion Papers,
Number 437 (October 1992).
Merton, Robert C., “Theory of Rational Option Pricing,” Bell Journal of Economics and
Management Science, Vol. 4 (Spring 1973), reprinted with permission in Interrelations
Among Futures, Option, and Futures Option Markets (1992), published by the Board of
Trade of the City of Chicago.
36. Energy Information Administration/Short-Term Energy Outlook Supplement — October 2009
36
Merton, Robert C., “Applications of option-pricing theory: twenty-five years later,”The
American Economic Review, Vol. 88 No.3 (June 1998), pp. 323-349.
Newell, Richard and William A. Pizer, “Discounting the distant future: how much do
uncertain rates increase valuations?” Journal of Environmental Economics and
Management, Vol. 46 (2003) pp. 52 – 71.
Ogawa, Yoshiki, “Market Expectations Evident in Crude Oil Futures Options,” Center
for Energy Policy Research MIT Energy Laboratory (October 1988).
Poon, Ser-Haung, A practical guide to forecasting financial market volatility, John Wiley
& Sons Ltd. (2005).
Peter Ritchken, Options: Theory, Strategy, and Applications (1987), Scott, Foresman and
Company, Glenview, IL.
Stephen A. Ross, Neoclassical Finance (2004), Princeton University Press.
Samuelson, Paul A., “Proof that Properly Anticipated Prices Fluctuate Randomly,”
Industrial Management Review, Vol. 6 (1965), 41-49.
Scholes, Myron S., “Derivatives in a Dynamic Environment,” The American Economic
Review, Vol. 88, No. 3 (June 1998), pp. 350-370.
Stein, Jeremy, “Overreactions in the Options Market,” The Journal of Finance, Vol.
XLIV, No. 4 (September 1989), pp 1011 – 1023.
Szakmary, Andrew; Evren Ors; Jin Kyoung Kim, and Wallace N. Davidson III, “The
predictive power of implied volatility: Evidence from 35 futures markets,” Journal of
Banking & Finance, Vol. 27 (2003), pp. 2151-75.
Weinberg, Steven A., “Interpreting the Volatility Smile: An Examination of the
Information Content of Option Prices,” Board of Governors of the Federal Reserve
System, International Finance Discussion Papers, Number 7-6 (August 2001).
Williams, Jeffrey, The economic function of futures markets (1989), Cambridge
University Press, Cambridge.
Working, Holbrook, “New Concepts Concerning Futures Markets and Prices,” American
Economic Review (June 1962), which is reprinted with permission in Selected Writings of
Holbrook Working (1977), published by the Board of Trade of the City of Chicago.
Working, Holbrook, “The Investigation of Economic Expectations,” American Economic
Review Proceedings, Vol. 39 (May 1949), pp. 150-66.
37. Energy Information Administration/Short-Term Energy Outlook Supplement — October 2009
37
Working, Holbrook, “A Random-Difference Series for Use in the Analysis of Time
Series,” Journal of the American Statistical Association (March 1934), Vol. 29, pp. 11 –
24.