

Empfohlen
Empfohlen
Weitere ähnliche Inhalte
Was ist angesagt?
Was ist angesagt? (20)
Andere mochten auch
Ähnlich wie Week five assignment wiley plus
Ähnlich wie Week five assignment wiley plus (20)
Kürzlich hochgeladen
Kürzlich hochgeladen (20)
Week five assignment wiley plus
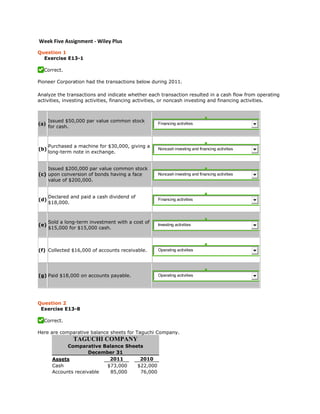
- 1. Week Five Assignment - Wiley Plus Question 1 Exercise E13-1 Correct. Pioneer Corporation had the transactions below during 2011. Analyze the transactions and indicate whether each transaction resulted in a cash flow from operating activities, investing activities, financing activities, or noncash investing and financing activities. (a) Issued $50,000 par value common stock for cash. Financing activities (b) Purchased a machine for $30,000, giving a long-term note in exchange. Noncash investing and financing activities (c) Issued $200,000 par value common stock upon conversion of bonds having a face value of $200,000. Noncash investing and financing activities (d) Declared and paid a cash dividend of $18,000. Financing activities (e) Sold a long-term investment with a cost of $15,000 for $15,000 cash. Investing activities (f) Collected $16,000 of accounts receivable. Operating activities (g) Paid $18,000 on accounts payable. Operating activities Question 2 Exercise E13-8 Correct. Here are comparative balance sheets for Taguchi Company. TAGUCHI COMPANY Comparative Balance Sheets December 31 Assets 2011 2010 Cash $73,000 $22,000 Accounts receivable 85,000 76,000
- 2. Inventories 170,000 189,000 Land 75,000 100,000 Equipment 260,000 200,000 Accumulated depreciation (66,000) (32,000) Total $597,000 $555,000 Liabilities and Stockholders' Equity Accounts payable $39,000 $47,000 Bonds payable 150,000 200,000 Common stock ($1 par) 216,000 174,000 Retained earnings 192,000 134,000 Total $597,000 $555,000 Additional information: 1. Net income for 2011 was $103,000. 2. Cash dividends of $45,000 were declared and paid. 3. Bonds payable amounting to $50,000 were redeemed for cash $50,000. 4. Common stock was issued for $42,000 cash. 5. No equipment was sold during 2011, but land was sold at cost. Complete the statement of cash flows for 2011 using the indirect method. (List amounts from largest positive to smallest positive followed by most negative to least negative, e.g. 15, 14, 10, -17, -5, -1. If amount decreases cash flow, use either a negative sign preceding the number e.g. -45 or parentheses e.g. (45).) TAGUCHI COMPANY Statement of Cash Flows For the Year Ended December 31, 2011 Cash flows from operating activities Net income $ 103,000 Adjustments to reconcile net income to net cash provided by operating activities Depreciation expense $ 34,000 Decrease in inventory 19,000 Increase in accounts receivable (9,000) Decrease in accounts payable (8,000) 36,000 Net cash provided by operating activities 139,000
- 3. Cash flows from investing activities Sale of land 25,000 Purchase of equipment (60,000) Net cash used by investing activities (35,000) Cash flows from financing activities Issuance of common stock 42,000 Redemption of bonds (50,000) Payments of cash dividends (45,000) Net cash used by financing activities (53,000) Net increase in cash 51,000 Cash at beginning of period 22,000 Cash at end of period $ 73,000 Question 3 Exercise E14-1 Correct. Financial information for Blevins Inc. is presented below. December 31, 2012 December 31, 2011 Current assets $125,000 $100,000 Plant assets (net) 396,000 330,000 Current liabilities 91,000 70,000 Long-term liabilities 133,000 95,000 Common stock, $1 par 161,000 115,000 Retained earnings 136,000 150,000 Complete the schedule showing a horizontal analysis for 2012 using 2011 as the base year. (If amount is a decrease, use either a negative sign preceding the number eg -45 or parentheses eg (45). Round percentages to 1 decimal place, e.g. 10.5. List items in the order given in the question.)
- 4. BLEVINS INC. Condensed Balance Sheet December 31 Increase or (Decrease) 2012 2011 Amount Percentage Assets Current assets $ 125,000 $ 100,000 $ 25,000 25.0 % Plant assets (net) 396,000 330,000 66,000 20.0 % Total assets $ 521,000 $ 430,000 $ 91,000 21.2 % Liabilities Current liabilities $ 91,000 $ 70,000 $ 21,000 30.0 % Long-term liabilities 133,000 95,000 38,000 40.0 % Total liabilities $ 224,000 $ 165,000 $ 59,000 35.8 % Stockholders' Equity Common stock, $1 par $ 161,000 $ 115,000 $ 46,000 40.0 % Retained earnings 136,000 150,000 (14,000) (9.3) % Total stockholders’ equity $ 297,000 $ 265,000 $ 32,000 12.1 % Total liabilities and stockholders' equity $ 521,000 $ 430,000 $ 91,000 21.2 % Question 4 Problem P13-9A Correct. Condensed financial data of Arma Inc. follow. ARMA INC. Comparative Balance Sheets December 31 Assets 2011 2010 Cash $90,800 $48,400 Accounts receivable 92,800 33,000 Inventories 112,500 102,850 Prepaid expenses 28,400 26,000 Investments 138,000 114,000 Plant assets 270,000 242,500 Accumulated depreciation (50,000) (52,000) Total $682,500 $514,750 Liabilities and Stockholders' Equity
- 5. Accounts payable $112,000 $67,300 Accrued expenses payable 16,500 17,000 Bonds payable 110,000 150,000 Common stock 220,000 175,000 Retained earnings 224,000 105,450 Total $682,500 $514,750 ARMA INC. Income Statement For the Year Ended December 31, 2011 Sales $392,780 Less: Cost of goods sold $135,460 Operating expenses, excluding depreciation 12,410 Depreciation expense 46,500 Income taxes 27,280 Interest expense 4,730 Loss on sale of plant assets 7,500 233,880 Net income $158,900 Additional information: 1. New plant assets costing $85,000 were purchased for cash during the year. 2. Old plant assets having an original cost of $57,500 were sold for $1,500 cash. 3. Bonds matured and were paid off at face value for cash. 4. A cash dividend of $40,350 was declared and paid during the year. Complete the statement of cash flows using the indirect method. (List amounts from largest positive to smallest positive followed by most negative to least negative, e.g. 15, 14, 10, - 17, -5, -1. If amount decreases cash flow, use either a negative sign preceding the number e.g. -45 or parentheses e.g. (45).) ARMA INC. Statement of Cash Flows For the Year Ended December 31, 2011 Cash flows from operating activities Net income $ 158,900 Adjustments to reconcile net income to net cash provided by operating activities Depreciation expense $ 46,500 Increase in accounts payable 44,700
- 6. Loss on sale of plant assets 7,500 Increase in accounts receivable (59,800) Increase in inventory (9,650) Increase in prepaid expenses (2,400) Decrease in accrued expenses payable (500) 26,350 Net cash provided by operating activities 185,250 Cash flows from investing activities Sale of plant assets 1,500 Purchase of plant assets (85,000) Purchase of investments (24,000) Net cash used by investing activities (107,500) Cash flows from financing activities Sale of common stock 45,000 Payment of cash dividends (40,350) Redemption of bonds (40,000)
- 7. Net cash used by financing activities (35,350) Net increase in cash 42,400 Cash at beginning of period 48,400 Cash at end of period $ 90,800 Question 5 Problem P13-10A Correct. Condensed financial data of Arma Inc. follow. ARMA INC. Comparative Balance Sheets December 31 Assets 2011 2010 Cash $90,800 $48,400 Accounts receivable 92,800 33,000 Inventories 112,500 102,850 Prepaid expenses 28,400 26,000 Investments 138,000 114,000 Plant assets 270,000 242,500 Accumulated depreciation (50,000) (52,000) Total $682,500 $514,750 Liabilities and Stockholders' Equity Accounts payable $112,000 $67,300 Accrued expenses payable 16,500 17,000 Bonds payable 110,000 150,000 Common stock 220,000 175,000 Retained earnings 224,000 105,450 Total $682,500 $514,750 ARMA INC. Income Statement For the Year Ended December 31, 2011 Sales $392,780 Less: Cost of goods sold $135,460 Operating expenses, excluding depreciation 12,410 Depreciation expense 46,500 Income taxes 27,280 Interest expense 4,730 Loss on sale of plant assets 7,500 233,880 Net income $158,900
- 8. Additional information: 1. New plant assets costing $85,000 were purchased for cash during the year. 2. Old plant assets having an original cost of $57,500 were sold for $1,500 cash. 3. Bonds matured and were paid off at face value for cash. 4. A cash dividend of $40,350 was declared and paid during the year. Further analysis reveals that accounts payable pertain to merchandise creditors. Complete the statement of cash flows for Arma Inc. using the direct method. (List amounts from largest positive to smallest positive followed by most negative to least negative, e.g. 15, 14, 10, -17, -5, -1. If amount decreases cash flow for financing and investing activities, use either a negative sign preceding the number e.g. -45 or parentheses e.g. (45). List all other amounts as positive.) ARMA INC. Statement of Cash Flows For the Year Ended December 31, 2011 Cash flows from operating activities Cash receipts from customers $ 332,980 Less cash payments To suppliers $ 100,410 For income taxes 27,280 For operating expenses 15,310 For interest 4,730 147,730 Net cash provided by operating activities 185,250 Cash flows from investing activities Sale of plant assets 1,500 Purchase of plant assets (85,000) Purchase of investments (24,000) Net cash used by investing activities (107,500) Cash flows from financing activities
- 9. Sale of common stock 45,000 Payment of cash dividends (40,350) Redemption of bonds (40,000) Net cash used by financing activities (35,350) Net increase in cash 42,400 Cash at beginning of period 48,400 Cash at end of period $ 90,800 Question 6 Problem P14-2A Correct. The comparative statements of Villa Tool Company are presented below. VILLA TOOL COMPANY Income Statement For the Year Ended December 31 2012 2011 Net sales $1,818,500 $1,750,500 Cost of goods sold 1,011,500 996,000 Gross profit 807,000 754,500 Selling and administrative expense 516,000 479,000 Income from operations 291,000 275,500 Other expenses and losses Interest expense 18,000 14,000 Income before income taxes 273,000 261,500 Income tax expense 81,000 77,000 Net income $ 192,000 $ 184,500 VILLA TOOL COMPANY Balance Sheets December 31 Assets 2012 2011 Current assets Cash $ 60,100 $ 64,200 Short-term investments 69,000 50,000 Accounts receivable (net) 117,800 102,800
- 10. Inventory 123,000 115,500 Total current assets 369,900 332,500 Plant assets (net) 600,300 520,300 Total assets $970,200 $852,800 Liabilities and Stockholders' Equity Current liabilities Accounts payable $160,000 $145,400 Income taxes payable 43,500 42,000 Total current liabilities 203,500 187,400 Bonds payable 200,000 200,000 Total liabilities 403,500 387,400 Stockholders' equity Common stock ($5 par) 280,000 300,000 Retained earnings 286,700 165,400 Total stockholders' equity 566,700 465,400 Total liabilities and stockholders' equity $970,200 $852,800 Compute the following ratios for 2012. (Weighted average common shares in 2012 were 57,000, and all sales were on account.) (Round earnings per share, current ratio and acid-test ratio to 2 decimal places, e.g. 10.50. Round other answers to 1 decimal place, e.g. 10.5.) (a) Earnings per share $ 3.37 (b) Return on common stockholders' equity 37.2 % (c) Return on assets 21.1 % (d) Current 1.82 :1 (e) Acid-test 1.21 :1 (f) Receivables turnover 16.5 times (g) Inventory turnover 8.5 times (h) Times interest earned 16.2 times (i) Asset turnover 2.0 times (j) Debt to total assets 41.6 %