2015 Global Threat Intelligence Report - an analysis of global security trends
•
0 gefällt mir•720 views

The 2015 Global Threat Intelligence Report is an annual report which gives an overview of the biggest threats, and most prominent trends in the cyber security landscape.
Empfohlen

Empfohlen
Weitere ähnliche Inhalte
Was ist angesagt?
Was ist angesagt? (20)
Ähnlich wie 2015 Global Threat Intelligence Report - an analysis of global security trends
Ähnlich wie 2015 Global Threat Intelligence Report - an analysis of global security trends (20)
Mehr von DImension Data
Mehr von DImension Data (20)
Kürzlich hochgeladen
Kürzlich hochgeladen (20)
2015 Global Threat Intelligence Report - an analysis of global security trends
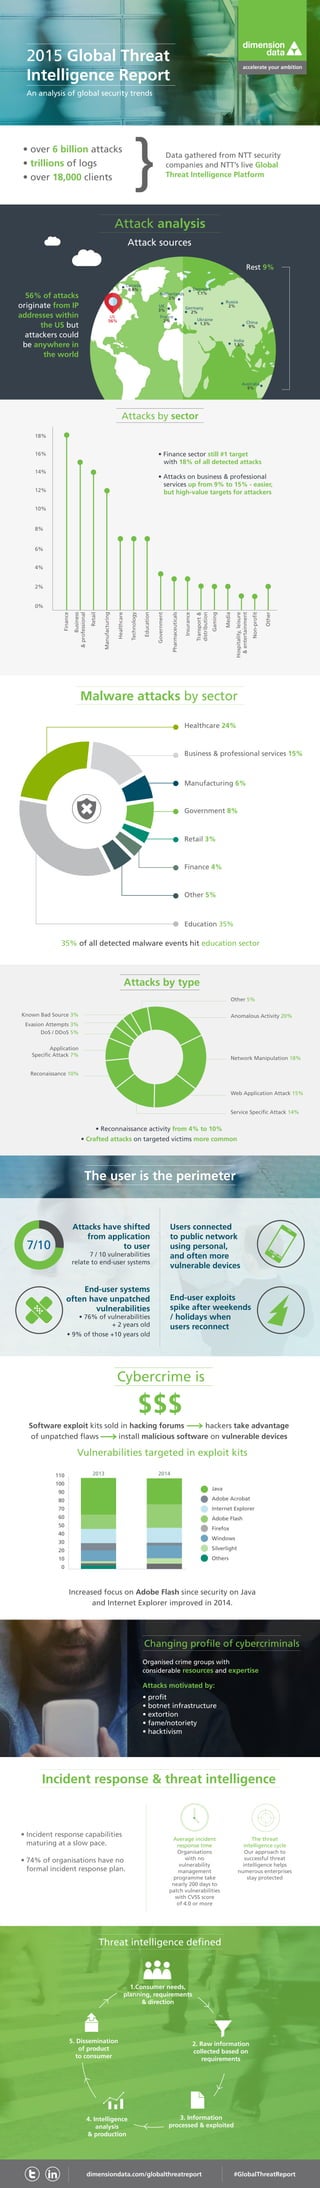
- 1. Vulnerabilities targeted in exploit kits Healthcare 24% Business & professional services 15% Manufacturing 6% Government 8% Retail 3% Finance 4% Other 5% Education 35% 2015 Global Threat Intelligence Report An analysis of global security trends • over 6 billion attacks • trillions of logs • over 18,000 clients 56% of attacks originate from IP addresses within the US but attackers could be anywhere in the world • Finance sector still #1 target with 18% of all detected attacks Attacks have shifted from application to user 7 / 10 vulnerabilities relate to end-user systems Users connected to public network using personal, and often more vulnerable devices End-user exploits spike after weekends / holidays when users reconnect End-user systems often have unpatched vulnerabilities • 76% of vulnerabilities + 2 years old • 9% of those +10 years old Data gathered from NTT security companies and NTT’s live Global Threat Intelligence Platform Attack analysis Attack sources Attacks by sector Malware attacks by sector 35% of all detected malware events hit education sector The user is the perimeter 7/10 Software exploit kits sold in hacking forums hackers take advantage of unpatched flaws install malicious software on vulnerable devices Cybercrime is Changing profile of cybercriminals Organised crime groups with considerable resources and expertise Attacks motivated by: • profit • botnet infrastructure • extortion • fame/notoriety • hacktivism Incident response & threat intelligence Threat intelligence defined • Incident response capabilities maturing at a slow pace. • 74% of organisations have no formal incident response plan. Average incident response time Organisations with no vulnerability management programme take nearly 200 days to patch vulnerabilities with CVSS score of 4.0 or more The threat intelligence cycle Our approach to successful threat intelligence helps numerous enterprises stay protected 2. Raw information collected based on requirements 3. Information processed exploited 4. Intelligence analysis production 1.Consumer needs, planning, requirements direction 5. Dissemination of product to consumer Finance 0% 2% 4% 8% 10% 12% 14% 16% 18% 6% Business professional Manufacturing Retail Healthcare Technology Education Government Pharmaceuticals Insurance Transport distribution Gaming Media Hospitality,leisure entertainment Non-profit Other • Reconnaissance activity from 4% to 10% • Crafted attacks on targeted victims more common Java Adobe Acrobat Internet Explorer Adobe Flash Firefox Windows Silverlight Others Increased focus on Adobe Flash since security on Java and Internet Explorer improved in 2014. 2013 2014110 100 90 80 70 60 50 40 30 20 10 0 dimensiondata.com/globalthreatreport #GlobalThreatReport US 56% China 9% France 2% India 1.5% Germany 2% Netherlands 2% Denmark 1.1% Russia 2% Ukraine 1.3% Canada 0.9% Australia 9% Rest 9% • Attacks on business professional services up from 9% to 15% - easier, but high-value targets for attackers $$ $ Other 5% Known Bad Source 3% Evasion Attempts 3% DoS / DDoS 5% Application Specific Attack 7% Reconaissance 10% Anomalous Activity 20% Network Manipulation 18% Web Application Attack 15% Service Specific Attack 14% Attacks by type UK 3%