SlideShare ist ein Scribd-Unternehmen logo
1 von 19
The Metrics Lifecycle Questions before starting to use metrics are: * Who will use these metrics? * What behavior are you trying to promote with these metrics? * What information is important to know across the project/enterprise? * What requires increased visibility or transparency?
Inception 6/2010 Interim  1/2011 Comprehensive 6/2011 Test Planning Test Creation Test Execution Defect  Management Configuration Management Cost  – Project, BA, Dev, QA  Test Scripts Built Pass, Failed, Risk* # Scripts, Timeline Status, Severity Check Points, Test Plan,  Traceability Matrix  Trend, Block, No Runs BA/Dev/Bus Accepted/Rejected Test Automation Discovery Rate, Removal Rate, Trend, QA Impact (time, testers) Uptime, Domain Version verification, Release Notes  Removal Cost,  Root Cause BA/Dev/Bus Accepted/Rejected Build Cost  # Scripts, Timeline Pass, Failed, Usage Artifact  Lockdown Sample Metrics  Stability Report Automation Save S C O R E C A R D
Process  Overview   Review Data Points with teams*.  If Data are not captured, process is defined.   Data is saved to a shared space On QC  Data identity is defined  (QC Project, Project ID, Date stamp, etc.)   Teams or process create sheets.   QM collects all reports, consolidates, reviews with teams and sends  result to PGM.    Automated    Process (QTP, Excel Marco, etc.) to upload sheets into Master sheet.    Macro/QM consolidates information   Naming  Standards  -  Sheet Name (Team-Date-Test Metrics- Project)    Shared Space Location Name and Access Initial Not On QC How Manual
Summary Detail Project View  Execution/Defect Overview Report Initial Test Execution AE/PE  < 10% AE/PE  < 20% AE/PE  > 30% ▲  ▬▬  ▼ Trend  Defects defect/test executed < 10% defect/test executed < 20% defect/test executed > 30% Not In QC   Overall Progress DF % + TEP % + Risk < 10% DF % + TEP % + Risk < 20% DF % + TEP % + Risk > 30% In QC   Sheet Key FID Project View  4/1/2010 Total Tests Planned To Date Execution Actual To Date Execution Defects Test Execution Progress Defects Overall Test Progress # of test cases % of Total % of Total % of Total Commodities 55 24% 36% 15% ▲ ▲ ▲ Credit 70 43% 36% 4% ▬▬ ▬▬ ▬▬ GFX 120 64% 37% 57% ▼ ▬▬ ▲ Project ABC  245 49% 36% 33% ▼ ▬▬ ▲                 Commodities 100 60% 54% 9% ▲ ▲ ▲ Credit 83 53% 46% 18% ▬▬ ▬▬ ▬▬ Rates 120 64% 45% 7% ▼ ▲ ▬▬ Project XYZ  303 60% 48% 11% ▼ ▲ ▬▬                 FID Project View  4/1/2010 Total Tests Planned To Date Execution Actual To Date Execution Defects Test Execution Progress Defects Overall Test Progress # of test cases % of Total % of Total % of Total Project ABC  245 49% 36% 33% ▼ ▬▬ ▲                 Project XYZ  303 60% 48% 11% ▼ ▲ ▬▬                
Summary Detail Product View  Execution/Defect Overview Report FID Product View  4/1/2010 Total Tests Planned Execution Actual Execution Defects  Test Execution Progress Defects Open Defects Overall Test Progress # of test cases % of Total % of Total % of Total ABC 55 24% 36% 10% ▲ ▲ ▬▬ ▲ XYZ 100 65% 52% 13% ▲ ▲ ▼ ▼ Commodities 155 50% 46% 13% ▼ ▬▬ ▬▬ ▲ ABC 70 23% 36% 1% ▲ ▲ ▬▬ ▬▬ XYZ 200 48% 26% 18% ▲ ▲ ▬▬ ▬▬ Credit 27000% 41% 29% 13% ▲ ▲ ▬▬ ▬▬ FID Product View  4/1/2010 Total Tests Planned Execution Actual Execution Defects  Test Execution Progress Defects Open Defects Overall Test Progress # of test cases % of Total % of Total % of Total Commodities 155 50% 46% 13% ▼ ▬▬ ▬▬ ▲ Credit 270 41% 29% 13% ▲ ▲ ▬▬ ▬▬
Process Overview All test teams on QC or compliant tool on an open architecture. New metrics defined and prioritized. QM teams generates report, verifies with team and sends to PGM. How Used Defined Fields added and populated, workflows created, folder  structures and added to QC project template. New metrics may require a data pass or bridge to other tools.    (Configuration Management, Project Management, Remedy, etc,) Teams Trained* Dry Run* Interim   Interim
June 1, 2009 Interim
Interim
Interim April Release - ETL  Total Cases % Actual Executed  % Plan  Executed # Passed % Passed  (not including Blocked and No Run) # Failed # No Run Not Executed # Blocked Active  DRS Total DRs CIT  12/12 - 1/30 341 71% 100% 225 93% 18 73 25 0 29 82 SIT 2/2 - 2/27 385 6% 100% 18 75% 6 351 10 0 0 2 Show Stopper High Medium Low Total DR Status  Total   58 22   82 Active New     2   2 Ready For Review 2 3 4   9 Ready For Development   1 3   4 In QA   8 5   13 Re-Open     1   1 Total   12 15   29 Closed  Withdrawn   10 4 14 Completed   36 3 39 Total   46 7 53
Traceability By Requirements Interim PCR-PCR Title Total Cases Not Completed Passed Failed N/A No Run Test Blocked Active Dr's %  Completed %  In Progress Comments PCR88890  - Stage to OLTP ETL Interface 67               0.00% 0.00%   PCR 88891  - Type Table Manager ETL Interface 1               0.00% 0.00%   PCR 88892  - ADIM to OrgMart DDL & DML scripts 1               0.00% 0.00%   PCR88893  - OrgMart to BPS ETL Interface 12               0.00% 0.00%   PCR88894  - OrgMart to Entitlements ETL Interface 13               0.00% 0.00%   PCR88993  - ADIM to OrgMart Stage ETL Interface 140               0.00% 0.00%   PCR89092  - Oracle Views for OMDS 29               0.00% 0.00%   PCR89093  - Data Patches Phase 1 1               0.00% 0.00%   PCR89094  - Data Patches Final non-HR Update 4               0.00% 0.00%   PCR89095  - Export to ADIM ETL interface 100               0.00% 0.00%   PCR89096  - CMD, FSL, B2C Exports ETL/Views impact 1               0.00% 0.00%   PCR89629  - SSRS Reports impact 16               0.00% 0.00%   Total 385 0 0 0 0 0 0 0 0.00% 0.00%  
Process Overview All test teams on QC or compliant tool on an open architecture. New metrics defined and prioritized span Test Management, time utilization of BA/Dev/QA and cost analysis. How Data is identified, workflows created to capture and maintain the data. Applications may need to be modified or acquired to support metric. Teams Trained* Dry Run* Comprehensive
Comprehensive     Mar-10 Feb-10 Jan-10 Dec-10 BRDs/PCRs  39 28 23 43           Number of Defects in QA 118 76 30 54 Number of Defects in UA 9 2 0 7 Total Prod Fix BRDs in the Post Release   57 2 7 Total    135 32 68           Defect Efficiency   (DR Hours/PCR Hours) 42% 25% 30% 21%           Total Number of Builds In QA  3 5 4 10 Total Number of Hot Fixes  -  Production   1 0 0 Severity  Mar Feb Jan Dec ShowStopper  2 3 1 6 High  73 52 19 33 Medium  33 15 7 13 Low  10 6 3 2 Total  118 76 30 54
Comprehensive   Release date Total Hours (PCR + DRs) 12127 5107 5644 5349 12603             Total Effort SA (Hrs) 886 156 321 474 894 Total Effort Dev (Hrs) 3172 630 1578 481 1098 Total Effort QA (Hrs) 6217 2820 2355 3155 8446 Total PCR Effort (Hrs) 10275 3606 4254 4110 10438             DRs  Total Effort SA (Hrs) 135 267 321 244 200 Total Effort Dev (Hrs) 1353 893 771 703 1470 Total Effort QA (Hrs) 364 341 298 292 495 Total DR Effort (Hrs) 1852 1501 1390 1239 2165             Defect Effort (Hrs)   42% 25% 30% 21%         Total Showstopper Defects 11 2 3 1 6 Total High Defects 112 54 52 19 33 Total Medium Defects 59 10 15 7 13 Total Low Defects 16 7 6 3 2 Deferred DRs 20 45 0 88   Total Overall Defects 218 118 76 118 54       Total Number of Prod Fix BRDs discovered during QA Cycle 31 35 4 17               Number of Defects Withdrawn 39 26 18 2 8             Number of Actual Defects Resolved in Pre Release   24 45 116 46 QA Defect Detection Duration (Hours per Defect) 32.72 34.39 37.98 70.11 183.61             Environment Issues (QA) 7 6 5 6 11 Environment Issues (IT) 2 4 4 5 5 Total Environment Issues 9 10 9 11 16             Differed DRs converted in Prod Fix BRDs  19 6 10 1   Pre Release Metrics Mar Feb Jan Dec Nov Release date
Comprehensive   Defect Type           3rd party 1 3 2 2 3 Architectural Design/Technical specs 3 0     2 Business Requirement/Project scope   2       Coding 19 7 7 5 14 db Patch issue/Incorrect Push   0       Existing production issue   0       Functional Specification 15 7 6 5 8 Technical Specification 7 5 2     Other 136 74 98 44 19 Build Process   0       Training   0       Configuration 2 1 1     Environment issue   0       BLANK 35 19       TOTAL 218 118 116 56 46         UAT       DRs Opened in Viper 0 0 2 0 7             Test Cases Executed  20 13   19   Passed 13 9 8   Failed  7 4   2   No Run 0 0   9               Functional Test Cases Reviewed  339 505 236 159 121 Accepted 336 478 229 129 72 Rejected 3 27 7 30 46                     Functional Test Results Reviewed  148 90 178 112 41 Accepted 128 90 169 98 30 Rejected 20 0 9 14 11             Integration Test Results Reviewed 35 51 178 112 41 Accepted 19 35 169 98 30 Rejected 16 16 9 14 11 Pre Release Metrics Mar Feb Jan Dec Nov Release date
A version collection tool is used to track all web service and UI versions in the QA, IT, and ST environments on a daily basis. Comprehensive
Comprehensive
[object Object],[object Object],[object Object],[object Object],Comprehensive
Requirements Tracking Comprehensive   PCR # PCR Status PCR Title 89833 New NexOS - OrgMart 2.0 - Web Services Development 94123 New NexOS DB - OrgMart 2.0 -  UI Oracle API Phase 2 91076 In Analysis NexOS DB OrgMart 2.0 Config Data cleanup and Oracle API Changes 94216 In Analysis NexOS Tools & Admin - OrgMart 2.0 Data Transformation and Services 89094 Pending Estimation NexOS DB - OrgMart 2.0 - P - Data Patches Final non-HR Update 89282 In Development NexOS DB - OrgMart 2.0 - P - Oracle Merge scripts to sync ORGMART_PROD to ORGMART (lower environments only) 90222 In Development NexOS DB - OrgMart 2.0 - Oracle PL/SQL API Packages referencing HR schema impact 91080 In Development NexOS DB OrgMart 2.0 Config to OrgMart Oracle API Changes 88890 In QA NexOS DB - OrgMart 2.0 - P - Stage to OLTP ETL Interface 88891 In QA NexOS DB - OrgMart 2.0 - P - Type Table Manager ETL Interface 88892 In QA NexOS DB - OrgMart 2.0 - P - ADIM to OrgMart DDL & DML scripts 88893 In QA NexOS DB - OrgMart 2.0 - P - OrgMart to BPS ETL Interface 88894 In QA NexOS DB - OrgMart 2.0 - P - OrgMart to Entitlements ETL Interface 88993 In QA NexOS DB - OrgMart 2.0 - P - ADIM to OrgMart Stage ETL Interface 89092 In QA NexOS DB - OrgMart 2.0 - P - Oracle Views for OMDS 89093 In QA NexOS DB - OrgMart 2.0 - P - Data Patches Phase 1 89095 In QA NexOS DB - OrgMart 2.0 - P - Export to ADIM ETL interface 89096 In QA NexOS DB - OrgMart 2.0 - P - CMD, FSL, B2C Exports ETL/Views impact 89097 In QA NexOS DB - OrgMart 2.0 - P - Marketing ETL Export interface impact 89247 In QA NexOS DB - OrgMart 2.0 - P - UI Oracle API 89248 In QA NexOS DB - OrgMart 2.0 - P - SuperMarvin Oracle API 89396 In QA NexOS DB - OrgMart 2.0 - P - Oracle API for LandSafe 89629 In QA NexOS DB - OrgMart 2.0 - P - SSRS Reports impact 91069 In QA NexOS DB OrgMart 2.0 Config Pipeline Delegation functionality XFER to iPipe
 

Weitere ähnliche Inhalte

Was ist angesagt?

Software testing metrics
Software testing metricsSoftware testing metrics
Software testing metricsDavid O' Connor
 
What is Test Matrix?
What is Test Matrix?What is Test Matrix?
What is Test Matrix?QA InfoTech
 
Innovations in Test Automation: It’s Not All about Regression
Innovations in Test Automation: It’s Not All about RegressionInnovations in Test Automation: It’s Not All about Regression
Innovations in Test Automation: It’s Not All about RegressionTechWell
 
Software Testing - Defect Metrics & Analysis
Software Testing - Defect Metrics & AnalysisSoftware Testing - Defect Metrics & Analysis
Software Testing - Defect Metrics & AnalysisOAK Systems Pvt Ltd
 
Learn software testing with tech partnerz 3
Learn software testing with tech partnerz 3Learn software testing with tech partnerz 3
Learn software testing with tech partnerz 3Techpartnerz
 
'Houston We Have A Problem' by Rien van Vugt & Maurice Siteur
'Houston We Have A Problem' by Rien van Vugt & Maurice Siteur'Houston We Have A Problem' by Rien van Vugt & Maurice Siteur
'Houston We Have A Problem' by Rien van Vugt & Maurice SiteurTEST Huddle
 
Metrics for manual testing
Metrics for manual testingMetrics for manual testing
Metrics for manual testingAnup Panigrahi
 
Test planning & estimation
Test planning & estimationTest planning & estimation
Test planning & estimationLeslie Smart
 
Rob Baarda - Are Real Test Metrics Predictive for the Future?
Rob Baarda - Are Real Test Metrics Predictive for the Future?Rob Baarda - Are Real Test Metrics Predictive for the Future?
Rob Baarda - Are Real Test Metrics Predictive for the Future?TEST Huddle
 
T19 performance testing effort - estimation or guesstimation revised
T19   performance testing effort - estimation or guesstimation revisedT19   performance testing effort - estimation or guesstimation revised
T19 performance testing effort - estimation or guesstimation revisedTEST Huddle
 
ISTQB / ISEB Foundation Exam Practice - 2
ISTQB / ISEB Foundation Exam Practice - 2ISTQB / ISEB Foundation Exam Practice - 2
ISTQB / ISEB Foundation Exam Practice - 2Yogindernath Gupta
 
Robert Magnusson - TMMI Level 2 - A Practical Approach
Robert Magnusson - TMMI Level 2 -  A Practical ApproachRobert Magnusson - TMMI Level 2 -  A Practical Approach
Robert Magnusson - TMMI Level 2 - A Practical ApproachTEST Huddle
 
software project management Software inspection
software project management Software inspectionsoftware project management Software inspection
software project management Software inspectionREHMAT ULLAH
 
IT Quality Testing and the Defect Management Process
IT Quality Testing and the Defect Management ProcessIT Quality Testing and the Defect Management Process
IT Quality Testing and the Defect Management ProcessYolanda Williams
 
Michael Snyman - Software Test Automation Success
Michael Snyman - Software Test Automation Success Michael Snyman - Software Test Automation Success
Michael Snyman - Software Test Automation Success TEST Huddle
 
Introduction to ISTQB & ISEB Certifications
Introduction to ISTQB & ISEB CertificationsIntroduction to ISTQB & ISEB Certifications
Introduction to ISTQB & ISEB CertificationsYogindernath Gupta
 

Was ist angesagt? (20)

Software testing metrics
Software testing metricsSoftware testing metrics
Software testing metrics
 
Testing Metrics
Testing MetricsTesting Metrics
Testing Metrics
 
What is Test Matrix?
What is Test Matrix?What is Test Matrix?
What is Test Matrix?
 
Innovations in Test Automation: It’s Not All about Regression
Innovations in Test Automation: It’s Not All about RegressionInnovations in Test Automation: It’s Not All about Regression
Innovations in Test Automation: It’s Not All about Regression
 
Software Testing - Defect Metrics & Analysis
Software Testing - Defect Metrics & AnalysisSoftware Testing - Defect Metrics & Analysis
Software Testing - Defect Metrics & Analysis
 
Learn software testing with tech partnerz 3
Learn software testing with tech partnerz 3Learn software testing with tech partnerz 3
Learn software testing with tech partnerz 3
 
[Paul Holland] Bad Metrics and What You Can Do About It
[Paul Holland] Bad Metrics and What You Can Do About It[Paul Holland] Bad Metrics and What You Can Do About It
[Paul Holland] Bad Metrics and What You Can Do About It
 
'Houston We Have A Problem' by Rien van Vugt & Maurice Siteur
'Houston We Have A Problem' by Rien van Vugt & Maurice Siteur'Houston We Have A Problem' by Rien van Vugt & Maurice Siteur
'Houston We Have A Problem' by Rien van Vugt & Maurice Siteur
 
Metrics for manual testing
Metrics for manual testingMetrics for manual testing
Metrics for manual testing
 
Test planning & estimation
Test planning & estimationTest planning & estimation
Test planning & estimation
 
Rob Baarda - Are Real Test Metrics Predictive for the Future?
Rob Baarda - Are Real Test Metrics Predictive for the Future?Rob Baarda - Are Real Test Metrics Predictive for the Future?
Rob Baarda - Are Real Test Metrics Predictive for the Future?
 
T19 performance testing effort - estimation or guesstimation revised
T19   performance testing effort - estimation or guesstimation revisedT19   performance testing effort - estimation or guesstimation revised
T19 performance testing effort - estimation or guesstimation revised
 
[Vu Van Nguyen] Test Estimation in Practice
[Vu Van Nguyen]  Test Estimation in Practice[Vu Van Nguyen]  Test Estimation in Practice
[Vu Van Nguyen] Test Estimation in Practice
 
ISTQB / ISEB Foundation Exam Practice - 2
ISTQB / ISEB Foundation Exam Practice - 2ISTQB / ISEB Foundation Exam Practice - 2
ISTQB / ISEB Foundation Exam Practice - 2
 
Robert Magnusson - TMMI Level 2 - A Practical Approach
Robert Magnusson - TMMI Level 2 -  A Practical ApproachRobert Magnusson - TMMI Level 2 -  A Practical Approach
Robert Magnusson - TMMI Level 2 - A Practical Approach
 
software project management Software inspection
software project management Software inspectionsoftware project management Software inspection
software project management Software inspection
 
IT Quality Testing and the Defect Management Process
IT Quality Testing and the Defect Management ProcessIT Quality Testing and the Defect Management Process
IT Quality Testing and the Defect Management Process
 
[HCMC STC Jan 2015] Making IT Count – Agile Test Metrics
[HCMC STC Jan 2015] Making IT Count – Agile Test Metrics[HCMC STC Jan 2015] Making IT Count – Agile Test Metrics
[HCMC STC Jan 2015] Making IT Count – Agile Test Metrics
 
Michael Snyman - Software Test Automation Success
Michael Snyman - Software Test Automation Success Michael Snyman - Software Test Automation Success
Michael Snyman - Software Test Automation Success
 
Introduction to ISTQB & ISEB Certifications
Introduction to ISTQB & ISEB CertificationsIntroduction to ISTQB & ISEB Certifications
Introduction to ISTQB & ISEB Certifications
 

Ähnlich wie Test Metrics

Zero Defect Competition @ July 22.pptx
Zero Defect Competition  @ July 22.pptxZero Defect Competition  @ July 22.pptx
Zero Defect Competition @ July 22.pptxsonutyagi20
 
Baskaren Accomplishments Summary
Baskaren Accomplishments SummaryBaskaren Accomplishments Summary
Baskaren Accomplishments Summaryguest524810
 
Control phase lean six sigma tollgate template
Control phase   lean six sigma tollgate templateControl phase   lean six sigma tollgate template
Control phase lean six sigma tollgate templateSteven Bonacorsi
 
Control phase lean six sigma tollgate template
Control phase   lean six sigma tollgate templateControl phase   lean six sigma tollgate template
Control phase lean six sigma tollgate templateSteven Bonacorsi
 
ISTQB, ISEB Lecture Notes- 2
ISTQB, ISEB Lecture Notes- 2ISTQB, ISEB Lecture Notes- 2
ISTQB, ISEB Lecture Notes- 2onsoftwaretest
 
Простой QA аудит
Простой QA аудитПростой QA аудит
Простой QA аудитSQALab
 
DevOps at TestausOSY 20june2017
DevOps at TestausOSY 20june2017DevOps at TestausOSY 20june2017
DevOps at TestausOSY 20june2017Jouni Jätyri
 
Agile4 com method-uk_v3.675
Agile4 com method-uk_v3.675Agile4 com method-uk_v3.675
Agile4 com method-uk_v3.675all2com
 
Production Performance Results Internet Sample
Production Performance Results   Internet SampleProduction Performance Results   Internet Sample
Production Performance Results Internet Sampleantonioharenas
 
Kanban India 2023 | Renjith Achuthanunni and Anoop Kadur Vijayakumar | DevOps...
Kanban India 2023 | Renjith Achuthanunni and Anoop Kadur Vijayakumar | DevOps...Kanban India 2023 | Renjith Achuthanunni and Anoop Kadur Vijayakumar | DevOps...
Kanban India 2023 | Renjith Achuthanunni and Anoop Kadur Vijayakumar | DevOps...LeanKanbanIndia
 
Real time trend and failure analysis using TTA-Anand Bagmar & Aasawaree Deshmukh
Real time trend and failure analysis using TTA-Anand Bagmar & Aasawaree DeshmukhReal time trend and failure analysis using TTA-Anand Bagmar & Aasawaree Deshmukh
Real time trend and failure analysis using TTA-Anand Bagmar & Aasawaree Deshmukhbhumika2108
 
Innovative Practices in Software Quality Facilitation
Innovative Practices in Software Quality FacilitationInnovative Practices in Software Quality Facilitation
Innovative Practices in Software Quality FacilitationSPIN Chennai
 
65sp3 Rdidp Milestones.07.23.09
65sp3 Rdidp Milestones.07.23.0965sp3 Rdidp Milestones.07.23.09
65sp3 Rdidp Milestones.07.23.09flau3388
 
D03 15 Deliverable Roadmap
D03 15 Deliverable RoadmapD03 15 Deliverable Roadmap
D03 15 Deliverable RoadmapLeanleaders.org
 
D03 15 Deliverable Roadmap
D03 15 Deliverable RoadmapD03 15 Deliverable Roadmap
D03 15 Deliverable RoadmapLeanleaders.org
 
Six-Sigma-Green-belt.8169983.powerpoint.pptx
Six-Sigma-Green-belt.8169983.powerpoint.pptxSix-Sigma-Green-belt.8169983.powerpoint.pptx
Six-Sigma-Green-belt.8169983.powerpoint.pptxWFD02BLR13Outlet
 
#Interactive Session by Dinesh Boravke, "Zero Defects – Myth or Reality" at #...
#Interactive Session by Dinesh Boravke, "Zero Defects – Myth or Reality" at #...#Interactive Session by Dinesh Boravke, "Zero Defects – Myth or Reality" at #...
#Interactive Session by Dinesh Boravke, "Zero Defects – Myth or Reality" at #...Agile Testing Alliance
 
Otto Vinter - Analysing Your Defect Data for Improvement Potential
Otto Vinter - Analysing Your Defect Data for Improvement PotentialOtto Vinter - Analysing Your Defect Data for Improvement Potential
Otto Vinter - Analysing Your Defect Data for Improvement PotentialTEST Huddle
 

Ähnlich wie Test Metrics (20)

Zero Defect Competition @ July 22.pptx
Zero Defect Competition  @ July 22.pptxZero Defect Competition  @ July 22.pptx
Zero Defect Competition @ July 22.pptx
 
Baskaren Accomplishments Summary
Baskaren Accomplishments SummaryBaskaren Accomplishments Summary
Baskaren Accomplishments Summary
 
Control phase lean six sigma tollgate template
Control phase   lean six sigma tollgate templateControl phase   lean six sigma tollgate template
Control phase lean six sigma tollgate template
 
Control phase lean six sigma tollgate template
Control phase   lean six sigma tollgate templateControl phase   lean six sigma tollgate template
Control phase lean six sigma tollgate template
 
ISTQB, ISEB Lecture Notes- 2
ISTQB, ISEB Lecture Notes- 2ISTQB, ISEB Lecture Notes- 2
ISTQB, ISEB Lecture Notes- 2
 
Простой QA аудит
Простой QA аудитПростой QA аудит
Простой QA аудит
 
DevOps at TestausOSY 20june2017
DevOps at TestausOSY 20june2017DevOps at TestausOSY 20june2017
DevOps at TestausOSY 20june2017
 
Agile4 com method-uk_v3.675
Agile4 com method-uk_v3.675Agile4 com method-uk_v3.675
Agile4 com method-uk_v3.675
 
Production Performance Results Internet Sample
Production Performance Results   Internet SampleProduction Performance Results   Internet Sample
Production Performance Results Internet Sample
 
Selenium Success
Selenium SuccessSelenium Success
Selenium Success
 
Kanban India 2023 | Renjith Achuthanunni and Anoop Kadur Vijayakumar | DevOps...
Kanban India 2023 | Renjith Achuthanunni and Anoop Kadur Vijayakumar | DevOps...Kanban India 2023 | Renjith Achuthanunni and Anoop Kadur Vijayakumar | DevOps...
Kanban India 2023 | Renjith Achuthanunni and Anoop Kadur Vijayakumar | DevOps...
 
Real time trend and failure analysis using TTA-Anand Bagmar & Aasawaree Deshmukh
Real time trend and failure analysis using TTA-Anand Bagmar & Aasawaree DeshmukhReal time trend and failure analysis using TTA-Anand Bagmar & Aasawaree Deshmukh
Real time trend and failure analysis using TTA-Anand Bagmar & Aasawaree Deshmukh
 
Innovative Practices in Software Quality Facilitation
Innovative Practices in Software Quality FacilitationInnovative Practices in Software Quality Facilitation
Innovative Practices in Software Quality Facilitation
 
65sp3 Rdidp Milestones.07.23.09
65sp3 Rdidp Milestones.07.23.0965sp3 Rdidp Milestones.07.23.09
65sp3 Rdidp Milestones.07.23.09
 
D03 15 Deliverable Roadmap
D03 15 Deliverable RoadmapD03 15 Deliverable Roadmap
D03 15 Deliverable Roadmap
 
D03 15 Deliverable Roadmap
D03 15 Deliverable RoadmapD03 15 Deliverable Roadmap
D03 15 Deliverable Roadmap
 
Six-Sigma-Green-belt.8169983.powerpoint.pptx
Six-Sigma-Green-belt.8169983.powerpoint.pptxSix-Sigma-Green-belt.8169983.powerpoint.pptx
Six-Sigma-Green-belt.8169983.powerpoint.pptx
 
#Interactive Session by Dinesh Boravke, "Zero Defects – Myth or Reality" at #...
#Interactive Session by Dinesh Boravke, "Zero Defects – Myth or Reality" at #...#Interactive Session by Dinesh Boravke, "Zero Defects – Myth or Reality" at #...
#Interactive Session by Dinesh Boravke, "Zero Defects – Myth or Reality" at #...
 
6 sigma LTE release management process improvement
6 sigma LTE release management process improvement6 sigma LTE release management process improvement
6 sigma LTE release management process improvement
 
Otto Vinter - Analysing Your Defect Data for Improvement Potential
Otto Vinter - Analysing Your Defect Data for Improvement PotentialOtto Vinter - Analysing Your Defect Data for Improvement Potential
Otto Vinter - Analysing Your Defect Data for Improvement Potential
 

Test Metrics

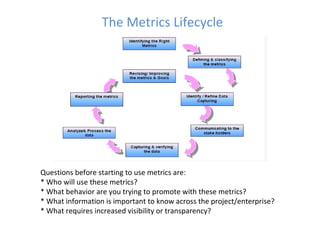
  • 1. The Metrics Lifecycle Questions before starting to use metrics are: * Who will use these metrics? * What behavior are you trying to promote with these metrics? * What information is important to know across the project/enterprise? * What requires increased visibility or transparency?
  • 2. Inception 6/2010 Interim 1/2011 Comprehensive 6/2011 Test Planning Test Creation Test Execution Defect Management Configuration Management Cost – Project, BA, Dev, QA Test Scripts Built Pass, Failed, Risk* # Scripts, Timeline Status, Severity Check Points, Test Plan, Traceability Matrix Trend, Block, No Runs BA/Dev/Bus Accepted/Rejected Test Automation Discovery Rate, Removal Rate, Trend, QA Impact (time, testers) Uptime, Domain Version verification, Release Notes Removal Cost, Root Cause BA/Dev/Bus Accepted/Rejected Build Cost # Scripts, Timeline Pass, Failed, Usage Artifact Lockdown Sample Metrics Stability Report Automation Save S C O R E C A R D
  • 3. Process Overview Review Data Points with teams*. If Data are not captured, process is defined. Data is saved to a shared space On QC Data identity is defined (QC Project, Project ID, Date stamp, etc.) Teams or process create sheets. QM collects all reports, consolidates, reviews with teams and sends result to PGM. Automated Process (QTP, Excel Marco, etc.) to upload sheets into Master sheet. Macro/QM consolidates information Naming Standards - Sheet Name (Team-Date-Test Metrics- Project) Shared Space Location Name and Access Initial Not On QC How Manual
  • 4. Summary Detail Project View Execution/Defect Overview Report Initial Test Execution AE/PE < 10% AE/PE < 20% AE/PE > 30% ▲ ▬▬ ▼ Trend Defects defect/test executed < 10% defect/test executed < 20% defect/test executed > 30% Not In QC   Overall Progress DF % + TEP % + Risk < 10% DF % + TEP % + Risk < 20% DF % + TEP % + Risk > 30% In QC   Sheet Key FID Project View 4/1/2010 Total Tests Planned To Date Execution Actual To Date Execution Defects Test Execution Progress Defects Overall Test Progress # of test cases % of Total % of Total % of Total Commodities 55 24% 36% 15% ▲ ▲ ▲ Credit 70 43% 36% 4% ▬▬ ▬▬ ▬▬ GFX 120 64% 37% 57% ▼ ▬▬ ▲ Project ABC 245 49% 36% 33% ▼ ▬▬ ▲                 Commodities 100 60% 54% 9% ▲ ▲ ▲ Credit 83 53% 46% 18% ▬▬ ▬▬ ▬▬ Rates 120 64% 45% 7% ▼ ▲ ▬▬ Project XYZ 303 60% 48% 11% ▼ ▲ ▬▬                 FID Project View 4/1/2010 Total Tests Planned To Date Execution Actual To Date Execution Defects Test Execution Progress Defects Overall Test Progress # of test cases % of Total % of Total % of Total Project ABC 245 49% 36% 33% ▼ ▬▬ ▲                 Project XYZ 303 60% 48% 11% ▼ ▲ ▬▬                
  • 5. Summary Detail Product View Execution/Defect Overview Report FID Product View 4/1/2010 Total Tests Planned Execution Actual Execution Defects Test Execution Progress Defects Open Defects Overall Test Progress # of test cases % of Total % of Total % of Total ABC 55 24% 36% 10% ▲ ▲ ▬▬ ▲ XYZ 100 65% 52% 13% ▲ ▲ ▼ ▼ Commodities 155 50% 46% 13% ▼ ▬▬ ▬▬ ▲ ABC 70 23% 36% 1% ▲ ▲ ▬▬ ▬▬ XYZ 200 48% 26% 18% ▲ ▲ ▬▬ ▬▬ Credit 27000% 41% 29% 13% ▲ ▲ ▬▬ ▬▬ FID Product View 4/1/2010 Total Tests Planned Execution Actual Execution Defects Test Execution Progress Defects Open Defects Overall Test Progress # of test cases % of Total % of Total % of Total Commodities 155 50% 46% 13% ▼ ▬▬ ▬▬ ▲ Credit 270 41% 29% 13% ▲ ▲ ▬▬ ▬▬
  • 6. Process Overview All test teams on QC or compliant tool on an open architecture. New metrics defined and prioritized. QM teams generates report, verifies with team and sends to PGM. How Used Defined Fields added and populated, workflows created, folder structures and added to QC project template. New metrics may require a data pass or bridge to other tools. (Configuration Management, Project Management, Remedy, etc,) Teams Trained* Dry Run* Interim Interim
  • 7. June 1, 2009 Interim
  • 9. Interim April Release - ETL Total Cases % Actual Executed % Plan Executed # Passed % Passed (not including Blocked and No Run) # Failed # No Run Not Executed # Blocked Active DRS Total DRs CIT 12/12 - 1/30 341 71% 100% 225 93% 18 73 25 0 29 82 SIT 2/2 - 2/27 385 6% 100% 18 75% 6 351 10 0 0 2 Show Stopper High Medium Low Total DR Status Total   58 22   82 Active New     2   2 Ready For Review 2 3 4   9 Ready For Development   1 3   4 In QA   8 5   13 Re-Open     1   1 Total   12 15   29 Closed Withdrawn   10 4 14 Completed   36 3 39 Total   46 7 53
  • 10. Traceability By Requirements Interim PCR-PCR Title Total Cases Not Completed Passed Failed N/A No Run Test Blocked Active Dr's % Completed % In Progress Comments PCR88890 - Stage to OLTP ETL Interface 67               0.00% 0.00%   PCR 88891 - Type Table Manager ETL Interface 1               0.00% 0.00%   PCR 88892 - ADIM to OrgMart DDL & DML scripts 1               0.00% 0.00%   PCR88893 - OrgMart to BPS ETL Interface 12               0.00% 0.00%   PCR88894 - OrgMart to Entitlements ETL Interface 13               0.00% 0.00%   PCR88993 - ADIM to OrgMart Stage ETL Interface 140               0.00% 0.00%   PCR89092 - Oracle Views for OMDS 29               0.00% 0.00%   PCR89093 - Data Patches Phase 1 1               0.00% 0.00%   PCR89094 - Data Patches Final non-HR Update 4               0.00% 0.00%   PCR89095 - Export to ADIM ETL interface 100               0.00% 0.00%   PCR89096 - CMD, FSL, B2C Exports ETL/Views impact 1               0.00% 0.00%   PCR89629 - SSRS Reports impact 16               0.00% 0.00%   Total 385 0 0 0 0 0 0 0 0.00% 0.00%  
  • 11. Process Overview All test teams on QC or compliant tool on an open architecture. New metrics defined and prioritized span Test Management, time utilization of BA/Dev/QA and cost analysis. How Data is identified, workflows created to capture and maintain the data. Applications may need to be modified or acquired to support metric. Teams Trained* Dry Run* Comprehensive
  • 12. Comprehensive   Mar-10 Feb-10 Jan-10 Dec-10 BRDs/PCRs 39 28 23 43           Number of Defects in QA 118 76 30 54 Number of Defects in UA 9 2 0 7 Total Prod Fix BRDs in the Post Release   57 2 7 Total   135 32 68           Defect Efficiency (DR Hours/PCR Hours) 42% 25% 30% 21%           Total Number of Builds In QA 3 5 4 10 Total Number of Hot Fixes - Production   1 0 0 Severity Mar Feb Jan Dec ShowStopper 2 3 1 6 High 73 52 19 33 Medium 33 15 7 13 Low 10 6 3 2 Total 118 76 30 54
  • 13. Comprehensive Release date Total Hours (PCR + DRs) 12127 5107 5644 5349 12603             Total Effort SA (Hrs) 886 156 321 474 894 Total Effort Dev (Hrs) 3172 630 1578 481 1098 Total Effort QA (Hrs) 6217 2820 2355 3155 8446 Total PCR Effort (Hrs) 10275 3606 4254 4110 10438             DRs Total Effort SA (Hrs) 135 267 321 244 200 Total Effort Dev (Hrs) 1353 893 771 703 1470 Total Effort QA (Hrs) 364 341 298 292 495 Total DR Effort (Hrs) 1852 1501 1390 1239 2165             Defect Effort (Hrs)   42% 25% 30% 21%         Total Showstopper Defects 11 2 3 1 6 Total High Defects 112 54 52 19 33 Total Medium Defects 59 10 15 7 13 Total Low Defects 16 7 6 3 2 Deferred DRs 20 45 0 88   Total Overall Defects 218 118 76 118 54       Total Number of Prod Fix BRDs discovered during QA Cycle 31 35 4 17               Number of Defects Withdrawn 39 26 18 2 8             Number of Actual Defects Resolved in Pre Release   24 45 116 46 QA Defect Detection Duration (Hours per Defect) 32.72 34.39 37.98 70.11 183.61             Environment Issues (QA) 7 6 5 6 11 Environment Issues (IT) 2 4 4 5 5 Total Environment Issues 9 10 9 11 16             Differed DRs converted in Prod Fix BRDs 19 6 10 1   Pre Release Metrics Mar Feb Jan Dec Nov Release date
  • 14. Comprehensive Defect Type           3rd party 1 3 2 2 3 Architectural Design/Technical specs 3 0     2 Business Requirement/Project scope   2       Coding 19 7 7 5 14 db Patch issue/Incorrect Push   0       Existing production issue   0       Functional Specification 15 7 6 5 8 Technical Specification 7 5 2     Other 136 74 98 44 19 Build Process   0       Training   0       Configuration 2 1 1     Environment issue   0       BLANK 35 19       TOTAL 218 118 116 56 46         UAT       DRs Opened in Viper 0 0 2 0 7             Test Cases Executed 20 13   19   Passed 13 9 8   Failed 7 4   2   No Run 0 0   9               Functional Test Cases Reviewed 339 505 236 159 121 Accepted 336 478 229 129 72 Rejected 3 27 7 30 46                     Functional Test Results Reviewed 148 90 178 112 41 Accepted 128 90 169 98 30 Rejected 20 0 9 14 11             Integration Test Results Reviewed 35 51 178 112 41 Accepted 19 35 169 98 30 Rejected 16 16 9 14 11 Pre Release Metrics Mar Feb Jan Dec Nov Release date
  • 15. A version collection tool is used to track all web service and UI versions in the QA, IT, and ST environments on a daily basis. Comprehensive
  • 17.
  • 18. Requirements Tracking Comprehensive PCR # PCR Status PCR Title 89833 New NexOS - OrgMart 2.0 - Web Services Development 94123 New NexOS DB - OrgMart 2.0 - UI Oracle API Phase 2 91076 In Analysis NexOS DB OrgMart 2.0 Config Data cleanup and Oracle API Changes 94216 In Analysis NexOS Tools & Admin - OrgMart 2.0 Data Transformation and Services 89094 Pending Estimation NexOS DB - OrgMart 2.0 - P - Data Patches Final non-HR Update 89282 In Development NexOS DB - OrgMart 2.0 - P - Oracle Merge scripts to sync ORGMART_PROD to ORGMART (lower environments only) 90222 In Development NexOS DB - OrgMart 2.0 - Oracle PL/SQL API Packages referencing HR schema impact 91080 In Development NexOS DB OrgMart 2.0 Config to OrgMart Oracle API Changes 88890 In QA NexOS DB - OrgMart 2.0 - P - Stage to OLTP ETL Interface 88891 In QA NexOS DB - OrgMart 2.0 - P - Type Table Manager ETL Interface 88892 In QA NexOS DB - OrgMart 2.0 - P - ADIM to OrgMart DDL & DML scripts 88893 In QA NexOS DB - OrgMart 2.0 - P - OrgMart to BPS ETL Interface 88894 In QA NexOS DB - OrgMart 2.0 - P - OrgMart to Entitlements ETL Interface 88993 In QA NexOS DB - OrgMart 2.0 - P - ADIM to OrgMart Stage ETL Interface 89092 In QA NexOS DB - OrgMart 2.0 - P - Oracle Views for OMDS 89093 In QA NexOS DB - OrgMart 2.0 - P - Data Patches Phase 1 89095 In QA NexOS DB - OrgMart 2.0 - P - Export to ADIM ETL interface 89096 In QA NexOS DB - OrgMart 2.0 - P - CMD, FSL, B2C Exports ETL/Views impact 89097 In QA NexOS DB - OrgMart 2.0 - P - Marketing ETL Export interface impact 89247 In QA NexOS DB - OrgMart 2.0 - P - UI Oracle API 89248 In QA NexOS DB - OrgMart 2.0 - P - SuperMarvin Oracle API 89396 In QA NexOS DB - OrgMart 2.0 - P - Oracle API for LandSafe 89629 In QA NexOS DB - OrgMart 2.0 - P - SSRS Reports impact 91069 In QA NexOS DB OrgMart 2.0 Config Pipeline Delegation functionality XFER to iPipe
  • 19.  

Hinweis der Redaktion

  1. Metrics are defined as “standards of measurement” and are a method of gauging the effectiveness and efficiency of a particular activity within a project. Test metrics exist in a variety of forms. The question is not whether we should use them, but rather, which ones should we use. Simpler is almost always better. For example, it may be interesting to derive the Binomial Probability Mass Function for a particular project, although it may not be practical in terms of the resources and time required to capture and analyze the data. Furthermore, the resulting information may not be meaningful or useful to the current effort of process improvement.
  2. “ You cannot improve what you cannot measure.” When used properly, test metrics assist in the improvement of the software development process by providing pragmatic, objective evidence of process change initiatives.
  3. Manual – intrusive, error prone and may conflict with other priorities