#ChoiceBroking #EquityBazaar - Today, We may witness mild negative opening in Nifty around 8766 level on back of SGX Nifty and other Asian counters which is trading on mixed note today.
Solution Manual for Principles of Corporate Finance 14th Edition by Richard B...
Equity bazaar 21.09.2016
1. Equity Bazaar
SEBI Registered– Research Analyst Equities I Commodities I Currencies I Mutual Funds
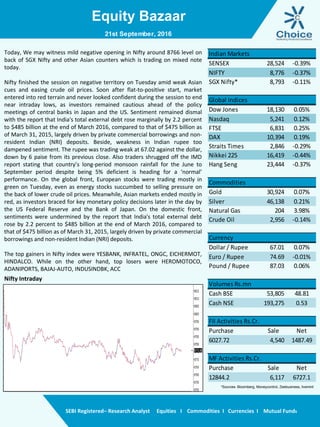
Nifty Intraday
Today, We may witness mild negative opening in Nifty around 8766 level on
back of SGX Nifty and other Asian counters which is trading on mixed note
today.
Nifty finished the session on negative territory on Tuesday amid weak Asian
cues and easing crude oil prices. Soon after flat-to-positive start, market
entered into red terrain and never looked confident during the session to end
near intraday lows, as investors remained cautious ahead of the policy
meetings of central banks in Japan and the US. Sentiment remained dismal
with the report that India's total external debt rose marginally by 2.2 percent
to $485 billion at the end of March 2016, compared to that of $475 billion as
of March 31, 2015, largely driven by private commercial borrowings and non-
resident Indian (NRI) deposits. Beside, weakness in Indian rupee too
dampened sentiment. The rupee was trading weak at 67.02 against the dollar,
down by 6 paise from its previous close. Also traders shrugged off the IMD
report stating that country’s long-period monsoon rainfall for the June to
September period despite being 5% deficient is heading for a ‘normal’
performance. On the global front, European stocks were trading mostly in
green on Tuesday, even as energy stocks succumbed to selling pressure on
the back of lower crude oil prices. Meanwhile, Asian markets ended mostly in
red, as investors braced for key monetary policy decisions later in the day by
the US Federal Reserve and the Bank of Japan. On the domestic front,
sentiments were undermined by the report that India's total external debt
rose by 2.2 percent to $485 billion at the end of March 2016, compared to
that of $475 billion as of March 31, 2015, largely driven by private commercial
borrowings and non-resident Indian (NRI) deposits.
The top gainers in Nifty index were YESBANK, INFRATEL, ONGC, EICHERMOT,
HINDALCO. While on the other hand, top losers were HEROMOTOCO,
ADANIPORTS, BAJAJ-AUTO, INDUSINDBK, ACC
21st September, 2016
SENSEX 28,524 -0.39%
NIFTY 8,776 -0.37%
SGX Nifty* 8,793 -0.11%
Global Indices
Dow Jones 18,130 0.05%
Nasdaq 5,241 0.12%
FTSE 6,831 0.25%
DAX 10,394 0.19%
Straits Times 2,846 -0.29%
Nikkei 225 16,419 -0.44%
Hang Seng 23,444 -0.37%
Commodities
Gold 30,924 0.07%
Silver 46,138 0.21%
Natural Gas 204 3.98%
Crude Oil 2,956 -0.14%
Currency
Dollar / Rupee 67.01 0.07%
Euro / Rupee 74.69 -0.01%
Pound / Rupee 87.03 0.06%
Volumes Rs.mn
Cash BSE 53,805 48.81
Cash NSE 193,275 0.53
FII Activities Rs.Cr.
Purchase Sale Net
6027.72 4,540 1487.49
MF Activities Rs.Cr.
Purchase Sale Net
12844.2 6,117 6727.1
Indian Markets
*Sources- Bloomberg, Moneycontrol, Zeebusiness, livemint
2. Equity Bazaar
SEBI Registered– Research Analyst Equities I Commodities I Currencies I Mutual Funds
Nifty Outlook
Bank Nifty Outlook
21st September, 2016
L1 L2 L3
R 8808 8841 8866
S 8751 8727 8694
21 DEMA 8751
50 DEMA 8621
100 DEMA 8407
Moving Averages
L1 L2 L3
R 19945 20038 20112
S 19778 19705 19612
21 DEMA 19727
50 DEMA 19187
100 DEMA 18438
Moving Averages
Nifty has formed shaven top which indicates right from beginning there was selling pressure and open
& high of the day was same.
From past couple of day index is trading with high volatility but day on day its momentum is not
picking in either direction.
It shows time wise correction with timid volume but based on technical evidences index still seems to
be in positive momentum as it is operating above 21 day moving average and sustaining above slope
of trend line.
Going forward, mild resistance can be in vicinity of 8840 to 8860 range and on downside support lies
at 8750 level.
Bank Nifty has also formed shaven top which indicate there was selling since inception but there was
not continuing selling pressure.
From past 6 trading session index is grinding in tight range. It volatile on intraday basis but flattish vis a
vis to its previous day move.
Index is trading above its 21 day short term moving average and some crisscross is happening between
public and private sector in terms of their performance.
Going forward, mild positive bias can be maintain with upside potential of 20100 and immediate
support lies at 19700 level.
3. Equity Bazaar
SEBI Registered– Research Analyst Equities I Commodities I Currencies I Mutual Funds
Derivative Front:
The India VIX contraction by 1.07% and reached 14.78. The
Nifty was down by 32.50 points or 0.37% to settle at 8,775.90.
From the most active contracts, SBI September 2016 futures
traded at a premium of 1.60 points at 255.45 compared with
spot closing of 253.85. The numbers of contracts traded were
8,565. ICICI Bank September 2016 futures traded at a
premium of 0.10 points at 272.60 compared with spot closing
of 272.50. Tata Motors September 2016 futures traded at a
premium of 1.75 points at 548.65 compared with spot closing
of 546.90. Tata Steel September 2016 futures traded at a
premium of 1.65 points at 366.90 compared with spot closing
of 365.25. Reliance Industries September 2016 futures traded
at a premium of 5.40 points at 1078.95 compared with spot
closing of 1,073.55.
The Nifty PCR finally stood at 1.23 for September month
contract. The top five scrips with highest PCR on OI were MRF
(2.33), GODREJCP (1.25), MARUTI (1.22), CENTURYTEX (1.13)
and GRASIM (1.13).
21st September, 2016
Long Built Up
Symbol Close Price Chng % OI Chng % Buy Above
CASTROLIND 462.60 10.14 25.44 Long BU
BIOCON 963.95 2.94 10.48 Long BU
DRREDDY 3170.00 0.30 1.82 Long BU
TATASTEEL 366.9 1.10 1.61 Long BU
Short Covering
Symbol Close Price Chng % OI Chng % Buy Above
CEATLTD 1135.30 0.70 -23.54 1150.87
MRF 43687.05 1.21 -7.40 44068.67
ONGC 257.75 1.36 -6.94 260.25
OIL 404.6 0.56 -6.00 407.52
Short Built Up
Symbol Close Price Chng % OI Chng % Sell Below
JUBLFOOD 948.50 -6.02 12.27 959.29
ALBK 80.20 -1.66 10.57 81.00
DLF 148.30 -2.40 7.49 150.52
HINDUNILVR 906.8 -0.97 6.42 912.43
Long Liquidation
Symbol Close Price Chng % OI Chng % Sell Below
IBREALEST 87.35 -6.08 -10.99 89.51
RELCAPITAL 560.95 -1.86 -8.86 565.21
APOLLOTYRE 218.20 -1.82 -8.74 220.91
VOLTAS 384.25 -2.08 -8.68 388.34
ACC COVERED PUT
4. Equity Bazaar
SEBI Registered– Research Analyst Equities I Commodities I Currencies I Mutual Funds
21st September, 2016
Symbols CLOSE R3 R2 R1 P S1 S2 S3 Trend Action
ACC 1629 1679 1668 1648 1637 1618 1606 1575 Down Sell
ADANIPORTS 269 284 281 275 271 266 262 253 Down Sell
AMBUJACEM 268 275 272 270 267 265 262 258 Up Buy
ASIANPAINT 1163 1182 1178 1170 1167 1159 1155 1144 Down Sell
AUROPHARMA 807 827 821 814 808 801 795 782 Down Sell
AXISBANK 595 609 604 599 594 589 584 575 Up Buy
BAJAJ-AUTO 2888 3019 2987 2938 2906 2857 2825 2744 Down Sell
BANKBARODA 166 171 170 168 167 165 164 161 Down Sell
BHARTIARTL 320 330 327 323 320 317 314 308 Down Sell
BHEL 145 150 149 147 146 144 143 140 Down Sell
BOSCHLTD 23256 24016 23758 23507 23249 22998 22740 22231 Up Buy
BPCL 585 596 593 589 586 582 579 572 Down Sell
CIPLA 602 619 613 608 602 596 590 579 Up Buy
COALINDIA 329 334 332 331 329 327 326 322 Up Buy
DRREDDY 3157 3237 3219 3188 3169 3138 3119 3070 Down Sell
EICHERMOT 23450 24000 23773 23611 23384 23222 22995 22606 Up Buy
GAIL 385 397 394 390 387 382 380 372 Down Sell
GRASIM 4861 5034 4982 4921 4869 4809 4757 4645 Down Sell
HCLTECH 793 809 802 797 791 786 780 768 Up Buy
HDFC 1395 1414 1405 1400 1391 1386 1377 1364 Up Buy
HDFCBANK 1290 1307 1301 1296 1290 1285 1279 1268 Up Buy
HEROMOTOCO 3472 3648 3608 3540 3500 3432 3392 3284 Down Sell
HINDALCO 146 151 149 147 145 143 141 137 Up Buy
HINDUNILVR 902 928 922 912 907 896 891 875 Down Sell
ICICIBANK 273 280 277 275 272 270 267 262 Up Buy
IDEA 84 86 86 85 84 83 83 81 Down Sell
INDUSINDBK 1184 1225 1216 1200 1191 1175 1166 1141 Down Sell
INFRATEL 356 375 367 361 353 348 340 326 Up Buy
INFY 1052 1069 1063 1058 1052 1046 1040 1029 Up Buy
ITC 256 262 261 258 257 254 253 249 Down Sell
KOTAKBANK 793 812 808 800 796 788 784 772 Down Sell
LT 1475 1499 1492 1483 1476 1468 1460 1444 Down Sell
LUPIN 1549 1589 1575 1562 1549 1535 1522 1495 Up Buy
M&M 1409 1443 1435 1422 1414 1401 1393 1371 Down Sell
MARUTI 5515 5612 5586 5551 5524 5489 5463 5401 Down Sell
NTPC 153 157 156 155 154 153 152 150 Down Sell
ONGC 258 268 264 261 257 254 250 243 Up Buy
POWERGRID 178 182 181 179 178 177 176 173 Down Sell
RELIANCE 1074 1098 1091 1083 1076 1067 1060 1044 Down Sell
SBIN 254 258 257 256 255 253 252 249 Down Sell
SUNPHARMA 778 794 790 784 781 774 771 761 Down Sell
TATAMOTORS 547 564 560 554 550 543 539 528 Down Sell
TATAMTRDVR 347 356 354 351 348 345 342 336 Down Sell
TATAPOWER 76 79 78 77 76 75 74 72 Down Sell
TATASTEEL 365 381 376 370 365 360 354 343 Up Buy
TCS 2410 2454 2436 2423 2404 2391 2373 2341 Up Buy
TECHM 462 476 473 467 464 459 455 446 Down Sell
ULTRACEMCO 3978 4076 4053 4016 3993 3955 3932 3871 Down Sell
WIPRO 481 487 485 483 481 479 476 472 Up Buy
YESBANK 1207 1265 1239 1223 1197 1181 1155 1113 Up Buy
ZEEL 526 540 534 530 525 521 516 507 Up Buy
5. Equity Bazaar
SEBI Registered– Research Analyst Equities I Commodities I Currencies I Mutual Funds
Contact Us
www.choicebroking.in
Kkunal Parar
Sr. Research Associate
kkunal.parar@choiceindia.com
Vikas Chaudhari
Research Associate
vikas.chaudhari@choiceindia.com
www.choicebroking.incustomercare@choiceindia.com
Disclaimer
This is solely for information of clients of Choice Broking and does not construe to be an investment advice. It is also not intended as an offer or solicitation for the purchase and sale of any financial
instruments. Any action taken by you on the basis of the information contained herein is your responsibility alone and Choice Broking its subsidiaries or its employees or associates will not be liable in
any manner for the consequences of such action taken by you. We have exercised due diligence in checking the correctness and authenticity of the information contained in this recommendation, but
Choice Broking or any of its subsidiaries or associates or employees shall not be in any way responsible for any loss or damage that may arise to any person from any inadvertent error in the
information contained in this recommendation or any action taken on basis of this information. Technical analysis studies market psychology, price patterns and volume levels. It is used to forecast
future price and market movements. Technical analysis is complementary to fundamental analysis and news sources. The recommendations issued herewith might be contrary to recommendations
issued by Choice Broking in the company research undertaken as the recommendations stated in this report is derived purely from technical analysis. Choice Broking has based this document on
information obtained from sources it believes to be reliable but which it has not independently verified; Choice Broking makes no guarantee, representation or warranty and accepts no responsibility
or liability as to its accuracy or completeness. The opinions contained within the report are based upon publicly available information at the time of publication and are subject to change without
notice. The information and any disclosures provided herein are in summary form and have been prepared for informational purposes. The recommendations and suggested price levels are intended
purely for trading purposes. The recommendations are valid for the day of the report however trading trends and volumes might vary substantially on an intraday basis and the recommendations may
be subject to change. The information and any disclosures provided herein may be considered confidential. Any use, distribution, modification, copying, forwarding or disclosure by any person is
strictly prohibited. The information and any disclosures provided herein do not constitute a solicitation or offer to purchase or sell any security or other financial product or instrument. The current
performance may be unaudited. Past performance does not guarantee future returns. There can be no assurance that investments will achieve any targeted rates of return, and there is no guarantee
against the loss of your entire investment.
POTENTIAL CONFLICT OF INTEREST DISCLOSURE (as on date of report) Disclosure of interest statement – • Analyst interest of the stock /Instrument(s): - No. • Firm interest of the stock /
Instrument (s): - No.
Amit Pathania
Research Associate
amit.pathania@choiceindia.com
21st September, 2016
Kapil Shah
Research Associate
kapil.shah@choiceindia.com
Kapil Shah
Digitally signed by Kapil Shah
DN: cn=Kapil Shah, o=Choice Equity Pvt Ltd,
ou=Research Team,
email=kapil.shah@choiceindia.com, c=US
Date: 2016.09.21 09:13:42 +05'30'