1. THE COMBINED GAS LAW
Part 1: Introduction to Simulation
1. Load the simulation Gas Properties and spend a few minutes exploring the simulation.
https://phet.colorado.edu/en/simulation/gas-properties
2. List 3 things that you can manipulate in the simulation. How do you control each one?
a.
b.
c.
3. Locate the reset button on the simulation and push it to return the screen to the original state. What
does the pressure dial read? ___________
**Special note: For any mathematical work involving gases, temperatures MUST BE IN KELVIN! (K = ºC +
273)**
Part 2: Temperature vs. Volume
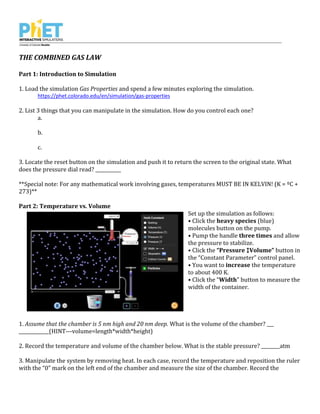
Set up the simulation as follows:
• Click the heavy species (blue)
molecules button on the pump.
• Pump the handle three times and allow
the pressure to stabilize.
• Click the “Pressure ↕Volume” button in
the “Constant Parameter” control panel.
• You want to increase the temperature
to about 400 K.
• Click the “Width” button to measure the
width of the container.
1. Assume that the chamber is 5 nm high and 20 nm deep. What is the volume of the chamber? ___
_____________(HINT---volume=length*width*height)
2. Record the temperature and volume of the chamber below. What is the stable pressure? ________atm
3. Manipulate the system by removing heat. In each case, record the temperature and reposition the ruler
with the “0” mark on the left end of the chamber and measure the size of the chamber. Record the
2. temperature and volume values for 7 different temperatures in the table below. Make sure the pressure
is not changing – it does take a few seconds for the sample to stabilize after changing the temperature.
4. Graph the results of your experiment with volume on the horizontal axis and temperature on the
vertical axis. Sketch your graph above. Feel free to create your graph electronically if you prefer.
5.
a. The k values represent a constant. This tells us about the relationship between the two variables.
Find the values for k1 and k2 in the table. Which value remains the most consistent in the data
table? k1 or k2?
b. Describe the relationship (indirect or inverse) your graph represents. Be sure to use the variables
and constant in your answer (note which is the manipulated and which is the responding
variable). Your answer should contain the words temperature, volume, and pressure and provide
a specific example from your data.
3. 6.
a. What is the mathematical relationship present between temperature and volume using either an
equation with T1, V1 and T2, V2 or a proportional statement?
b. What would happen if the temperature doubled? Mathematically, how could the quantity of
volume be represented?
c. As the temperature gets colder and approaches 0 Kelvin, what happens to the volume of the gas
and why do you think this is (HINT—make sure you discuss the average kinetic energy of the
particles)?
d. The volume of a sample of gas is 2.00 L when the temperature is 284K. While the pressure
remains constant, the temperature is changed to a new value, which causes the volume to become
3.00 L. What was the temperature changed to?
Part 3: Pressure vs. Volume
Reset the simulation and set it up as follows:
a. Click the heavy species (blue) molecules
button on the pump. Pump the handle once.
b. Click the “Temperature” button in the
“Constant Parameter” control panel.
c. Click the “Ruler” button in the “Tools”
menu.
d. Position the ruler on the bottom of the
chamber so that the “0 nm” mark is aligned
with the left end of the chamber.
1. Manipulate the system by moving the left
handle of the chamber to reduce the volume.
Move the handle to the right. a) What is the width
of the box measured in? _______________
2. To calculate the volume of the chamber, record what the ruler says *100 nm (the rest of the chamber is
5nm *20 nm). Record it in the table. Record the pressure as well. Describe, is there a limit to how far you
can push the handle in? _____Why do you think this is?
4. 3. Record your results in the following table. Record pressures for at least 7 sets of different
measurements on the ruler besides 0 nm. It is helpful to do this going from largest volume to smallest or
vice versa.
4. Graph the results of your experiment with pressure on the y-axis and volume on the x-axis. Sketch
your graph above. Feel free to create a graph electronically if you prefer.
5. Based on the graph above, express the relationship between pressure and volume mathematically
(using a proportional statement or an equation) and verbally (specifically describe it in words)
Mathematically
Verbally
6.
a. What would happen to the pressure in a container if the volume of the container is doubled (say it
expands)? Mathematically, how could the quantity of pressure be represented?
b. Explain in terms of the collisions of particles why the change has the effect you predicted.
5. c. Select three regions on the graph (one at each end and one in the middle) that are consistent with
what was observed and account for the graphical relationship observed. Sketch boxes of
appropriate size with 5 particles in each that illustrates the relationship observed in the activity.
7. You have 3.05 cm3 of a gas in a cylinder with a moveable piston. P = 104.2 kPa. At constant T, the gas
in compressed to a new volume of 0.86 cm3. What is the new pressure, P2?
Part 3: Combined Gas Law
1. Place two pumps in.
2. Select one variable, ______________________ (write the variable). Circle if you want it to go up or down.
3. Predict how changing that variable will impact the other two. If ____________ goes ______ then ______________
will ___________ and _________________ will ______________.
4. Record your initial values for everything under trial 1, initial conditions.
Trial 1 Trial 2
Initial
Conditions, 1
Final
Conditions, 2
Initial
Conditions, 1
Final
Conditions, 2
Pressure
Volume
Temperature
Results
5. Change the one variable you listed above in the direction you said (up or down).
6. Once the variables have settled, record the final conditions. Comment on how your close predictions in
#3 were to the results. What insights have you gained here?
7. Conduct a second trial with all the variables. Select one variable, ______________________ (write the
variable). Circle if you want it to go up or down. Predict how changing that variable will impact the other
two. If ____________ goes ______ then ______________ will ___________ and _________________ will ______________.
The combined gas law has a predictive power that is supported by the explanatory power within the
kinetic molecular theory.
6. 8. The combined gas law combines the other two laws we have discussed. Write the combined gas law
here:
9. Suppose that 25.0 mL of a gas at 125 kPa and 293K are moved to standard temperature and pressure.
What would the new volume of the gas be?
10. The pressure in a bicycle tire is 105 kPa at 298K in Saranac Lake during the summer. The volume of
the bike tire is 250 cm3 of gas. You ride the bike to Maine, where the temperature drops to 268 K. What is
the new pressure in the tire?