Summary Evaluation CDOT Revegetation
•Als DOC, PDF herunterladen•
0 gefällt mir•153 views

Terra Logic performed Line-Point Intercept surveys of five Colorado Department of Transportation right-of-ways to evaluate revegetation conditions. The surveys found on average 86% canopy cover, 6% bare ground, and 17% basal cover across the sites. Hwy 285 had the highest scores with 98% cover and 24% basal cover after 12 years. Overall health averaged 3.2 out of 5. Recommendations include using only native species in seed mixes matched to the local ecology, and maintaining best practices like retaining topsoil.

Empfohlen
Empfohlen
Weitere ähnliche Inhalte
Was ist angesagt?
Was ist angesagt? (20)
Andere mochten auch
Ähnlich wie Summary Evaluation CDOT Revegetation
Ähnlich wie Summary Evaluation CDOT Revegetation (20)
Summary Evaluation CDOT Revegetation
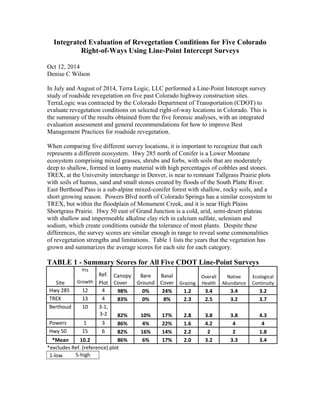
- 1. Integrated Evaluation of Revegetation Conditions for Five Colorado Right-of-Ways Using Line-Point Intercept Surveys Oct 12, 2014 Denise C Wilson In July and August of 2014, Terra Logic, LLC performed a Line-Point Intercept survey study of roadside revegetation on five past Colorado highway construction sites. TerraLogic was contracted by the Colorado Department of Transportation (CDOT) to evaluate revegetation conditions on selected right-of-way locations in Colorado. This is the summary of the results obtained from the five forensic analyses, with an integrated evaluation assessment and general recommendations for how to improve Best Management Practices for roadside revegetation. When comparing five different survey locations, it is important to recognize that each represents a different ecosystem. Hwy 285 north of Conifer is a Lower Montane ecosystem comprising mixed grasses, shrubs and forbs, with soils that are moderately deep to shallow, formed in loamy material with high percentages of cobbles and stones. TREX, at the University interchange in Denver, is near to remnant Tallgrass Prairie plots with soils of humus, sand and small stones created by floods of the South Platte River. East Berthoud Pass is a sub-alpine mixed-conifer forest with shallow, rocky soils, and a short growing season. Powers Blvd north of Colorado Springs has a similar ecosystem to TREX, but within the floodplain of Monument Creek, and it is near High Plains Shortgrass Prairie. Hwy 50 east of Grand Junction is a cold, arid, semi-desert plateau with shallow and impermeable alkaline clay rich in calcium sulfate, selenium and sodium, which create conditions outside the tolerance of most plants. Despite these differences, the survey scores are similar enough in range to reveal some commonalities of revegetation strengths and limitations. Table 1 lists the years that the vegetation has grown and summarizes the average scores for each site for each category. TABLE 1 - Summary Scores for All Five CDOT Line-Point Surveys Site Yrs Ref. Canopy Cover Bare Ground Basal Cover Grazing Overall Health Native Abundance Ecological ContinuityGrowth Plot Hwy 285 12 4 98% 0% 24% 1.2 3.4 3.4 3.2 TREX 13 4 83% 0% 8% 2.3 2.5 3.2 3.7 Berthoud 10 3-1, 3-2 82% 10% 17% 2.8 3.8 3.8 4.3 Powers 1 3 86% 4% 22% 1.6 4.2 4 4 Hwy 50 15 6 82% 16% 14% 2.2 2 2 1.8 *Mean 10.2 86% 6% 17% 2.0 3.2 3.3 3.4 *excludes Ref. (reference) plot 1-low 5-high
- 2. Mean Scores Evaluations for Five Locations Canopy Cover, Bare Ground and Basal Cover Scores are Related At each vertical data point, the survey captured a top canopy layer of plant material observed; and also the lower layer of any plant material on the surface of the soil. A significant amount, 86%, had foliar canopy cover, and further, only 6% was bare ground on the soil surface. We can infer from the results that the ground was mostly covered by revegetation at the CDOT locations surveyed. However, only 17% had basal cover; the ground had leaf and litter coverage, but the surface of the soil had 17% growing plants occupying space. A higher basal cover would mean more plants with wide basal leaves and/or tufted plants with spreading rhizomatous roots, instead of stems arising from taproots. This would provide more coverage and less competition for weeds, a major vegetation roadside problem. The highest score was on Hwy 285, which was 98% revegetated with 0% bare ground, and the highest plant basal cover, (24%) of any of the survey sites. The weeds were controlled at this site, and it proved to be excellently revegetated twelve years after construction. The lowest scores were on Hwy 50, where the canopy cover was 82%, with 16% bare ground, and only 14% basal cover; however, many of the plants recorded were weeds and introduced, non-native species. This exemplifies inadequate revegetation because of the non-native nature of the plants. Berthoud Pass had similar scores for cover, bare ground and basal coverage, but in contrast, most of the plants were natives; with the caveat that mixed conifer forests can have a low percentage of foliar ground cover due to high competition for sunlight and the accumulation of acidic conifer needles. Thus, Berthoud showed a better revegetation result. Qualitative Characteristics The data sheets for each survey also included an observational judgment of four qualitative characteristics, with a score of 1 – 5, low to high, for Grazing & Herbivory, Overall Health, Native Plant Abundance, and Ecological Continuity. Grazing & Herbivory The mean for Grazing & Herbivory was 2, which indicates a below average defoliating or clipping damage to plants. All of the plots showed below average grazing and herbivory. TREX showed considerable defoliation from insects; this is an urban environment with more concrete and warmth for insect reproduction. Damage was observed at Berthoud Pass due to grazing deer, elk and moose, along with small mammals, but there was little sign of insect grazing there. Overall Health and Native Abundance Overall Health mean was 3.2; about average, but the range of scores is wide, with Powers Blvd scoring the highest, at 4.2, where plants were tall and healthy with few noxious weeds, vs. Hwy 50 with a score of 2, where the healthiest plants appeared to be weeds and kochia, an introduced species. Native Abundance followed closely with a mean score of 3.3; similarly, Powers Blvd scored 4, and Hwy 50 a 2. These two categories tie
- 3. together; the observation of healthy native plants unencumbered by weeds leads to similar scores for each category. Hwy 285, Powers and Berthoud were all high in native plant diversity, with Berthoud Pass exhibiting the highest ratio of native plants. Monocultures of introduced grass species were observed, such as smooth brome, Kentucky bluegrass, timothy, and orchard grass, and these lowered the scores at several transects. These non-native species were historically used for restoration because of the high forage content for domesticated grazing animals, but are inappropriate for native restoration. Ecological Continuity Ecological Continuity takes into consideration the health of the surrounding landscape; the urban weedy survey sites were adjacent to urban weedy native sites. The mean is actually a little higher, at 3.4, than Overall Health and Native Abundance, with better than average continuity. Alas, weeds are abundant in urban environments, so the weedy roadside begins to blend with the surrounding weedy habitat. Powers Blvd Transect Plot One Year After Revegetation Efforts Although Powers Blvd. survey data was collected only one year after revegetation, the results are comparable to 10 -15 years of growth, at each of the four other sites surveyed. This could be attributed to several possible factors: • the level of detail, methodologies and management have improved over the past 15 years so that CDOT is better at revegetation; • In 2014 the area received good rainfall; • The first year's results are a good indicator of future right-of-way plant regeneration; • Hwy 50 is semi-desert and the saltbush take many years to develop, so it is not a comparable site; • Likewise, the elevation of Berthoud Pass’ plots was above 10,000 feet where, because of short growing seasons, plants can take many years to establish, and so was not comparable to Powers Blvd; • Powers Blvd. construction reclamation was superior in some other unidentified way to achieve as much plant growth in one year as the others in 10 to 15 years; • Roadside revegetation cannot be expected to consistently exceed these averages because of the inherent difficulties of vegetation reclamation; • Roadside maintenance over time introduces pollutants, and exotic plants get introduced which effect the overall health of roadside vegetation, causing degradation over time; • The survey sample is too small; • Other unidentified factors. Common Treatments and Amendments are Working Well The results of these diverse transect plots suggest that CDOT is doing a good job with right-of-way revegetation and should maintain and refine their Best Management Practices for reclamations. In general, soil amendments which improve the quality of the soil produce better vegetation. Specifically, the site’s soil needs to be analyzed and
- 4. matched, as in the case of Hwy 50, where the native soils have unusual characteristics, and creating better soil just makes fertile ground for weeds and non-native plants. Mulching and mulch tackifier are necessary to keep seeds in place and take advantage of precipitation on sites that are not irrigated. Adding compost to the topsoil mix elevates the organic matter content, contributes nutrients and improves moisture retention. Looking at Revegetation Success Relative to the Surrounding Natural Landscape If the goal is to produce a roadside of native, weed free vegetation, then the plant species of the immediate environments should be examined. Each of the five locations had a native reference, or background plot. It was often difficult to locate a reference plot contiguous to the right-of-way being plotted since most of the sites were populated and well developed and had altered plant species as a result of past ranching or farming. These scores below in Table 2 list the four characteristics relative to each location’s native plot, plus a group mean for each characteristic. A general viewing of these figures shows much more variation between the sites than the summary scores in Table 1. This is because each site is being compared to an ideal local native plot. Table 2 – Summary Scores for Relative Health Evaluations and Percent of Cover Site Grazing Overall Health Native Abundance Ecological Continuity Percent Seedmix Observed Hwy 285 60% 85% 68% 64% 35% TREX 117% 83% 63% 73% 31% Berthoud Pass 81% 85% 75% 87% 47% Powers Blvd 80% 105% 80% 80% 28% Hwy 50 55% 40% 40% 36% 16% *Mean 79% 80% 65% 68% 31% Again, it is informative to examine the high and low scores, and account for success and failure. Grazing The low score is on Hwy 50 with a score of 55%, and TREX with a score of 117%. The survey team observed a high level of defoliation and insect nests on the plants at TREX. A low score in this characteristic indicates a positive condition of low grazing or herbivory compared to the native adjacent plot. Small mammals were observed by the team at both sites. Overall Health The low is Hwy 50, with 40%, and the high is Powers Blvd with 105%. The challenges of clay soils, salinity and alkalinity along Hwy 50 have already been noted. Powers Blvd had received soils superior to the adjacent native plot, which may have accounted for
- 5. better plant health in the reclaimed area than the contiguous native plot. The other three locations show good overall plant health. Native Abundance The low score is Hwy 50, with 40%; the high is Powers Blvd scoring 80%, followed by Berthoud Pass with 75%. Hwy 50 plant coverage was comprised mainly of weeds, whereas Powers Blvd and Berthoud Pass plant coverage was a diverse mix of native species. Seedmix establishment and native plant colonization were very good at both of these sites because of improved soil amendments during reclamation. Ecological Continuity The low score is 36% for Hwy 50, and the high is 87% for Berthoud Pass. Hwy 50’s roadside revegetation of weedy species appeared very different from the indigenous mat saltbush community. Berthoud Pass roadside revegetation appeared very similar to the native plot, comprising many diverse plant species. Percent Seedmix Observed This category, not originally in the scope of work, was added to quantify the level of success of the seedmix plant species’growth. Again, Hwy 50 is the low score, with 16% of the seedmix species observed, and Berthoud Pass is the highest score, with 47% observed. Hwy 50 seedmix could have included a species list better matched to the natural environment, particularly the grasses, although the chosen shrub species were correct. Berthoud Pass seedmix was composed of several species native to the area, and this helped plant establishment, health, and overall revegetation. Recommendations • A survey of existing vegetation and percent cover should be conducted prior to commencing construction. This data should determine the components of the seedmix. An observational walk-through and compilation of plant species at an adjacent native site will result in a list long enough to be able to cull 8-14 plant species which grow naturally on site from which the seedmix of available species and the quantities needed can be derived. • The reclamation seedmix should contain native plant species only, no introduced species. • Grass species might be considered exclusively in the first year, followed by an application of herbicides to eliminate weeds, followed by a seeding of native grasses and forbs in the second year. • Seedmix should contain at least one sterile species (such as oats used at Powers or Regreen used at Hwy 50) to quickly establish ground cover; or a one-season crop species to provide coverage by the end of the first season. This controls early weeds and exotic species the following spring. Ground coverage is the goal. • Additionally, the seedmix needs a plant species, such as slender wheatgrass (Elymus trachycaulus) for montane, sub-alpine and alpine habitats, which is early successional; these grasses establish quickly and typically flourish for 2-3 years while native plant seeds colonize from the surrounding area. The NRCS
- 6. document, Early Successional Habitat, can be used as a resource reference for development of Best Management Practices. • Best Management Practices, such as retaining and redistributing topsoil, must be maintained. This topsoil should be disturbed as little as possible and scrapped mechanically to preserve the soil horizon. • Detritus such as chipped trees and brush, grounded sticks and logs, leaves and dead plant matter can be used in the top soil layer as these encourage the development of mycorrhizal fungi. Mycorrhizal inoculation should be tested for viability and cost considerations. • Seedmix needs to be diverse enough to encompass plant species with different basal growth forms and different root systems. Select for basal growth rosettes, as well as robust stems; for roots fibrous and rhizomatous vs. a long taproot. This diversity provides vegetation cover in different conditions. This provides some insurance against extreme weather conditions such as drought or flooding due to changing climates. . References Early Successional Habitat, NRCS; 2007; http://www.nrcs.usda.gov/Internet/FSE_DOCUMENTS/nrcs143_010001.pdf
- 7. document, Early Successional Habitat, can be used as a resource reference for development of Best Management Practices. • Best Management Practices, such as retaining and redistributing topsoil, must be maintained. This topsoil should be disturbed as little as possible and scrapped mechanically to preserve the soil horizon. • Detritus such as chipped trees and brush, grounded sticks and logs, leaves and dead plant matter can be used in the top soil layer as these encourage the development of mycorrhizal fungi. Mycorrhizal inoculation should be tested for viability and cost considerations. • Seedmix needs to be diverse enough to encompass plant species with different basal growth forms and different root systems. Select for basal growth rosettes, as well as robust stems; for roots fibrous and rhizomatous vs. a long taproot. This diversity provides vegetation cover in different conditions. This provides some insurance against extreme weather conditions such as drought or flooding due to changing climates. . References Early Successional Habitat, NRCS; 2007; http://www.nrcs.usda.gov/Internet/FSE_DOCUMENTS/nrcs143_010001.pdf