Work culture and human resource development
•Als DOCX, PDF herunterladen•
0 gefällt mir•92 views

Research Paper

Empfohlen
Weitere ähnliche Inhalte
Was ist angesagt?
Was ist angesagt? (20)
Ähnlich wie Work culture and human resource development
Ähnlich wie Work culture and human resource development (20)
Mehr von Dr. Deepak Raverkar
Mehr von Dr. Deepak Raverkar (12)
Kürzlich hochgeladen
Kürzlich hochgeladen (20)
Work culture and human resource development
- 1. 1 WORK CULTURE AND HUMAN RESOURCE DEVELOPMENT Prof. Dr. Deepak P. Raverkar Associate Prof. & HOD of Commerce, Dr. C. D. Deshmukh Commerce College, Roha- Raigad. Maharashtra – (India) Mobile No. 9822835979 (dpraverkar@gmail.com) ABSTRACT Good work culture is one that is conducive for high levels of organizational performance, the indices of which are productivity, profits and growth. Strong work culture and maintaining higher satisfaction level in work force determine not only performance of the organization but also affect the growth and development of the employees. “HRD is the process in which the human factor is regarded a productive resource at the first instance and efforts are undertaken to explore and develop their potential through a well-planned education, training and recognition with the main object of quality life to everyone.” In the micro sense, Human resource is concerned with a single production unit and defined as the aggregate of production capabilities of employees as reflected in their inherent and acquired knowledge, skill, creative abilities and talents, including their aptitude and attitude to work. Thus, the available manpower with business organization can be considered as Human Resource only when they are skillful, creative, and talented and possess inherent capability and positive attitude towards work system or mechanism. The researcher has analyzed three important aspects which are the positive result of synergic work culture and employee satisfaction. That are; 1) Building Leadership and Management Capability, 2) Creating Productive Workplace Culture, and 3) Innovation and the Use of Technology. Key words: Work culture, Human resource development, Building Leadership, Productive workplace culture, Innovation and use of technology. INTRODUCTION The positive or synergetic work culture provides productive work place culture and gives maximum satisfaction to the employees. A satisfied, happy and hardworking employee has a positive attitude and he cooperates to the every endeavor of an enterprise. Work force of any industry is the biggest asset for any organization and is responsible to a large extent for its productivity and profitability. Efficient human resource management and maintaining higher satisfaction level in work force determine not only performance of the organization but also affect the growth and development of the employees. HRD is the process in which the human factor is regarded a productive resource at the first instance and efforts are undertaken to explore and develop their potential through a well- planned education, training and recognition with the main object of quality life to everyone.
- 2. 2 STATEMENT OF THE PROBLEM Roha is one of the Taluka place in the Raigad district. In 1973, the State Government has established Maharashtra Industrial Development Corporation in Dhatav-Roha. Many small and medium scale industries have started industrial units and running successfully over the last forty years. The total number of workers in this MIDC is near about 3000. For this project, 404 respondents from different age groups, experience, education and income levels have selected. Here the researcher has analyzed three important aspects of HRD which are the positive result of synergic work culture and employee satisfaction. That are; 1) Building Leadership and Management Capability, 2) Creating Productive Workplace Culture, and 3) Innovation and the Use of Technology. Hence, the present study examines the human resource development which play important role in positive attitude and productivity of industrial workers with special reference to Roha industrial area. OBJECTIVES OF THE STUDY This study is undertaken specially with the following objectives. a) To study the various factors of human resource development. b) To examine the attitude towards overall factors of human resource development among workers in selected industries in Roha. c) To examine the role of work culture in the development of human resource. LITERATURE REVIEW Organizational work culture can either be good or bad, in the sense that good work culture is one that is conducive for high levels of organizational performance, the indices of which are productivity, profits and growth. According to Likert (1961) the best performance climate involves openness, trust, sharing two way communication and participative leadership. This list is not complete since work culture pertains to an organization therefore; order and discipline are prime requisites for organizational success. Prof. Len Nadler defines Human Resource Development as “an organized learning experience within a given period of time with the objective of producing possibility of performance of change”. In the micro sense, Human resource is concerned with a single production unit and defined as the aggregate of production capabilities of employees as reflected in their inherent and acquired knowledge, skill, creative abilities and talents, including their aptitude and attitude to work. Thus, the available manpower with business organization can be considered as Human Resource only when they are skillful, creative, and talented and possess inherent capability and positive attitude towards work system or mechanism. METHODOLOGY ADOPTED One tool was meant to obtain the information regarding overall human resource development aspects on building leadership and management capabilities, creating productive work culture and use of technology including three statements on each of the aspect using 5 points Likert scale ranging from 5) Always 4) Sometimes 3) Hardly Ever 2) Not at all and 1) Don’t know. The questions and the responses thereon are explained in the result and discussion.
- 3. 3 STATISTICAL TOOLS FOR ANALYSIS The frequencies, mean and standard deviation, are the tools used for analysis. RESULTS AND DISCUSSION 1) BUILDING LEADERSHIP AND MANAGEMENT CAPABILITIES Building Leadership and Management capabilities among the workers develops synergic work culture and their relationships that facilitate to strong culture and high performance is the centrality of leadership role. The individuals in a group bring with them their individual levels of skills, education and training, as well as their personal traits and acquired social values. The researcher has measured the variable of building leadership and management capabilities at five scale options with the help of three questions on following aspects mentioned with their frequencies. Table 1 Encouragement for Leadership at Work Place Frequency Percent Valid Percent Cumulative Percent Valid Always 171 42.3 42.3 42.3 Sometimes 96 23.8 23.8 66.1 Hardly Ever 122 30.2 30.2 96.3 Never 10 2.5 2.5 98.8 Don't Know 5 1.2 1.2 100.0 Total 404 100.0 100.0 Table 2 Investment in Training and Development Programme for the Workers. Frequency Percent Valid Percent Cumulative Percent Valid Always 179 44.3 44.3 44.3 Sometimes 82 20.3 20.3 64.6 Hardly Ever 106 26.2 26.2 90.8 Never 19 4.7 4.7 95.5 Don't Know 18 4.5 4.5 100.0 Total 404 100.0 100.0
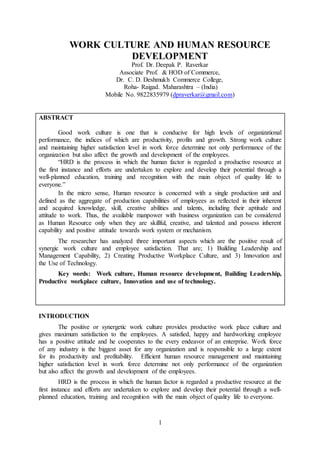
- 4. 4 Table 3 Workplace support for Innovative Thinking and New Ideas. Frequency Percent Valid Percent Cumulative Percent Valid Always 161 39.9 39.9 39.9 Sometimes 113 28.0 28.0 67.8 Hardly Ever 112 27.7 27.7 95.5 Never 11 2.7 2.7 98.3 Don't Know 7 1.7 1.7 100.0 Total 404 100.0 100.0 . Graph 1 Building Leadership and Management Capabilities An analysis from the graph 1 shows that there are the mixed responses about the encouragement of leadership at the workplace at every level of the organization. About 42% of respondents felt their organization encourages leadership at every level. However, 30% of respondents felt that this is done hardly and 24% said this is taking place sometimes/not regularly. This indicates that there is need to introduce leadership building programs for workers at all levels. 42.3 44.3 39.9 23.8 20.3 28 30.2 26.2 27.7 2.5 4.7 2.71.2 4.5 1.7 0 5 10 15 20 25 30 35 40 45 50 Encouragement to Leadership Investment in Training & Development Support to Innovative Ideas Building Leadership and Management Capabilities Always Sometimes Hardly ever Not at all Don't know
- 5. 5 An analysis from the above graph indicates that a substantial proportion 44 percent of respondents felt that their organization made investment on development and training programs for its workers. This shows that the training and the capacity building for workers is the priority for the management. However, nearly one- fourth of the respondents also felt that there is no any investment in development and training for its workers. Therefore, the management has to make an investment for providing training to workers regularly which make them up-to date and improves efficiency. An analysis from the above graph indicates mix feeling about having their innovative thinks and many uses of innovative ideas in the production process. About 40 percent felt that there is always support for their ideas whereas about 28 percent opined that there is hardly any support and remaining 25 percent said it happens sometime. At workers level about the suggestion and innovative thinking 40 percent positive responses should be considered worth as most of the workers may not have courage and some may not have a high level mental capacity for new ideas. The organization should encourage the workers for innovative ideas and proper environment should be given for exposure to the workers. An initiative of management will be helpful for developing the innovative culture among the workers with help of participation and involvement in the various activities of the organization. Table 4 Mean and Standard Deviation of Building Leadership and Management Capabilities N Minimum Maximum Mean Std. Deviation Building Leadership and Management Capabilities 404 1.67 5.00 4.0008 .75088 2) PRODUCTIVE WORKPLACE CULTURE Productive Work Culture is a combination of various attributes. Gillis. Broome & Selznick (1968) indicated three areas of culture i.e. Shared values, Beliefs and Behavioral Norms. It means the shared things make the workplace productive and foster synergic work culture. Therefore, the researcher has collected the responses on four different questions which indicate the level of shared values, ideas and organizational support for these things. The aspects covered under this dimension are given below with their frequencies table:- Table 5 Workplace Treat Each Other Well and Value Others’ Ideas. Frequency Percent Valid Percent Cumulative recent Valid Always 253 62.6 62.6 62.6 Sometimes 90 22.3 22.3 84.9 Hardly Ever 57 14.1 14.1 99.0 Never 3 .7 .7 99.8 Don't Know 1 .2 .2 100.0 Total 404 100.0 100.0
- 6. 6 Table 6 Sharing of Same Goals and Value other’s Ideas by Workers Frequency Percent Valid Percent Cumulative Valid Always 200 49.5 49.5 49.5 Sometimes 106 26.2 26.2 75.7 Hardly Ever 80 19.8 19.8 95.5 Never 9 2.2 2.2 97.8 Don't Know 9 2.2 2.2 100.0 Total 404 100.0 100.0 Table 7 Feeling about Reward from Organization for Good Ideas Frequency Percent Valid Percent Cumulative Valid Always 175 43.3 43.3 43.3 Sometimes 105 26.0 26.0 69.3 Hardly Ever 78 19.3 19.3 88.6 Never 40 9.9 9.9 98.5 Don't Know 6 1.5 1.5 100.0 Total 404 100.0 100.0 Table 8 Feeling about Feedback on Work Environment from Workers Frequency Percent Valid Percent Cumulative Valid Always 200 49.5 49.5 49.5 Sometimes 101 25.0 25.0 74.5 Hardly Ever 83 20.5 20.5 95.0 Never 7 1.7 1.7 96.8 Don't Know 13 3.2 3.2 100.0 Total 404 100.0 100.0
- 7. 7 Graph 2 Feeling about Creating Productive Workplace Culture An analysis from the above Graph No. 2 revealed that 62.6 percent respondents indicate positive feeling about the respect each other at the workplace. Therefore, it is important to note that almost two-third respondents felt that their workplace treat them well and value each other’s ideas to work as a team. This shows that the industries have developed a team culture which is an important element in achieving sustainable and quality products. From the above Table 6 and Graph 2 it found that 49.5 percent have positive feeling about the same goals and values shared by the staff. It means nearly 50% of the respondents opined that the employees share same goals and values. However, one fourth of respondents are either disagrees with this or do not have idea about it. An analysis from Table 7 and Graph 2 indicate that rewarding employees for participating in events and suggesting ideas is always there for about 43% employees and 23% opined that it happened sometimes. Reward to the workers for any event is always encouraging to them as it gives recognition for the good work done and develops synergic work culture in the organization. The above Table 8 and Graph 2 reveals that 49.5 percent workers replied that organization collects the feedback about work environment always and 25 percent sometimes. Therefore, about 50% respondents have opined that the management gathers feedback and ideas for improving it. About 25% felt it is only sometimes. 62.6 49.5 43.3 49.5 22.3 26.2 26 25 14.1 19.8 19.3 20.5 0.7 2.2 9.9 1.70.2 2.2 1.5 3.2 0 10 20 30 40 50 60 70 Workplace Treat each other Well Sharing of Goals & Values Organiztional Reward for Good Ideas Feedback From Workers about work environment Productive WorkplaceCulture Always Sometimes Hardly ever Never Don't know
- 8. 8 Table 9 Mean and Standard Deviation of Creating Productive Workplace Culture N Minimum Maximum Mean Std. Deviation Creating Productive Workplace Culture 404 1.00 5.00 4.2011 .65750 3) INNOVATIONS AND THE USE OF TECHNOLOGY Another dimension taken for study is Innovation and the Use of Technology to improve the synergic work culture. In the arena of globalization the importance of innovation and up-to-date technology can’t be neglected. Therefore, the researcher has collected the responses from the workers on the following aspects through three questions shown below along with their frequencies:- Table 10 Responses of workers about Investment in Research Frequency Percent Valid Percent Cumulative Percent Valid Always 204 50.5 50.5 50.5 Sometimes 82 20.3 20.3 70.8 Hardly Ever 71 17.6 17.6 88.4 Never 9 2.2 2.2 90.6 Don't Know 38 9.4 9.4 100.0 Total 404 100.0 100.0 Table 11 Workers Involvement in Decision Making About New Technology. Frequency Percent Valid Percent Cumulative Percent Valid Always 90 22.3 22.3 22.3 Sometimes 106 26.2 26.2 48.5 Hardly Ever 125 30.9 30.9 79.5 Never 68 16.8 16.8 96.3 Don't Know 15 3.7 3.7 100.0 Total 404 100.0 100.0
- 9. 9 Table 12 Training To Workers When New Technology Is Introduced. Frequency Percent Valid Percent Cumulative Valid Always 220 54.5 54.5 54.5 Sometimes 84 20.8 20.8 75.2 Hardly Ever 69 17.1 17.1 92.3 Never 24 5.9 5.9 98.3 Don't Know 7 1.7 1.7 100.0 Total 404 100.0 100.0 Graph 3 Feelings of workers about Innovation and New technology An analysis from Table 10 and the Graph 3 indicates significant proportion (50.5%) of respondents revealed that their organization invest on research and development of new ideas, products and services. It means that organization provides latest machines and equipment which helps for improving the productive work culture. An analysis from Table 11 and Graph 3 shows that only 22.3 percent workers opined always, 26.2 sometimes and nearly 31percent hardly ever suggestion seeking about that technology is useful to introduce on to the organization. As far as the decision on new technology is concerned, the workers may not know about the developments and therefore the participation shown is satisfactory. 50.5 22.3 54.5 20.3 26.2 20.8 17.6 30.9 17.1 2.2 16.8 5.9 9.4 3.7 1.7 0 10 20 30 40 50 60 Investment in Research and Development Participation in Decision about New Technology Training to Workers When New Tech.introduced Innovation and New technology Always Sometimes Hardly ever Not at all Don't know
- 10. 10 An analysis from the above Table 12 and Graph 3 revealed that, 54.5 percent workers receives trainings always and 20.8 percent sometimes wherever new technology introduced into the organization. This indicates that there is need to undertake frequent training programme for all the workers concerned. According to Harris, “Training of any kind should have as its objective the redirection or improvement of behavior so the performance of the trainee becomes more useful and productive for himself and for the organization of which he is a part” An analysis of Innovation and the Use of Technology indicates mix feeling of respondents. The following Table 5.14 is exhibited to show mean and standard deviation of this dimension. Table 13 Mean and Standard Deviation of Innovation and Use of Technology N Minimum Maximum Mean Std. Deviation Innovation and the Use of Technology 404 1.00 5.00 3.8903 .84098 Source: Statistical Analysis from Primary Data. CONCLUSIONS As far as the isolate analysis is concerned, it shows mixed feeling from the workers about leadership, training programme and innovative thinking. But if we analyzed and observed the mean of ‘Building Leadership and Management capabilities’ it is 4.0008 which indicates satisfactory level. Mendonca and Kanungo (1990) pointed out the typical aspects of the Indian way of management wherein decision process was centralized, allowing less scope for employees to be updated about different aspects of management. Therefore, in the light of the various factors such as education level of workers, Roha being a semi-urban area and dominating style of superiors, the encouragement for leadership and innovative ideas is remarkable. An analysis from Table 9 about creating productive workplace culture shows mixed feeling in the above four questions but if we observed a mean of this dimension, it is 4.2011 which shows a satisfactory level of sharing ideas, goals and value. It indicates the workers have positive team spirit which contributes towards a productive workplace culture. From the above Table 13 it is revealed that the mean of the Innovation and Use of Technology dimension is 3.8903 which look satisfactory. It means that the industries are taking an adequate care of research and developments and making their workers trained when they are introducing new technology. In brief, it is conclude that, the satisfied, happy and hardworking employee of Roha industrial area has a positive attitude and they cooperate to the every endeavor of an enterprise for their development. Work force of these industries is the biggest asset for organization and is responsible to a large extent for its productivity and profitability. ------------------------------
- 11. 11 REFERENCES 1) Dr. Anjali Ghankar “Human Resource Management” Everest Publishing House p 311 2) Dr. Subramanian, V. “Wanted a new work culture to check the Drift’, The Hindu, August 10, 1993. 3) J.B.P. Sinha “Work culture in the Indian context” sage Publication, New Delhi. 4) Mendonca, M. and Kanungo, R. N. (1990). ‘Performance Management in Developing Countries’. In: R. N. Kanungo and A. M. Jaeger (Eds.), Management in Developing Countries. London: Rutledge, 223-251. 5) Adler, N.J., International Dimensions of Organizational Behaviour, New Delhi. 6) Anu Singh Lather, Abha Kumar and Shilpa Jain paper titled as perception of work culture and its impact on performance in DMRC published in Indian journal of marketing August, 2012. 7) Singh, Kavita (2001). Work values and work culture in Indian organizations: Evidence from automobile industry, Delhi Business Review, 2(2): 1-9. 8) Harbison, F.H., 1973, Human Resources as the Wealth of Nations, Oxford University Press, London 9) Sheikh Moksadur Rahman, 2012, “An Analysis of Job Satisfaction among teachers working in government Colleges in Banladesh”, Prabandhan Indian Journal of Management Dec. 2012. 10) Khurana,S., 1972, Industrial Relations in Private and Public Sector Industry in India: A Comparative Analysis, Indian Journal of Industrial Relations, 7(3): 411-431.