Application FTIR and NIR in food
•Als PPTX, PDF herunterladen•
22 gefällt mir•9,075 views

Applications of Spectroscopy techniques like FTIR and NIR (Fourier Transform Spectroscopy) and (Near Infarred Spectroscopy)

Empfohlen
Weitere ähnliche Inhalte
Was ist angesagt?
Was ist angesagt? (20)
Andere mochten auch
Andere mochten auch (20)
Ähnlich wie Application FTIR and NIR in food
Ähnlich wie Application FTIR and NIR in food (20)
Mehr von Debomitra Dey
Mehr von Debomitra Dey (10)
Kürzlich hochgeladen
Kürzlich hochgeladen (20)
Application FTIR and NIR in food
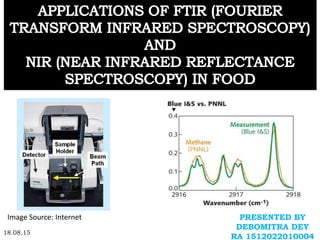
- 1. PRESENTED BY DEBOMITRA DEY RA 1512022010004 18.08.15 Image Source: Internet
- 2. WHAT IS FTIR? FTIR ANALYSIS APPLICATIONS IN FOOD (QUANTITATIVE AND QUALITATIVE ANALYSIS) WHAT IS AT-FTIR? WHAT IS NIR? NIR APPLICATIONS IN FOOD OUTLINE: 1. QUALITATIVE (FTIR) 2. QUANTITATIVE (AT-FTIR)
- 3. WHAT IS FTIR? It is the technique used to obtain spectrum of absorption, emission The main aim is to measure the amount of light absorbed by a sample at each wavelength FTIR has application both in Qualitative and Quantitative Analysis It is a non-destructive, time saving method, can detect range of functional groups and is sensitive to change in molecular structure (Amir et al. 2013).
- 4. SOME CHARACTERISTIC INFRARED ABSORPTION PEAKS Source: Skoog
- 5. WHAT IS FTIR? CONTD. Infrared spectroscopy is a powerful spectroscopy technique and can utilized for both quantitative and qualitative analysis, as the output received is a detailed information about the chemical composition of the substance in the IR spectrum (Sedman et al). FTIR spectroscopy is an appealing technology for the food industry because simple, rapid, and non-destructive measurements of chemical and physical components can be obtained (Saona et al. 2011). Advances in FTIR instrumentation combined with the development of powerful multivariate data analysis methods make this technology ideal for large volume, rapid screening and characterization of minor food components down to parts per billion (ppb) levels (Saona et al. 2011)
- 6. COMMON APPLICATIONS OF FTIR IN FOOD Infrared Milk Analyser, to determine Fat, Protein, Lactose content. Measurement of degree of unsaturation of fats and oils. Identification of flavour and aroma, FTIR in combination with GC. Can be used to analyse and evaluate essential components from cinnamon barks. For packaging film- to identify structural changes occurred due to exfoliation or intercalation of layered silicates in polymer matrix.
- 7. 1. QUALITATIVE ANALYSIS Two applications: 1. FTIR in identification of wheat varieties. 2. FTIR for spectroscopy of Edible Oil. APPLICATIONS OF FTIR
- 8. Qualitative characteristic studies FTIR works on basis of functional group and provides information in the form of peaks On the basis of the peak value of moisture, protein, chemical, physical and rheological properties and grain hardness by standard methods were determined.
- 9. FTIR provides information on the basis of chemical composition and physical state of whole sample (Cocchi et al. 2004) Peaks for water were observed on 1,640 cm−1 and 3,300 cm−1 (Manley et al. 2002). FTIR is one of the most elusive methods for the analysis of moisture. Water absorbs strongly in the infrared region of the spectrum due to its OH stretching and H bending vibrations however its quantization is frequently complicated by spectral interferences from other OH containing constituents such as alcohols, phenols and hydro peroxides and confounded further by hydrogen bonding effects (Dong et al. 2000). FTIR provides an excellent means to visualize the chemical composition of different wheat varieties and it is very quick, reliable and cheaper analytical technique which can effectively be used for estimation of different wheat quality parameters. (Amir et al. 2013).
- 10. Qualitative determination of organic compounds as characteristic vibrational mode of each molecular group causes appearance of bands in IR at specific frequency, further influenced by surrounding functional groups (Vlachos et al. 2006) The application of FTIR in present study – 1. Determination of extra virgin olive oil adulteration with various vegetable oil (sunflower oil, soya bean oil, sesame oil, corn oil) 2. Oxidation process monitoring of corn oil (QUANTITATIVE ANALYSIS)
- 11. RESULT FOR ADULTERATION OF VIRGIN OLIVE OIL
- 12. For Oxidation: Oil sample was heated with UV radiation FTIR spectra was collected at different temperature Results are collected and compared with peroxide value method The band shift observed at 3009 cm-1 assigned to C-H stretching vibration of cis-double bond allow determination of extra virgin oil adulteration.
- 13. Other applications of Qualitative analysis of FTIR are detection of moisture content, fat, protein in milk products, lipid content in oils. FTIR spectra of bacteria are specific to a given strain and show the spectral characteristics of cell components, such as fatty acids, membrane and intracellular proteins, polysaccharides, and nucleic acids (Dziba et al. 2007). Fourier transform infrared (FTIR) technology has substantial potential as a quantitative quality control tool for the food industry. FTIR analysis methods are convenient, rapid and automatable, and in conjunction with attenuated total reflectance (ATR) technology, dramatically simplify sample handling. The key elements of FTIR spectroscopy are presented along with a selection of methods under development, including analyses of milk, meats, fats and oils, butter, sweetened condensed milk and juices. (Voort 1992). FTIR APPLICATIONS (QUALITATIVE ANALYSIS)
- 14. Difficulties in sample handling, limited exploitation of Infrared Spectroscopy as an analytical technique in areas like food analysis. DISADVANTAGES OF USING FTIR For Quantitative Analysis FTIR is an excellent tool for quantitative analysis as intensity of band is directly proportional to the concentration (Beer Lambert’s Law)
- 15. WHAT IS AT-FTIR? Attenuated Total Reflectance – FTIR How does it work? Optical principle unlike FTIR (Transmission) ATR technique provides one of the easiest and most convenient ways of handling samples for Infrared spectroscopy ATR-FTIR can convert ATR spectra to Transmission spectra by correcting wavelength dependence of effective path length, thus making possible to compare ATR and Transmission spectra The versatility of ATR is its sampling technique i.e. HATR (Horizontal Attenuated Total Reflectance). For e.g.. In food used for minced meat, and solid chocolate. Replace constant path transmission cells, salt plates, KBr pellets used in analysis liquid, semi-liquid and solids. (FTIR)
- 17. APPLICATIONS OF FTIR 2. QUANTITATIVE ANALYSIS AT-FTIR 1)SUGAR ANALYSIS 2)FRUIT CONTAINING PRODUCTS 3)SWEETENED CONDENSED MILK 4)FATS AND OILS
- 18. 1.SUGAR ANALYSIS Based on bands in 1250-900 cm-1 region, which mainly represents C-OH bending vibration. Sugars like Sucrose, Glucose and Fructose. Individual sugar has characteristic set of absorption in this region, these bands are severely overlapped in the spectrum of mixture of sugars. However, with the application of multi-variate analysis techniques, quantitation of individual sugars in such mixtures can be achieved. P-matrix method.
- 19. ATR-FTIR SPECTRA OF SUCROSE (A), GLUCOSE (B), FRUCTOSE (C)
- 20. 2. FRUIT CONTAINING PRODUCT Spectra for detection of adulteration in Fruit jams and Purees. The spectra of Jam was dominated by the presence of water. Spectra of Fruit Puree – the fruits were freeze thawed then blended in the food mixer. Common adulteration observed- Sucrose, Apple Puree, Plum Puree. Further the authors concluded that FTIR/ATR can be employed for detection of adulterants in freeze dried instant coffee, authentication of meats.
- 21. 3. SWEET CONDENSED MILK (SCM) Method developed by McGrill IR Group. Extensively used ingredient in manufacture of bakery products, confectionery, etc. Composition of SCM Highly viscous, caution while selecting the ATR accessory i.e. ATR crystal. Spectral region above 1500cm-1 is dominated by water absorption bands @ ~3400 and 1640 cm-1. Major spectral feature C-H stretching absorption @ 2927-2855 cm-1. Ester linkage carbonyl absorption of fat @ 1747 cm-1. Amide bands of protein and sugar absorption bands at 1250- 900 cm-1. 1. Milk fats 8.5-9.7% 2. Milk Solids 28.5-30% 3. Sugar 43.5- 44.8%
- 22. FTIR/ATR SPECTRUM OF SCM DIFFERENCE IN SPECTRUM OBTAINED BY SCALED SUBTRACTION OF THE SPECTRUM OF WATER 1- C-H STRETCHING ABSOPRTION, 2-ESTER CARBONYL ABSORPTION 3, 4- AMIDE BANDS OF PROTEINS, 5- CARBOHYDRATE ABSORPTIONS
- 23. 4. FATS AND OILS Analysis of fats and oils in determination of isolated trans isomers, official method by AOCS (American Oil Chemists Society), Association of Official Analytical Chemists (AOAC). Determination is based upon peak height of absorption band of isolated trans bonds @ 966 cm-1, which is due to C=C-H bending vibration. Further FTIR/ATR can used for monitoring oil oxidation.
- 24. WHAT IS NIR? NEAR INFRARED REFLECTANCE SPECTROSCOPY Based on molecular overtone and vibration Molar absorptivity is quite small Depending on the same the spectra maybe measured either in transmission or reflection
- 25. Image source: Internet NIR SPECTROPHOTOMETER
- 26. The major advantage of NIR is that usually no sample preparation is necessary, hence the analysis is very simple and very fast (between 15 and 90 s) and can be carried out on-line. One of the strengths of NIR technology is that it allows several constituents to be measured concurrently. In addition, for each fundamental vibration there exists a corresponding series of overtone and combination bands with each successive overtone band approximately an order of magnitude less intense than the preceding one. This provides a built-in dilution series which allows several choices of absorptions of different intensity containing the same chemical information. Finally, the relatively weak absorption due to water enables high- moisture foods to be analysed (Osborne, 2000). ADVANTAGES OF NIR SPECTROSCOPY
- 27. APPLICATIONS OF NIR SPECTROSCOPY 1.To predict meat and meat products Predict the content of main chemical component i.e. crude protein (CP), Intramuscular fat (IM), moisture/dry matter. Water is a variable component , almost 75% of total matter; specific absorbance of O-H bonds @ 1450 and 1940 nm in NIR spectra. For the analysis of CP and IM specific absorbance @ 1460-1540 nm and 2000-2180nm respectively. NIR spectroscopy has considerable potential to predict simultaneously several meat into quality classes. NIR is suitable alternative to analytical procedures which can be time consuming expensive and sometimes hazardous to health and environment (Prieto et al, 2009).
- 28. Most NIR spectroscopy research on citrus fruit have focussed on internal quality attributes (Lin et al, 2010, Gómez et al, 2006, Fraser et al, 2003). Molecular vibrations particularly by O-H and C-H bonds are responsible for strong absorption bands in the NIR spectral region by biological material, with the absorption band of O-H bonds dominating in hydrated material (Golic et al 2003, Nicolaĭ et al 2009). 2. Internal and External Quality Analysis of Citrus Fruit
- 29. REFERENCES 1. Amir Muhammad Rai, Anjum Muhammad Fquir, Khan Issa Muhammad, Khan Rafiq Mozzam, Pasha Imran, Nadeem Muhammad, Application of FTIR Spectroscopy for identification of wheat varieties (2013), Journal of Food Science Technology, 50(5), pp: 1018-1023. 2. Brian G Osborne, Near Infrared Spectroscopy in Food Analysis, (2006), John Wiley & Sons. 3. Magwaza S Lembe, Opara Umezuruike, Nieuwoudt Helene, Cronje J R Paul, Saeys Wouter, Nicolai Bart, Near Infrared Reflectance Spectroscopy Applications for Internal and External Quality Analysis of Citrus Fruit- A Review, Food Bioprocess Technology, (2011) Vol 5. Issue 2, pp: 425-444.
- 30. 4. Mossaba, Spectral Methods in Food Analysis, 1998 CRC Press, pp. 409-422. 5. Prieto N, Roehe R, Lavin P, Batten G, Andres S, Application of NIR spectroscopy to predict meat & meat products quality- A review (2009), Meat Science 83, pp: 175-186. 6. Vlachos N, Skopelitis Y, Psarondaki M, Konstantinidon V, Chatzilazarou A, Tegou E, Applications of Fourier Transform Infrared Spectroscopy to edible oils (2006), Analytica Chimica Acta, 573-574, pp: 459-465.