Weitere ähnliche Inhalte
Ähnlich wie Absorptionratesapril (20)
Kürzlich hochgeladen (20)
Absorptionratesapril
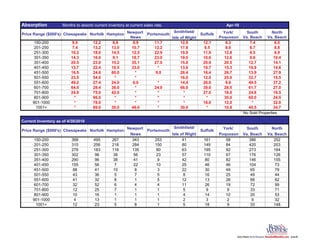
- 1. Absorption Months to absorb current inventory at current sales rate. Apr-10
Smithfield/
Price Range ($000's) Chesapeake Norfolk Hampton Newport Portsmouth Suffolk York/ South North
News Isle of Wight Poquoson Va. Beach Va. Beach
150-200 9.0 12.2 8.8 8.9 11.7 12.9 12.1 8.3 7.4 8.0
201-250 7.4 13.2 13.0 10.7 12.2 17.8 8.5 8.0 6.7 8.8
251-300 10.2 18.0 14.5 12.5 22.9 19.9 11.9 12.8 6.5 8.9
301-350 14.3 16.0 9.1 18.7 23.0 19.0 10.6 12.6 9.6 10.4
351-400 20.5 23.0 15.2 35.1 27.0 15.8 20.9 20.5 12.7 14.1
401-450 13.7 22.4 10.5 33.0 * 13.6 19.7 15.3 16.9 14.6
451-500 16.5 24.6 60.0 * 9.0 26.4 16.4 26.7 13.9 27.9
501-550 23.5 54.0 * * 16.0 12.0 25.0 32.7 15.5
551-600 49.2 27.4 24.0 6.0 * 14.4 26.0 9.8 49.5 37.2
601-700 64.0 28.4 36.0 * 24.0 66.0 39.0 28.5 61.7 27.0
701-800 24.0 75.0 42.0 * * * 27.0 18.0 24.8 18.5
801-900 * 96.0 * * * * * 30.0 60.0 24.5
901-1000 * 78.0 * * * * 18.0 12.0 * 32.0
1001+ * 69.0 30.0 48.0 * 30.0 * 10.8 40.5 34.7
* No Sold Properties
Current Inventory as of 4/30/2010
Newport Smithfield/ York/ South North
Price Range ($000's) Chesapeake Norfolk Hampton Portsmouth Suffolk
News Isle of Wight Poquoson Va. Beach Va. Beach
150-200 368 495 267 343 253 41 161 58 386 252
201-250 310 256 218 284 150 80 149 84 420 203
251-300 276 183 116 135 80 63 195 92 273 164
301-350 302 96 38 56 23 57 110 67 176 126
351-400 290 96 38 41 9 42 80 82 146 155
401-450 155 56 7 22 10 25 46 46 104 73
451-500 88 41 10 8 3 22 30 49 65 79
501-550 43 36 5 7 5 8 16 25 49 44
551-600 41 32 8 1 5 12 13 26 66 62
601-700 32 52 6 4 4 11 26 19 72 99
701-800 12 25 7 1 1 5 9 9 33 71
801-900 10 16 1 1 1 4 14 10 20 53
901-1000 4 13 1 1 1 2 3 2 9 32
1001+ 12 23 5 8 1 5 18 9 33 148
- 2. Total Absorption Rate All Areas for Apr 2010
Price Range Active Listings Sold Properties Transactions Months to Absorb
($000's) 11/1/09-4/30/10 Per Month
150-200 2624 1675 279.2 9.4
201-250 2154 1411 235.2 9.2
251-300 1577 881 146.8 10.7
301-350 1051 507 84.5 12.4
351-400 979 332 55.3 17.7
401-450 544 201 33.5 16.2
451-500 395 117 19.5 20.3
501-550 238 58 9.7 24.6
551-600 266 57 9.5 28.0
601-700 325 54 9.0 36.1
701-800 173 42 7.0 24.7
801-900 130 18 3.0 43.3
901-1000 68 9 1.5 45.3
1001+ 262 33 5.5 47.6
Months to Absorb
60.0
50.0
40.0
30.0
20.0
10.0
0.0
- 3. Chesapeake (Area 31, 32, and 33)
Absorption Rates Apr 2010
Price Range Active Listings Sold Properties Transactions Months to Absorb
($000's) 11/1/09-4/30/10 Per Month
150-200 368 244 40.7 9.0
201-250 310 251 41.8 7.4
251-300 276 163 27.2 10.2
301-350 302 127 21.2 14.3
351-400 290 85 14.2 20.5
401-450 155 68 11.3 13.7
451-500 88 32 5.3 16.5
501-550 43 11 1.8 23.5
551-600 41 5 0.8 49.2
601-700 32 3 0.5 64.0
701-800 12 3 0.5 24.0
801-900 10 0 0.0
901-1000 4 0 0.0
1001+ 12 0 0.0
Months to Absorb
70.0
60.0
50.0
40.0
30.0
20.0
10.0
0.0
- 4. Norfolk (Area 11, 12, and 13)
Absorption Rates Apr 2010
Price Range Active Listings Sold Properties Transactions Months to Absorb
($000's) 11/1/09-4/30/10 Per Month
150-200 495 243 40.5 12.2
201-250 256 116 19.3 13.2
251-300 183 61 10.2 18.0
301-350 96 36 6.0 16.0
351-400 96 25 4.2 23.0
401-450 56 15 2.5 22.4
451-500 41 10 1.7 24.6
501-550 36 4 0.7 54.0
551-600 32 7 1.2 27.4
601-700 52 11 1.8 28.4
701-800 25 2 0.3 75.0
801-900 16 1 0.2 96.0
901-1000 13 1 0.2 78.0
1001+ 23 2 0.3 69.0
Months to Absorb
120.0
100.0
80.0
60.0
40.0
20.0
0.0
- 5. Hampton (Areas 101-105)
Absorption Rates Apr 2010
Price Range Active Listings Sold Properties Transactions Months to Absorb
($000's) 11/1/09-4/30/10 Per Month
150-200 267 182 30.3 8.8
201-250 218 101 16.8 13.0
251-300 116 48 8.0 14.5
301-350 38 25 4.2 9.1
351-400 38 15 2.5 15.2
401-450 7 4 0.7 10.5
451-500 10 1 0.2 60.0
501-550 5 0 0.0
551-600 8 2 0.3 24.0
601-700 6 1 0.2 36.0
701-800 7 1 0.2 42.0
801-900 1 0 0.0
901-1000 1 0 0.0
1001+ 5 1 0.2 30.0
Months to Absorb
70.0
60.0
50.0
40.0
30.0
20.0
10.0
0.0
150-200 201-250 251-300 301-350 351-400 401-450 451-500 501-550 551-600 601-700
- 6. Newport News (Areas 106-110)
Absorption Rates Apr 2010
Price Range Active Listings Sold Properties Transactions Months to Absorb
($000's) 11/1/09-4/30/10 Per Month
150-200 343 231 38.5 8.9
201-250 284 160 26.7 10.7
251-300 135 65 10.8 12.5
301-350 56 18 3.0 18.7
351-400 41 7 1.2 35.1
401-450 22 4 0.7 33.0
451-500 8 0 0.0
501-550 7 0 0.0
551-600 1 1 0.2 6.0
601-700 4 0 0.0
701-800 1 0 0.0
801-900 1 0 0.0
901-1000 1 0 0.0
1001+ 8 1 0.2 48.0
Months to Absorb
40.0
35.0
30.0
25.0
20.0
15.0
10.0
5.0
0.0
150-200 201-250 251-300 301-350 351-400 401-450 451-500 501-550 551-600 601-700
- 7. Portsmouth ( Area 21, 22)
Absorption Rates Apr 2010
Price Range Active Listings Sold Properties Transactions Months to Absorb
($000's) 11/1/09-4/30/10 Per Month
150-200 253 130 21.7 11.7
201-250 150 74 12.3 12.2
251-300 80 21 3.5 22.9
301-350 23 6 1.0 23.0
351-400 9 2 0.3 27.0
401-450 10 0 0.0
451-500 3 2 0.3 9.0
501-550 5 0 0.0
551-600 5 0 0.0
601-700 4 1 0.2 24.0
701-800 1 0 0.0
801-900 1 0 0.0
901-1000 1 0 0.0
1001+ 1 0 0.0
Months to Absorb
30.0
25.0
20.0
15.0
10.0
5.0
0.0
- 8. Smithfield-Isle of Wight (Areas 64-66)
Absorption Rates Apr 2010
Price Range Active Listings Sold Properties Transactions Months to Absorb
($000's) 11/1/09-4/30/10 Per Month
150-200 41 19 3.2 12.9
201-250 80 27 4.5 17.8
251-300 63 19 3.2 19.9
301-350 57 18 3.0 19.0
351-400 42 16 2.7 15.8
401-450 25 11 1.8 13.6
451-500 22 5 0.8 26.4
501-550 8 3 0.5 16.0
551-600 12 5 0.8 14.4
601-700 11 1 0.2 66.0
701-800 5 0 0.0
801-900 4 0 0.0
901-1000 2 0 0.0
1001+ 5 1 0.2 30.0
Months to Absorb
70.0
60.0
50.0
40.0
30.0
20.0
10.0
0.0
- 9. Suffolk (Areas 61-63)
Absorption Rates Apr 2010
Price Range Active Listings Sold Properties Transactions Months to Absorb
($000's) 11/1/09-4/30/10 Per Month
150-200 161 80 13.3 12.1
201-250 149 105 17.5 8.5
251-300 195 98 16.3 11.9
301-350 110 62 10.3 10.6
351-400 80 23 3.8 20.9
401-450 46 14 2.3 19.7
451-500 30 11 1.8 16.4
501-550 16 8 1.3 12.0
551-600 13 3 0.5 26.0
601-700 26 4 0.7 39.0
701-800 9 2 0.3 27.0
801-900 14 0 0.0
901-1000 3 1 0.2 18.0
1001+ 18 0 0.0
Months to Absorb
45.0
40.0
35.0
30.0
25.0
20.0
15.0
10.0
5.0
0.0
- 10. York, Poquoson ( Area 111-113 )
Absorption Rates Apr 2010
Price Range Active Listings Sold Properties Transactions Months to Absorb
($000's) 11/1/09-4/30/10 Per Month
150-200 58 42 7.0 8.3
201-250 84 63 10.5 8.0
251-300 92 43 7.2 12.8
301-350 67 32 5.3 12.6
351-400 82 24 4.0 20.5
401-450 46 18 3.0 15.3
451-500 49 11 1.8 26.7
501-550 25 6 1.0 25.0
551-600 26 16 2.7 9.8
601-700 19 4 0.7 28.5
701-800 9 3 0.5 18.0
801-900 10 2 0.3 30.0
901-1000 2 1 0.2 12.0
1001+ 9 5 0.8 10.8
Months to Absorb
35.0
30.0
25.0
20.0
15.0
10.0
5.0
0.0
- 11. South Virginia Beach ( Areas 44-48)
Absorption Rates Apr 2010
Price Range Active Listings Sold Properties Transactions Months to Absorb
($000's) 11/1/09-4/30/10 Per Month
150-200 386 314 52.3 7.4
201-250 420 376 62.7 6.7
251-300 273 252 42.0 6.5
301-350 176 110 18.3 9.6
351-400 146 69 11.5 12.7
401-450 104 37 6.2 16.9
451-500 65 28 4.7 13.9
501-550 49 9 1.5 32.7
551-600 66 8 1.3 49.5
601-700 72 7 1.2 61.7
701-800 33 8 1.3 24.8
801-900 20 2 0.3 60.0
901-1000 9 0 0.0
1001-2000 27 4 0.7 40.5
2001+ 6 0 0.0
Months to Absorb
70.0
60.0
50.0
40.0
30.0
20.0
10.0
0.0
- 12. North Virginia Beach ( Areas 41-43)
Absorption Rates Apr 2010
Price Range Active Listings Sold Properties Transactions Months to Absorb
($000's) 11/1/09-4/30/10 Per Month
150-200 252 190 31.7 8.0
201-250 203 138 23.0 8.8
251-300 164 111 18.5 8.9
301-350 126 73 12.2 10.4
351-400 155 66 11.0 14.1
401-450 73 30 5.0 14.6
451-500 79 17 2.8 27.9
501-550 44 17 2.8 15.5
551-600 62 10 1.7 37.2
601-700 99 22 3.7 27.0
701-800 71 23 3.8 18.5
801-900 53 13 2.2 24.5
901-1000 32 6 1.0 32.0
1001-2000 110 19 3.2 34.7
2001+ 38 3 0.5 76.0
Months to Absorb
80.0
70.0
60.0
50.0
40.0
30.0
20.0
10.0
0.0