SlideShare ist ein Scribd-Unternehmen logo
1 von 8
Downloaden Sie, um offline zu lesen
Click here for authors’ contact information.
Priced (in USD) as of 7/20/17 market close, EST (unless otherwise stated).
For important disclosures and required non-U.S. analyst disclosures, see page 6.
The S&P 500 Tech sector finally reached a new all-time high,
17 years after the bubble-era peak. Even though the sector
could use a rest following a strong 11.7% run since mid-April,
we still believe it can generate attractive long-term returns.
Tech support
A lot has changed for the Tech sector since the bubble days.
The hopes and dreams that seemed dashed as the bubble
was bursting are now playing out. The internet has indeed
transformed our lives. Roughly 85% of the U.S. workforce
is constantly or often connected to the internet during a
typical workday. We imagine the numbers are similar in other
developed nations.
The software industry has largely transformed into the cloud
computing industry. Computer chips are passé—now chips for
the Internet of Things, artificial intelligence, and self-driving
cars are all the rage.
The sector is now led by real companies with real earnings
and cash flows compared to the myriad of firms with hollow
balance sheets and never-ending losses that used to capture
imaginations.
Tech sector earnings per share have increased 226% since the
previous bubble-era peak. The five S&P 500 companies with
the biggest cash hoards are tech firms. They hold more than
$570B total in cash.
Companies that weren’t even listed on public exchanges
during the bubble era are now among the largest and most
innovative tech firms, including Alphabet (Google), Facebook,
PayPal, and Salesforce.com.
That was then, this is now
Kelly Bogdanov – San Francisco
July 20, 2017
A closer look
The U.S. Tech sector’s new record high has brought back memories of the dot-com bubble. But unlike then,
today’s Tech sector is not propped up by fanciful talk. It’s led by companies that are truly transforming the
economy and our lives, and we believe Tech should be a source of attractive long-term returns.
R B C W E A L T H M A N A G E M E N T
Global InsightW e e k l y
3 	 The U.S. stock market’s unnoticed catalyst
3 	 Canadian housing market cooling off
3 	 Takeaways from the surprise drop in U.K. inflation
4	 Signs of steadiness in the Chinese economy
Market pulse
Source - RBC Wealth Management, Bloomberg; data through 7/20/17
17 years later, U.S. Tech closes at an all-time high
S&P 500 Information Technology Sector Index
992.71988.49
0
200
400
600
800
1000
1200
1998 2001 2004 2007 2010 2013 2016
As the index fought its way
back, Tech sector profits
rose 226% during the
peak-to-peak period
2 | Global Insight Weekly
July 20, 2017 | RBC Wealth Management
Leadership is also coming from companies that were public
back then but have since reinvented their products and
services, such as Adobe Systems, Analog Devices, Apple,
Microsoft, and NVIDIA, just to name a handful.
The U.S. is the home of eight of the 10 largest tech firms
worldwide by market capitalization. U.S.-based firms garnered
66% of the revenues in the past 12 months among the largest
100 tech companies globally.
Not over the top
While the industry’s transformation has been nothing short of
remarkable, ushering in a secular (long-term) growth phase
that is impacting many segments of the global economy, there
is another key difference between then and now that cannot
be overlooked from an investment standpoint: valuation.
The Tech sector was wildly overvalued at 83x trailing and
60x forward earnings during the bubble era. Today, while its
valuations are elevated, they are nowhere near those levels,
registering at 24.6x trailing and 19.4x forward estimates (see
upper chart). From our vantage point, the current price-to-
earnings (P/E) ratios are reasonable considering the economy
remains locked in an ultralow interest rate environment, which
can accommodate moderately elevated valuations, and given
we view the quality of earnings and balance sheets as high.
The ratio between the forward P/Es of the Tech sector and the
S&P 500 currently stands at 1.02, below the average level since
2004. Meanwhile, Tech is forecast to moderately outgrow the
S&P 500 in 2017 and 2018, according to the Thomson Reuters
I/B/E/S consensus data.
Despite its strong year-to-date rally, Tech’s free cash flow
yield—a measure of expected return—exceeds the S&P 500
and seven of 10 other sectors.
Furthermore, Tech is now on the dividend radar screen. The
sector’s dividend yield has risen to 1.29% from only 0.09% at
the bubble’s peak.
We think the sector’s dividend yield expansion has much
further to go, as some of the more mature companies with
sizeable cash holdings have capacity to increase dividends,
especially if overseas cash is repatriated as a part of a tax
reform package. Among the five tech firms with the biggest
cash holdings, roughly 85% of the cash is held overseas.
Tech solution
Despite the potential near-term headwinds following Tech’s
strong run, innovation trends combined with reasonable
valuations and attractive secular growth prospects are
compelling reasons to own the U.S. Tech sector in equity
portfolios. We believe the innovation wave has the sector well
positioned to help lead the S&P 500 in the next year or longer.
Source - RBC Wealth Management, Bloomberg; data through 7/19/17
Tech valuations have drifted up but are nowhere near
peak levels
Tech sector price-to-earnings (P/E) ratios
83x
24.6x
60x
19.4x
0
15
30
45
60
75
90
1998 2001 2004 2007 2010 2013 2016
Trailing P/E ratio
Forward P/E ratio
Source - RBC Wealth Management, Bloomberg; monthly data through
7/18/17
Tech makes up 23% of the S&P 500, well below bubble levels
Tech sector as a percentage of S&P 500 market capitalization
0%
5%
10%
15%
20%
25%
30%
35%
1990 1995 2000 2005 2010 2015
3 | Global Insight Weekly
July 20, 2017 | RBC Wealth Management
factor underlying a sustained oil price recovery revolves
around long cycle-time projects beginning to fade, which
RBC Capital Markets anticipates in 2019.
•	 In light of the lower crude oil forecasts, RBC Capital
Markets’ energy team lowered its cash flow per share
estimates for its Canadian integrated and senior producer
coverage universe by 17% and 22% on average in 2017 and
2018, respectively. RBC Capital Markets’ updated forecasts
align with our more cautious outlook for crude oil. In
the current environment, we continue to favour well-
capitalized producers with visible production growth and
above-average execution capability.
Eu ro pe
Frédérique Carrier & Thomas McGarrity – London
•	 As expected, the European Central Bank (ECB) kept its
policy unchanged at its July meeting. The euro continued
to strengthen versus the U.S. dollar (see chart on next
page), crossing above $1.16 for the first time since May
2016, as ECB President Mario Draghi did not suggest
the euro’s recent strength was becoming uncomfortable
for policymakers. We expect the ECB to discuss some
sort of changes to its monetary policy at its next meeting
in September. RBC Capital Markets still sees the ECB
extending its bond-buying program into the middle of next
year but with purchases tapered to reflect the improvement
in the euro area economy and the scarcity of government
bonds available.
•	 There was a surprise drop in U.K. inflation in June. The
Consumer Price Index eased to 2.6% y/y, from 2.9% y/y in
May, and versus consensus expectations for it to remain
flat. Key drivers of the decline were lower prices for fuel and
the “recreation and culture” component of the inflation
United States
Kelly Bogdanov – San Francisco
•	 The equity market continued its winning ways with the
S&P 500, Dow, and NASDAQ climbing to new all-time
highs during the week. Solid corporate earnings reports
helped boost the market.
•	 One catalyst that has largely gone unnoticed is improved
M&A activity during the first half of this year, up 11% since
last period and 30% y/y (see chart). We believe domestic
M&A will remain healthy so long as U.S. GDP averages
2% or more and the global economy continues to firm.
In our view, the retail and packaged goods industries
are candidates for consolidation given the pricing and
volume challenges caused by technological innovations
and customers’ changing purchasing patterns—i.e.,
the “Amazon effect.” Further out, RBC Capital Markets
anticipates deals will transpire in the banking industry,
potentially in late 2018 and into early 2019. Banks will
likely seek to improve profitability and acquire deposit
franchises as the Fed unwinds its balance sheet.
Canada
Alicia Buckiewicz & Farazeh Mahboob – Toronto
•	 Data released this month showed that the Canadian
housing market has cooled since April. The Canadian Real
Estate Association reported that home sales fell 6.7% in
June, which is the sharpest monthly decline since 2010.
Sales declined 11.4% y/y nationwide, with the decline
most pronounced in Toronto. Nationally, price action was
also negative, with prices down approximately 10% from
the April peak. Excluding Toronto andVancouver, the
picture is brighter, with prices still up 5% y/y and monthly
price gains recorded in Alberta, Manitoba, New Brunswick,
and Prince Edward Island. The recent run of softer
housing data comes against a backdrop of tighter policy
on a number of fronts, including the newly introduced
measures in Ontario designed to ease affordability
pressures in the Greater Toronto Area.
•	 RBC Capital Markets’ energy team has cut itsWTI crude
forecasts to annual average prices of $48.47/barrel (bbl)
in 2017 (from $54.50/bbl) and $50/bbl in 2018 (from $60/
bbl). U.S. oil supply growth forecasts, while down from
previous expectations, remain robust while RBC Capital
Markets expected shallower global inventory draws
despite OPEC’s agreement to cap production. RBC Capital
Markets believes it is likely that OPEC will extend its
existing agreement beyond March 31, 2018 with its next
meeting slated for November 30. The most important
Source - RBC Wealth Management, Bloomberg; data as of 7/18/17
M&A has increased despite Washington uncertainties
U.S. merger and acquisition volume
$956
billion
$1.126
trillion
$1.247
trillion
2016 first half 2016 second half 2017 first half
4 | Global Insight Weekly
July 20, 2017 | RBC Wealth Management
basket. RBC Capital Markets believes June was a blip, and
inflation in the U.K. will continue to head towards 3%
y/y. We believe the dip in inflation has diminished the
chances of increasing hawkish sentiment from the Bank
of England’s Monetary Policy Committee at its August
meeting, with the key focus shifting back to the downside
risks to the U.K. economy, rather than trying to counter a
bout of above-target inflation.
•	 Swiss pharmaceutical group Novartis beat consensus
earnings estimates by 3% for Q2. The company benefitted
from higher-than-expected sales from recently launched
drugs, which helped offset the impact of the ongoing
decline of Gleevec, formerly Novartis’ best-selling drug,
which is now exposed to generic competition.
•	 SAP, the largest European software vendor, nudged up its
revenue guidance for 2017 and announced a €500M share
buyback. Operating profit was slightly below consensus
expectations, however, as ongoing investments in its cloud
business and increased hiring weighed on its operating
margin.
•	 Unilever’s operating profit for the first half of 2017 beat
consensus estimates by 5%, as its operating margin
increased 180 basis points to 17.8%, 100 basis points
ahead of expectations. After rejecting Kraft Heinz’s
takeover bid earlier in 2017, Unilever set a target to achieve
a 20% operating margin by 2020.
Asia Pacific
Jay Roberts – Hong Kong
•	 China’s economy grew by 6.9% y/y in Q2, faster than
forecast and the same pace as in Q1. A broad range of
economic indicators corroborate the steadiness at
present in the Chinese economy. Primarily, these include
both official and unofficial leading indicators, which range
from moderately positive in the manufacturing sector to
robust in the larger services sector.
•	 At present, the Chinese economy is performing above
expectations, in our view. A number of data points for the
month of June, for example, show decent strength in the
economy. These include: industrial production, +8% y/y;
retail sales, +11% y/y; commercial vehicle sales, +19%
y/y; and good data in the housing market.
•	 E-commerce in China continues to grow at a far more
rapid rate than the broad economy. The National Bureau
of Statistics stated that online retail sales in the first half
of the year rose by 33% y/y. This growth is corroborated
by strong revenue growth in China’s largest internet
companies, as well as by the number of packages
delivered, heavily impacted by online sales. Deliveries rose
by 31% y/y in June.
•	 At the same time, the authorities in China continue to
tighten leverage in the financial sector. It appears that
as a result of recent, tighter policies, causing a funding
squeeze for banks, some banks had pushed up yields on
popular wealth management products in order to attract
funds. The regulator has responded by ordering certain
banks to lower the rates on these products.
•	 The stabilizing renminbi, along with more stringent
controls on capital flows, has caused capital outflows from
China to decline significantly from the very high levels
seen at the start of 2016. China’s FX reserves have been
moving up again over the past few months. In parallel,
the country’s holdings of U.S.Treasuries have also
been rising, up for a fourth consecutive month in May,
according to the U.S. Treasury Department.
•	 China now holds $1.1T of U.S. government debt, slightly
lower than Japan’s holdings of $1.11T. A total of $6.1T of
U.S. debt is held by foreigners, of which $4T is held by
governments. This means that China and Japan hold
approximately one-third of all foreign holdings of U.S.
Treasuries and over a half of foreign government holdings
of Treasuries.
•	 Ping An Insurance (2318 HK), the second-largest
insurance company in China, is moving into wealth
and asset management outside Greater China for the
first time. Ping An’s Lufax division will begin operating
in Singapore with a focus on global clients rather than
Singapore residents. Lufax manages $65B of client assets
in China. The stock has been particularly strong this
year, rising by over 50% in Hong Kong. Other Chinese
companies, such as Alibaba (BABA), have also been
expanding into other parts of Asia.
Source - RBC Wealth Management, Bloomberg; data through 7/20/17
A strengthening euro is the key driver of diverging investor
returns in Europe
STOXX Europe 600 returns, year to date
17%
6%
-3%
0%
3%
6%
9%
12%
15%
18%
Jan Mar May Jul
STOXX 600 U.S. dollar returns
STOXX 600 euro returns
5 | Global Insight Weekly
July 20, 2017 | RBC Wealth Management
Data as of July 20, 2017
Source - Bloomberg. Note: Equity returns do not include dividends, except for the German DAX and Brazilian Ibovespa. Bond yields in local currencies. Copper
Index data and U.S. fixed income returns as of Wednesday’s close. Dollar Index measures USD vs. six major currencies. Currency rates reflect market convention
(CAD/USD is the exception). Currency returns quoted in terms of the first currency in each pairing. Data as of 8:34 pm GMT 7/20/17.
Examples of how to interpret currency data: CAD/USD 0.78 means 1 Canadian dollar will buy 0.78 U.S. dollar. CAD/USD 5.6% return means the Canadian dollar
rose 5.6% vs. the U.S. dollar year to date. USD/JPY 113.25 means 1 U.S. dollar will buy 113.25 yen. USD/JPY -3.2% return means the U.S. dollar fell 3.2% vs. the
yen year to date.
Commodities (USD) Price MTD YTD 1 yr 2 yr
Gold (spot $/oz) 1,243.91 0.2% 8.0% -5.5% 13.4%
Silver (spot $/oz) 16.33 -1.8% 2.6% -15.9% 11.0%
Copper ($/metric ton) 5,929.50 0.0% 7.4% 19.7% 8.6%
Oil (WTI spot/bbl) 46.79 1.6% -12.9% 4.1% -6.7%
Oil (Brent spot/bbl) 49.31 2.9% -13.2% 4.5% -13.0%
Natural Gas ($/mmBtu) 3.03 -0.1% -18.6% 14.0% 7.4%
Govt bonds (bps chg) Yield MTD YTD 1 yr 2 yr
U.S. 10-Yr Tsy 2.259% -4.5 -18.5 67.9 -11.3
Canada 10-Yr 1.883% 12.1 16.2 76.0 30.5
U.K. 10-Yr 1.205% -5.2 -3.4 37.0 -85.6
Germany 10-Yr 0.530% 6.4 32.2 54.1 -23.2
Fixed Income (returns) Yield MTD YTD 1 yr 2 yr
U.S. Aggregate 2.51% 0.4% 2.7% 0.0% 6.2%
U.S. Invest Grade Corp 3.12% 0.7% 4.5% 2.2% 11.3%
U.S. High Yield Corp 5.48% 0.8% 5.7% 10.3% 15.6%
Currencies Rate MTD YTD 1 yr 2 yr
U.S. Dollar Index 94.2790 -1.4% -7.8% -3.0% -3.8%
CAD/USD 0.7945 3.0% 6.8% 3.7% 3.2%
USD/CAD 1.2586 -2.9% -6.4% -3.6% -3.1%
EUR/USD 1.1632 1.8% 10.6% 5.6% 7.5%
GBP/USD 1.2973 -0.4% 5.1% -1.8% -16.6%
AUD/USD 0.7959 3.5% 10.4% 6.4% 8.0%
USD/JPY 111.9000 -0.4% -4.3% 4.7% -10.0%
EUR/JPY 130.1600 1.4% 5.8% 10.6% -3.2%
EUR/GBP 0.8966 2.2% 5.0% 7.5% 28.9%
EUR/CHF 1.1066 1.1% 3.2% 1.8% 6.0%
USD/SGD 1.3664 -0.7% -5.6% 0.7% -0.3%
USD/CNY 6.7597 -0.3% -2.7% 1.2% 8.9%
USD/MXN 17.4969 -3.4% -15.6% -6.3% 9.3%
USD/BRL 3.1241 -5.6% -4.0% -4.2% -2.2%
MARKET SCORECARD
Equities (local currency) Level MTD YTD 1 yr 2 yr
S&P 500 2,473.45 2.1% 10.5% 13.8% 16.2%
Dow Industrials (DJIA) 21,611.78 1.2% 9.4% 16.2% 19.4%
NASDAQ 6,390.00 4.1% 18.7% 25.5% 22.4%
Russell 2000 1,442.35 1.9% 6.3% 19.2% 14.5%
S&P/TSX Comp 15,264.64 0.5% -0.2% 5.0% 5.8%
FTSE All-Share 4,095.07 2.3% 5.7% 12.4% 10.8%
STOXX Europe 600 384.07 1.2% 6.3% 12.7% -5.6%
EURO STOXX 50 3,499.49 1.7% 6.4% 17.9% -5.1%
Hang Seng 26,740.21 3.8% 21.5% 22.2% 5.3%
Shanghai Comp 3,244.87 1.6% 4.6% 7.2% -18.7%
Nikkei 225 20,144.59 0.6% 5.4% 20.8% -2.5%
India Sensex 31,904.40 3.2% 19.8% 14.3% 12.3%
Singapore Straits Times 3,293.13 2.1% 14.3% 11.8% -2.4%
Brazil Ibovespa 64,938.02 3.2% 7.8% 14.8% 25.8%
Mexican Bolsa IPC 51,151.59 2.6% 12.1% 7.7% 12.3%
UPCOMING EVENTS
The dates reflect North American time zones. All data reflect Bloomberg consensus forecasts where available.
Fri, Jul 21 Mon, Jul 24 Wed, Jul 26 Thu, Jul 27, cont.
ECB Survey of Prof. Forecasters China Conf. Board Leading Eco. Index China Swift Global Payments Germany Consumer Confidence
U.S. Markit Manuf. PMI Eurozone Markit Manuf. PMI China Industrial Profits Germany Retail Sales
U.S. Markit Serv./Comp. PMI Eurozone Markit Serv./Comp. PMI U.K. Q2 GDP (0.3% q/q, 1.7% y/y) U.S. Durable and Capital Goods
U.S. Existing-Home Sales (5.5M, -1.4% m/m) Germany Markit Manuf. PMI U.K. Index of Services U.S. Chicago Fed Nat'l Activity
Canada CPI (1.1% y/y) Germany Markit Serv./Comp. PMI Fed Meeting Fri, Jul 28
Canada Retail Sales (0.3% m/m) Tue, Jul 25 U.S. New Home Sales (616K) U.S. Q2 GDP (2.6% q/q, annl'zd)
Sun, Jul 23 Germany IFO Surveys Thu, Jul 27 U.S. Core PCE
Japan Nikkei Manuf. PMI (52.4) U.S. Conf. Board Consumer Confidence Japan CPI Thu, Aug 3
Japan Retail Sales BoE Meeting
6 | Global Insight Weekly
July 20, 2017 | RBC Wealth Management
Authors
Analyst Certification
All of the views expressed in this report accurately reflect the
personal views of the responsible analyst(s) about any and all
of the subject securities or issuers. No part of the compensation
of the responsible analyst(s) named herein is, or will be, directly
or indirectly, related to the specific recommendations or views
expressed by the responsible analyst(s) in this report.
Important Disclosures
In the U.S., RBC Wealth Management operates as a division of RBC
Capital Markets, LLC. In Canada, RBC Wealth Management includes,
without limitation, RBC Dominion Securities Inc., which is a foreign
affiliate of RBC Capital Markets, LLC. This report has been prepared
by RBC Capital Markets, LLC. which is an indirect wholly-owned
subsidiary of the Royal Bank of Canada and, as such, is a related
issuer of Royal Bank of Canada.
Non-U.S. Analyst Disclosure: Alicia Buckiewicz, Farazeh Mahboob, and
Jay Roberts, employees of RBC Wealth Management USA’s foreign
affiliate RBC Dominion Securities Inc.; and Frédérique Carrier and
Thomas McGarrity, employees of RBC Wealth Management USA’s
foreign affiliate Royal Bank of Canada Investment Management
(U.K.) Limited; contributed to the preparation of this publication.
These individuals are not registered with or qualified as research
analysts with the U.S. Financial Industry Regulatory Authority
(“FINRA”) and, since they are not associated persons of RBC Wealth
Management, they may not be subject to FINRA Rule 2241 governing
communications with subject companies, the making of public
appearances, and the trading of securities in accounts held by
research analysts.
In the event that this is a compendium report (covers six or more
companies), RBC Wealth Management may choose to provide
important disclosure information by reference. To access current
Kelly Bogdanov – San Francisco, United States
kelly.bogdanov@rbc.com; RBCCapital Markets, LLC
Alicia Buckiewicz, CFA – Toronto, Canada
alicia.buckiewicz@rbc.com; RBC Dominion Securities Inc.
Farazeh Mahboob – Toronto, Canada
farazeh.mahboob@rbc.com; RBC Dominion Securities Inc.
Frédérique Carrier – London, United Kingdom
frederique.carrier@rbc.com; Royal Bank of Canada Investment Management (U.K.) Ltd.
Thomas McGarrity, CFA – London, United Kingdom
thomas.mcgarrity@rbc.com; Royal Bank of Canada Investment Management (U.K.) Ltd.
Jay Roberts – Hong Kong, China
jay.roberts@rbc.com; RBC Dominion Securities Inc.
D isclosures and Disclaimer
disclosures, clients should refer to http://www.rbccm.com/
GLDisclosure/PublicWeb/DisclosureLookup.aspx?EntityID=2 to view
disclosures regarding RBC Wealth Management and its affiliated
firms. Such information is also available upon request to RBC Wealth
Management Publishing, 60 South Sixth St, Minneapolis, MN 55402.
References to a Recommended List in the recommendation history
chart may include one or more recommended lists or model
portfolios maintained by RBC Wealth Management or one of its
affiliates. RBC Wealth Management recommended lists include the
Guided Portfolio: Prime Income (RL 6), the Guided Portfolio: Dividend
Growth (RL 8), the Guided Portfolio: ADR (RL 10), and the Guided
Portfolio: All Cap Growth (RL 12), and former lists called the Guided
Portfolio: Large Cap (RL 7), the Guided Portfolio: Midcap 111 (RL 9),
and the Guided Portfolio: Global Equity (U.S.) (RL 11). RBC Capital
Markets recommended lists include the Strategy Focus List and the
Fundamental Equity Weightings (FEW) portfolios. The abbreviation
‘RL On’ means the date a security was placed on a Recommended
List. The abbreviation ‘RL Off’ means the date a security was removed
from a Recommended List.
Distribution of Ratings
For the purpose of ratings distributions, regulatory rules require
member firms to assign ratings to one of three rating categories
- Buy, Hold/Neutral, or Sell - regardless of a firm’s own rating
categories. Although RBC Capital Markets, LLC ratings of Top Pick
(TP)/Outperform (O), Sector Perform (SP) and Underperform (U) most
closely correspond to Buy, Hold/Neutral and Sell, respectively, the
meanings are not the same because our ratings are determined on a
relative basis (as described below).
Explanation of RBC Capital Markets, LLC Equity Rating System
An analyst’s “sector” is the universe of companies for which the
analyst provides research coverage. Accordingly, the rating assigned
to a particular stock represents solely the analyst’s view of how that
stock will perform over the next 12 months relative to the analyst’s
sector average. Although RBC Capital Markets, LLC ratings of Top Pick
(TP)/Outperform (O), Sector Perform (SP), and Underperform (U) most
closely correspond to Buy, Hold/Neutral and Sell, respectively, the
meanings are not the same because our ratings are determined on a
relative basis (as described below).
Ratings:
Top Pick (TP): Represents analyst’s best idea in the sector; expected
to provide significant absolute total return over 12 months with a
favorable risk-reward ratio. Outperform (O): Expected to materially
outperform sector average over 12 months. Sector Perform (SP):
Returns expected to be in line with sector average over 12 months.
Underperform (U): Returns expected to be materially below sector
average over 12 months.
As of June 30, 2017
Rating Count Percent Count Percent
Buy [Top Pick & Outperform] 826 52.01 293 35.47
Hold [Sector Perform] 657 41.37 144 21.92
Sell [Underperform] 105 6.61 7 6.67
Investment Banking Services
Provided During Past 12 Months
Distribution of Ratings - RBC Capital Markets, LLC Equity Research
7 | Global Insight Weekly
July 20, 2017 | RBC Wealth Management
Risk Rating:
As of March 31, 2013, RBC Capital Markets, LLC suspends its Average
and Above Average risk ratings. The Speculative risk rating reflects a
security’s lower level of financial or operating predictability, illiquid
share trading volumes, high balance sheet leverage, or limited
operating history that result in a higher expectation of financial and/
or stock price volatility.
Valuation and Risks to Rating and Price Target
When RBC Wealth Management assigns a value to a company in a
research report, FINRA Rules and NYSE Rules (as incorporated into
the FINRA Rulebook) require that the basis for the valuation and
the impediments to obtaining that valuation be described. Where
applicable, this information is included in the text of our research
in the sections entitled “Valuation” and “Risks to Rating and Price
Target”, respectively.
The analyst(s) responsible for preparing this research report received
compensation that is based upon various factors, including total
revenues of RBC Capital Markets, LLC, and its affiliates, a portion of
which are or have been generated by investment banking activities of
the member companies of RBC Capital Markets, LLC and its affiliates.
Other Disclosures
Prepared with the assistance of our national research sources.
RBC Wealth Management prepared this report and takes sole
responsibility for its content and distribution. The content may have
been based, at least in part, on material provided by our third-party
correspondent research services. Our third-party correspondent
has given RBC Wealth Management general permission to use
its research reports as source materials, but has not reviewed or
approved this report, nor has it been informed of its publication. Our
third-party correspondent may from time to time have long or short
positions in, effect transactions in, and make markets in securities
referred to herein. Our third-party correspondent may from time to
time perform investment banking or other services for, or solicit
investment banking or other business from, any company mentioned
in this report.
RBC Wealth Management endeavors to make all reasonable efforts
to provide research simultaneously to all eligible clients, having
regard to local time zones in overseas jurisdictions. In certain
investment advisory accounts, RBC Wealth Management will act as
overlay manager for our clients and will initiate transactions in the
securities referenced herein for those accounts upon receipt of this
report. These transactions may occur before or after your receipt of
this report and may have a short-term impact on the market price of
the securities in which transactions occur. RBC Wealth Management
research is posted to our proprietary Web sites to ensure eligible
clients receive coverage initiations and changes in rating, targets,
and opinions in a timely manner. Additional distribution may be done
by sales personnel via e-mail, fax, or regular mail. Clients may also
receive our research via third-party vendors. Please contact your RBC
Wealth Management Financial Advisor for more information regarding
RBC Wealth Management research.
Conflicts Disclosure: RBC Wealth Management is registered with the
Securities and Exchange Commission as a broker/dealer and an
investment adviser, offering both brokerage and investment advisory
services. RBC Wealth Management’s Policy for Managing Conflicts of
Interest in Relation to Investment Research is available from us on
our Web site at http://www.rbccm.com/GLDisclosure/PublicWeb/
DisclosureLookup.aspx?EntityID=2. Conflicts of interests related to
our investment advisory business can be found in Part II of the Firm’s
Form ADV or the Investment Advisor Group Disclosure Document.
Copies of any of these documents are available upon request
through your Financial Advisor. We reserve the right to amend or
supplement this policy, Part II of the ADV, or Disclosure Document at
any time.
The authors are employed by one of the following entities: RBC
Wealth Management USA, a division of RBC Capital Markets, LLC, a
securities broker-dealer with principal offices located in Minnesota
and New York, USA; by RBC Dominion Securities Inc., a securities
broker-dealer with principal offices located in Toronto, Canada;
by RBC Investment Services (Asia) Limited, a subsidiary of RBC
Dominion Securities Inc., a securities broker-dealer with principal
offices located in Hong Kong, China; and by Royal Bank of Canada
Investment Management (U.K.) Limited, an investment management
company with principal offices located in London, United Kingdom.
Research Resources
This document is produced by the Global Portfolio Advisory
Committee within RBC Wealth Management’s Portfolio Advisory
Group. The RBC WM Portfolio Advisory Group provides support
related to asset allocation and portfolio construction for the firm’s
Investment Advisors / Financial Advisors who are engaged in
assembling portfolios incorporating individual marketable securities.
The Committee leverages the broad market outlook as developed by
the RBC Investment Strategy Committee, providing additional tactical
and thematic support utilizing research from the RBC Investment
Strategy Committee, RBC Capital Markets, and third-party resources.
The Global Industry Classification Standard (“GICS”) was developed by and is
the exclusive property and a service mark of MSCI Inc. (“MSCI”) and Standard
& Poor’s Financial Services LLC (“S&P”) and is licensed for use by RBC. Neither
MSCI, S&P, nor any other party involved in making or compiling the GICS or any
GICS classifications makes any express or implied warranties or representations
with respect to such standard or classification (or the results to be obtained by
the use thereof), and all such parties hereby expressly disclaim all warranties of
originality, accuracy, completeness, merchantability and fitness for a particular
purpose with respect to any of such standard or classification. Without limiting
any of the foregoing, in no event shall MSCI, S&P, any of their affiliates or any
third party involved in making or compiling the GICS or any GICS classifications
have any liability for any direct, indirect, special, punitive, consequential or any
other damages (including lost profits) even if notified of the possibility of such
damages.
Disclaimer
The information contained in this report has been compiled by RBC Wealth
Management, a division of RBC Capital Markets, LLC, from sources believed to
be reliable, but no representation or warranty, express or implied, is made by
Royal Bank of Canada, RBC Wealth Management, its affiliates or any other person
as to its accuracy, completeness or correctness. All opinions and estimates
contained in this report constitute RBC Wealth Management’s judgment as of
the date of this report, are subject to change without notice and are provided
in good faith but without legal responsibility. Past performance is not a guide
to future performance, future returns are not guaranteed, and a loss of original
capital may occur. Every province in Canada, state in the U.S., and most countries
throughout the world have their own laws regulating the types of securities and
other investment products which may be offered to their residents, as well as
the process for doing so. As a result, the securities discussed in this report may
not be eligible for sale in some jurisdictions. This report is not, and under no
circumstances should be construed as, a solicitation to act as securities broker or
dealer in any jurisdiction by any person or company that is not legally permitted to
8 | Global Insight Weekly
July 20, 2017 | RBC Wealth Management
carry on the business of a securities broker or dealer in that jurisdiction. Nothing
in this report constitutes legal, accounting or tax advice or individually tailored
investment advice. This material is prepared for general circulation to clients,
including clients who are affiliates of Royal Bank of Canada, and does not have
regard to the particular circumstances or needs of any specific person who may
read it. The investments or services contained in this report may not be suitable
for you and it is recommended that you consult an independent investment
advisor if you are in doubt about the suitability of such investments or services.
To the full extent permitted by law neither Royal Bank of Canada nor any of its
affiliates, nor any other person, accepts any liability whatsoever for any direct or
consequential loss arising from any use of this report or the information contained
herein. No matter contained in this document may be reproduced or copied by any
means without the prior consent of Royal Bank of Canada. Additional information
is available upon request.
To U.S. Residents: This publication has been approved by RBC Capital Markets,
LLC, Member NYSE/FINRA/SIPC, which is a U.S. registered broker-dealer and
which accepts responsibility for this report and its dissemination in the United
States. RBC Capital Markets, LLC, is an indirect wholly-owned subsidiary of the
Royal Bank of Canada and, as such, is a related issuer of Royal Bank of Canada.
Any U.S. recipient of this report that is not a registered broker-dealer or a bank
acting in a broker or dealer capacity and that wishes further information regarding,
or to effect any transaction in, any of the securities discussed in this report,
should contact and place orders with RBC Capital Markets, LLC. International
investing involves risks not typically associated with U.S. investing, including
currency fluctuation, foreign taxation, political instability and different accounting
standards.
To Canadian Residents: This publication has been approved by RBC Dominion
Securities Inc. RBC Dominion Securities Inc.* and Royal Bank of Canada are
separate corporate entities which are affiliated. *Member-Canadian Investor
Protection Fund. ®Registered trademark of Royal Bank of Canada. Used under
license. RBC Wealth Management is a registered trademark of Royal Bank of
Canada. Used under license.
RBC Wealth Management (British Isles): This publication is distributed by Royal
Bank of Canada Investment Management (U.K.) Limited and RBC Investment
Solutions (CI) Limited. Royal Bank of Canada Investment Management (U.K.)
Limited is authorised and regulated by the Financial Conduct Authority (Reference
number: 146504). Registered office: Riverbank House, 2 Swan Lane , London,
EC4R 3BF, UK. RBC Investment Solutions (CI) Limited is regulated by the Jersey
Financial Services Commission in the conduct of investment business in Jersey.
Registered office: Gaspé House, 66-72 Esplanade, St Helier, Jersey JE2 3QT,
Channel Islands, registered company number 119162.
To Hong Kong Residents: This publication is distributed in Hong Kong by Royal
Bank of Canada, Hong Kong Branch which is regulated by the Hong Kong
Monetary Authority and the Securities and Futures Commission (‘SFC’), RBC
Investment Services (Asia) Limited and RBC Investment Management (Asia)
Limited, both entities are regulated by the SFC. Financial Services provided to
Australia: Financial services may be provided in Australia in accordance with
applicable law. Financial services provided by the Royal Bank of Canada, Hong
Kong Branch are provided pursuant to the Royal Bank of Canada’s Australian
Financial Services Licence (‘AFSL’) (No. 246521).
To Singapore Residents: This publication is distributed in Singapore by the
Royal Bank of Canada, Singapore Branch, a registered entity granted offshore
bank licence by the Monetary Authority of Singapore. This material has been
prepared for general circulation and does not take into account the objectives,
financial situation, or needs of any recipient. You are advised to seek indepen-
dent advice from a financial adviser before purchasing any product. If you do
not obtain independent advice, you should consider whether the product is
suitable for you. Past performance is not indicative of future performance. If you
have any questions related to this publication, please contact the Royal Bank
of Canada, Singapore Branch. Royal Bank of Canada, Singapore Branch accepts
responsibility for this report and its dissemination in Singapore.
© RBC Capital Markets, LLC 2017 - Member NYSE/FINRA/SIPC
© RBC Dominion Securities Inc. 2017 - Member Canadian Investor Protection Fund
© RBC Europe Limited 2017
© Royal Bank of Canada 2017
All rights reserved
RBC1253

Weitere ähnliche Inhalte

Was ist angesagt?

2014 business briefing_humancapital_final
2014 business briefing_humancapital_final2014 business briefing_humancapital_final
2014 business briefing_humancapital_finalGuy Masse
 
Canada M&A Insights - March 2017
Canada M&A Insights - March 2017Canada M&A Insights - March 2017
Canada M&A Insights - March 2017Duff & Phelps
 
C&W MARKETBEAT- CAPITAL MARKETS Q4 2016 – #CRE #REALESTATE #CCIM #SIOR @YOURT...
C&W MARKETBEAT- CAPITAL MARKETS Q4 2016 – #CRE #REALESTATE #CCIM #SIOR @YOURT...C&W MARKETBEAT- CAPITAL MARKETS Q4 2016 – #CRE #REALESTATE #CCIM #SIOR @YOURT...
C&W MARKETBEAT- CAPITAL MARKETS Q4 2016 – #CRE #REALESTATE #CCIM #SIOR @YOURT...Guy Masse
 
C&W-Marketbeat-U.S. Industrial-Q3-2018 #CRE #REALESTATE
C&W-Marketbeat-U.S. Industrial-Q3-2018 #CRE #REALESTATEC&W-Marketbeat-U.S. Industrial-Q3-2018 #CRE #REALESTATE
C&W-Marketbeat-U.S. Industrial-Q3-2018 #CRE #REALESTATEGuy Masse
 
Eye on the markets
Eye on the marketsEye on the markets
Eye on the marketsAndrew Lee
 
C&W Q3 2021 Canadian Cap Rate Report
 C&W Q3 2021 Canadian  Cap Rate Report  C&W Q3 2021 Canadian  Cap Rate Report
C&W Q3 2021 Canadian Cap Rate Report Guy Masse
 
Marcu & Millichap 2016 U.S. MULTIFAMILY INVESTMENT FORECAST
Marcu & Millichap 2016 U.S. MULTIFAMILY INVESTMENT FORECASTMarcu & Millichap 2016 U.S. MULTIFAMILY INVESTMENT FORECAST
Marcu & Millichap 2016 U.S. MULTIFAMILY INVESTMENT FORECASTWayne Michael Mumford
 
Turbulent Times: Our economic prospects in an uncertain world
Turbulent Times: Our economic prospects in an uncertain worldTurbulent Times: Our economic prospects in an uncertain world
Turbulent Times: Our economic prospects in an uncertain worldCheryl Maitland Muir
 
Capital Markets Insights: Credit Availability for the Middle Market Remains R...
Capital Markets Insights: Credit Availability for the Middle Market Remains R...Capital Markets Insights: Credit Availability for the Middle Market Remains R...
Capital Markets Insights: Credit Availability for the Middle Market Remains R...Duff & Phelps
 
Economy & Internet Trends - Morgan Stanley Presentation
Economy & Internet Trends - Morgan Stanley PresentationEconomy & Internet Trends - Morgan Stanley Presentation
Economy & Internet Trends - Morgan Stanley PresentationSubrahmanyam KVJ
 
Capital Markets Insights - Summer 2017
Capital Markets Insights - Summer 2017Capital Markets Insights - Summer 2017
Capital Markets Insights - Summer 2017Duff & Phelps
 
Canadian M&A Insights - Summer 2017
Canadian M&A Insights - Summer 2017Canadian M&A Insights - Summer 2017
Canadian M&A Insights - Summer 2017Duff & Phelps
 
2017 Global Economic Outlook by Dun & Bradstreet
2017 Global Economic Outlook by Dun & Bradstreet2017 Global Economic Outlook by Dun & Bradstreet
2017 Global Economic Outlook by Dun & BradstreetDun & Bradstreet
 
Economy and equity markets: are they disconnected?
Economy and equity markets: are they disconnected?Economy and equity markets: are they disconnected?
Economy and equity markets: are they disconnected?Markets Beyond
 
High Yield Bonds - The Rise of the Fallen
High Yield Bonds - The Rise of the FallenHigh Yield Bonds - The Rise of the Fallen
High Yield Bonds - The Rise of the FallenAranca
 
Commercial Real Estate Market Overview - 2016Q1
Commercial Real Estate Market Overview - 2016Q1Commercial Real Estate Market Overview - 2016Q1
Commercial Real Estate Market Overview - 2016Q1Felicia Gan
 
Commercial realestate market overview 2016
Commercial realestate market overview 2016Commercial realestate market overview 2016
Commercial realestate market overview 2016cutmytaxes
 
Before the Open May 16 2017
Before the Open May 16 2017Before the Open May 16 2017
Before the Open May 16 2017John Pendrith
 
EY Analyst themes of quarterly oil & gas earnings: 3Q18
EY Analyst themes of quarterly oil & gas earnings: 3Q18EY Analyst themes of quarterly oil & gas earnings: 3Q18
EY Analyst themes of quarterly oil & gas earnings: 3Q18EY
 
PwC Global Economy watch (mars 2014)
PwC Global Economy watch (mars 2014)PwC Global Economy watch (mars 2014)
PwC Global Economy watch (mars 2014)PwC France
 

Was ist angesagt? (20)

2014 business briefing_humancapital_final
2014 business briefing_humancapital_final2014 business briefing_humancapital_final
2014 business briefing_humancapital_final
 
Canada M&A Insights - March 2017
Canada M&A Insights - March 2017Canada M&A Insights - March 2017
Canada M&A Insights - March 2017
 
C&W MARKETBEAT- CAPITAL MARKETS Q4 2016 – #CRE #REALESTATE #CCIM #SIOR @YOURT...
C&W MARKETBEAT- CAPITAL MARKETS Q4 2016 – #CRE #REALESTATE #CCIM #SIOR @YOURT...C&W MARKETBEAT- CAPITAL MARKETS Q4 2016 – #CRE #REALESTATE #CCIM #SIOR @YOURT...
C&W MARKETBEAT- CAPITAL MARKETS Q4 2016 – #CRE #REALESTATE #CCIM #SIOR @YOURT...
 
C&W-Marketbeat-U.S. Industrial-Q3-2018 #CRE #REALESTATE
C&W-Marketbeat-U.S. Industrial-Q3-2018 #CRE #REALESTATEC&W-Marketbeat-U.S. Industrial-Q3-2018 #CRE #REALESTATE
C&W-Marketbeat-U.S. Industrial-Q3-2018 #CRE #REALESTATE
 
Eye on the markets
Eye on the marketsEye on the markets
Eye on the markets
 
C&W Q3 2021 Canadian Cap Rate Report
 C&W Q3 2021 Canadian  Cap Rate Report  C&W Q3 2021 Canadian  Cap Rate Report
C&W Q3 2021 Canadian Cap Rate Report
 
Marcu & Millichap 2016 U.S. MULTIFAMILY INVESTMENT FORECAST
Marcu & Millichap 2016 U.S. MULTIFAMILY INVESTMENT FORECASTMarcu & Millichap 2016 U.S. MULTIFAMILY INVESTMENT FORECAST
Marcu & Millichap 2016 U.S. MULTIFAMILY INVESTMENT FORECAST
 
Turbulent Times: Our economic prospects in an uncertain world
Turbulent Times: Our economic prospects in an uncertain worldTurbulent Times: Our economic prospects in an uncertain world
Turbulent Times: Our economic prospects in an uncertain world
 
Capital Markets Insights: Credit Availability for the Middle Market Remains R...
Capital Markets Insights: Credit Availability for the Middle Market Remains R...Capital Markets Insights: Credit Availability for the Middle Market Remains R...
Capital Markets Insights: Credit Availability for the Middle Market Remains R...
 
Economy & Internet Trends - Morgan Stanley Presentation
Economy & Internet Trends - Morgan Stanley PresentationEconomy & Internet Trends - Morgan Stanley Presentation
Economy & Internet Trends - Morgan Stanley Presentation
 
Capital Markets Insights - Summer 2017
Capital Markets Insights - Summer 2017Capital Markets Insights - Summer 2017
Capital Markets Insights - Summer 2017
 
Canadian M&A Insights - Summer 2017
Canadian M&A Insights - Summer 2017Canadian M&A Insights - Summer 2017
Canadian M&A Insights - Summer 2017
 
2017 Global Economic Outlook by Dun & Bradstreet
2017 Global Economic Outlook by Dun & Bradstreet2017 Global Economic Outlook by Dun & Bradstreet
2017 Global Economic Outlook by Dun & Bradstreet
 
Economy and equity markets: are they disconnected?
Economy and equity markets: are they disconnected?Economy and equity markets: are they disconnected?
Economy and equity markets: are they disconnected?
 
High Yield Bonds - The Rise of the Fallen
High Yield Bonds - The Rise of the FallenHigh Yield Bonds - The Rise of the Fallen
High Yield Bonds - The Rise of the Fallen
 
Commercial Real Estate Market Overview - 2016Q1
Commercial Real Estate Market Overview - 2016Q1Commercial Real Estate Market Overview - 2016Q1
Commercial Real Estate Market Overview - 2016Q1
 
Commercial realestate market overview 2016
Commercial realestate market overview 2016Commercial realestate market overview 2016
Commercial realestate market overview 2016
 
Before the Open May 16 2017
Before the Open May 16 2017Before the Open May 16 2017
Before the Open May 16 2017
 
EY Analyst themes of quarterly oil & gas earnings: 3Q18
EY Analyst themes of quarterly oil & gas earnings: 3Q18EY Analyst themes of quarterly oil & gas earnings: 3Q18
EY Analyst themes of quarterly oil & gas earnings: 3Q18
 
PwC Global Economy watch (mars 2014)
PwC Global Economy watch (mars 2014)PwC Global Economy watch (mars 2014)
PwC Global Economy watch (mars 2014)
 

Ähnlich wie Global Insight

4th Quarter 2017 Market Update
4th Quarter 2017 Market Update4th Quarter 2017 Market Update
4th Quarter 2017 Market UpdateSarah Cuddy
 
Deloitte India: The beginning of new M&A session
Deloitte India: The beginning of new M&A sessionDeloitte India: The beginning of new M&A session
Deloitte India: The beginning of new M&A sessionaakash malhotra
 
January 2010 atm
January 2010 atmJanuary 2010 atm
January 2010 atmGreg Meier
 
M&A Capital Market Update Q1 2021
M&A Capital Market Update Q1 2021M&A Capital Market Update Q1 2021
M&A Capital Market Update Q1 2021Jarred Olson
 
SVB State of the Markets Q3 2018
SVB State of the Markets Q3 2018SVB State of the Markets Q3 2018
SVB State of the Markets Q3 2018Silicon Valley Bank
 
ATM summer (May) 2006
ATM summer (May) 2006ATM summer (May) 2006
ATM summer (May) 2006Greg Meier
 
JLL Research - US_Investment_Outlook_-_Q4_2016
JLL Research - US_Investment_Outlook_-_Q4_2016JLL Research - US_Investment_Outlook_-_Q4_2016
JLL Research - US_Investment_Outlook_-_Q4_2016Matt Berres
 
Private Capital Markets Spring 2018
Private Capital Markets Spring 2018Private Capital Markets Spring 2018
Private Capital Markets Spring 2018Duff & Phelps
 
Spring '18 Portfolio Performance
Spring '18 Portfolio PerformanceSpring '18 Portfolio Performance
Spring '18 Portfolio PerformanceMike Roma
 
Sprung Investment Management Commentary - 1st Quarter, 2018
Sprung Investment Management Commentary - 1st Quarter, 2018Sprung Investment Management Commentary - 1st Quarter, 2018
Sprung Investment Management Commentary - 1st Quarter, 2018Robert Champion
 
Capital Markets Insights Summer 2018
Capital Markets Insights Summer 2018Capital Markets Insights Summer 2018
Capital Markets Insights Summer 2018Duff & Phelps
 
Market Outlook- 2019
Market Outlook- 2019Market Outlook- 2019
Market Outlook- 2019Shreya Gulati
 
Equity Strategy - Staying Defensive
Equity Strategy - Staying DefensiveEquity Strategy - Staying Defensive
Equity Strategy - Staying DefensiveKevin Cheng, CFA
 
Cost trends - Construction Strategies
Cost trends - Construction StrategiesCost trends - Construction Strategies
Cost trends - Construction StrategiesCannonDesign
 
2008 Market Review and Outlook
2008 Market Review and Outlook2008 Market Review and Outlook
2008 Market Review and OutlookJimolson
 
RICS Americas Property World Fall 2009
RICS Americas Property World Fall 2009RICS Americas Property World Fall 2009
RICS Americas Property World Fall 2009Will Safer
 
2009 - August (Autumn)
2009 - August (Autumn)2009 - August (Autumn)
2009 - August (Autumn)Greg Meier
 

Ähnlich wie Global Insight (20)

4th Quarter 2017 Market Update
4th Quarter 2017 Market Update4th Quarter 2017 Market Update
4th Quarter 2017 Market Update
 
The "X" Factor
The "X" FactorThe "X" Factor
The "X" Factor
 
Deloitte India: The beginning of new M&A session
Deloitte India: The beginning of new M&A sessionDeloitte India: The beginning of new M&A session
Deloitte India: The beginning of new M&A session
 
January 2010 atm
January 2010 atmJanuary 2010 atm
January 2010 atm
 
M&A Capital Market Update Q1 2021
M&A Capital Market Update Q1 2021M&A Capital Market Update Q1 2021
M&A Capital Market Update Q1 2021
 
SVB State of the Markets Q3 2018
SVB State of the Markets Q3 2018SVB State of the Markets Q3 2018
SVB State of the Markets Q3 2018
 
ATM summer (May) 2006
ATM summer (May) 2006ATM summer (May) 2006
ATM summer (May) 2006
 
JLL Research - US_Investment_Outlook_-_Q4_2016
JLL Research - US_Investment_Outlook_-_Q4_2016JLL Research - US_Investment_Outlook_-_Q4_2016
JLL Research - US_Investment_Outlook_-_Q4_2016
 
Private Capital Markets Spring 2018
Private Capital Markets Spring 2018Private Capital Markets Spring 2018
Private Capital Markets Spring 2018
 
Spring '18 Portfolio Performance
Spring '18 Portfolio PerformanceSpring '18 Portfolio Performance
Spring '18 Portfolio Performance
 
Sprung Investment Management Commentary - 1st Quarter, 2018
Sprung Investment Management Commentary - 1st Quarter, 2018Sprung Investment Management Commentary - 1st Quarter, 2018
Sprung Investment Management Commentary - 1st Quarter, 2018
 
Capital Markets Insights Summer 2018
Capital Markets Insights Summer 2018Capital Markets Insights Summer 2018
Capital Markets Insights Summer 2018
 
Market Outlook- 2019
Market Outlook- 2019Market Outlook- 2019
Market Outlook- 2019
 
Equity Strategy - Staying Defensive
Equity Strategy - Staying DefensiveEquity Strategy - Staying Defensive
Equity Strategy - Staying Defensive
 
Support System
Support SystemSupport System
Support System
 
September Mmr
September MmrSeptember Mmr
September Mmr
 
Cost trends - Construction Strategies
Cost trends - Construction StrategiesCost trends - Construction Strategies
Cost trends - Construction Strategies
 
2008 Market Review and Outlook
2008 Market Review and Outlook2008 Market Review and Outlook
2008 Market Review and Outlook
 
RICS Americas Property World Fall 2009
RICS Americas Property World Fall 2009RICS Americas Property World Fall 2009
RICS Americas Property World Fall 2009
 
2009 - August (Autumn)
2009 - August (Autumn)2009 - August (Autumn)
2009 - August (Autumn)
 

Mehr von David Apted

Tax Reform: Time for Rubber to meet the road!
Tax Reform: Time for Rubber to meet the road!Tax Reform: Time for Rubber to meet the road!
Tax Reform: Time for Rubber to meet the road!David Apted
 
Dangerous Curves Ahead
Dangerous Curves AheadDangerous Curves Ahead
Dangerous Curves AheadDavid Apted
 
The Last Yield on Earth
The Last Yield on EarthThe Last Yield on Earth
The Last Yield on EarthDavid Apted
 
China: The Long March to Reform
China: The Long March to ReformChina: The Long March to Reform
China: The Long March to ReformDavid Apted
 
Global Insight-Wake Me Up When September Begins
Global Insight-Wake Me Up When September BeginsGlobal Insight-Wake Me Up When September Begins
Global Insight-Wake Me Up When September BeginsDavid Apted
 
Deduct Premiums for Long-Term Care?
Deduct Premiums for Long-Term Care?Deduct Premiums for Long-Term Care?
Deduct Premiums for Long-Term Care?David Apted
 
Global Insight- Quality Check
Global Insight- Quality CheckGlobal Insight- Quality Check
Global Insight- Quality CheckDavid Apted
 
Gi French Connection
Gi French ConnectionGi French Connection
Gi French ConnectionDavid Apted
 
Global Insight - Three Paths
Global Insight - Three PathsGlobal Insight - Three Paths
Global Insight - Three PathsDavid Apted
 

Mehr von David Apted (13)

Tax Reform: Time for Rubber to meet the road!
Tax Reform: Time for Rubber to meet the road!Tax Reform: Time for Rubber to meet the road!
Tax Reform: Time for Rubber to meet the road!
 
Central Vision
Central VisionCentral Vision
Central Vision
 
Dangerous Curves Ahead
Dangerous Curves AheadDangerous Curves Ahead
Dangerous Curves Ahead
 
The Last Yield on Earth
The Last Yield on EarthThe Last Yield on Earth
The Last Yield on Earth
 
Strain In Spain
Strain In SpainStrain In Spain
Strain In Spain
 
China: The Long March to Reform
China: The Long March to ReformChina: The Long March to Reform
China: The Long March to Reform
 
Global Insight-Wake Me Up When September Begins
Global Insight-Wake Me Up When September BeginsGlobal Insight-Wake Me Up When September Begins
Global Insight-Wake Me Up When September Begins
 
Deduct Premiums for Long-Term Care?
Deduct Premiums for Long-Term Care?Deduct Premiums for Long-Term Care?
Deduct Premiums for Long-Term Care?
 
Global Insight
Global InsightGlobal Insight
Global Insight
 
Global Insight
Global InsightGlobal Insight
Global Insight
 
Global Insight- Quality Check
Global Insight- Quality CheckGlobal Insight- Quality Check
Global Insight- Quality Check
 
Gi French Connection
Gi French ConnectionGi French Connection
Gi French Connection
 
Global Insight - Three Paths
Global Insight - Three PathsGlobal Insight - Three Paths
Global Insight - Three Paths
 

Kürzlich hochgeladen

government_intervention_in_business_ownership[1].pdf
government_intervention_in_business_ownership[1].pdfgovernment_intervention_in_business_ownership[1].pdf
government_intervention_in_business_ownership[1].pdfshaunmashale756
 
Financial Leverage Definition, Advantages, and Disadvantages
Financial Leverage Definition, Advantages, and DisadvantagesFinancial Leverage Definition, Advantages, and Disadvantages
Financial Leverage Definition, Advantages, and Disadvantagesjayjaymabutot13
 
(办理学位证)加拿大萨省大学毕业证成绩单原版一比一
(办理学位证)加拿大萨省大学毕业证成绩单原版一比一(办理学位证)加拿大萨省大学毕业证成绩单原版一比一
(办理学位证)加拿大萨省大学毕业证成绩单原版一比一S SDS
 
Call Girls In Yusuf Sarai Women Seeking Men 9654467111
Call Girls In Yusuf Sarai Women Seeking Men 9654467111Call Girls In Yusuf Sarai Women Seeking Men 9654467111
Call Girls In Yusuf Sarai Women Seeking Men 9654467111Sapana Sha
 
《加拿大本地办假证-寻找办理Dalhousie毕业证和达尔豪斯大学毕业证书的中介代理》
《加拿大本地办假证-寻找办理Dalhousie毕业证和达尔豪斯大学毕业证书的中介代理》《加拿大本地办假证-寻找办理Dalhousie毕业证和达尔豪斯大学毕业证书的中介代理》
《加拿大本地办假证-寻找办理Dalhousie毕业证和达尔豪斯大学毕业证书的中介代理》rnrncn29
 
NO1 Certified Ilam kala Jadu Specialist Expert In Bahawalpur, Sargodha, Sialk...
NO1 Certified Ilam kala Jadu Specialist Expert In Bahawalpur, Sargodha, Sialk...NO1 Certified Ilam kala Jadu Specialist Expert In Bahawalpur, Sargodha, Sialk...
NO1 Certified Ilam kala Jadu Specialist Expert In Bahawalpur, Sargodha, Sialk...Amil Baba Dawood bangali
 
The Triple Threat | Article on Global Resession | Harsh Kumar
The Triple Threat | Article on Global Resession | Harsh KumarThe Triple Threat | Article on Global Resession | Harsh Kumar
The Triple Threat | Article on Global Resession | Harsh KumarHarsh Kumar
 
Bladex 1Q24 Earning Results Presentation
Bladex 1Q24 Earning Results PresentationBladex 1Q24 Earning Results Presentation
Bladex 1Q24 Earning Results PresentationBladex
 
Economic Risk Factor Update: April 2024 [SlideShare]
Economic Risk Factor Update: April 2024 [SlideShare]Economic Risk Factor Update: April 2024 [SlideShare]
Economic Risk Factor Update: April 2024 [SlideShare]Commonwealth
 
fca-bsps-decision-letter-redacted (1).pdf
fca-bsps-decision-letter-redacted (1).pdffca-bsps-decision-letter-redacted (1).pdf
fca-bsps-decision-letter-redacted (1).pdfHenry Tapper
 
Classical Theory of Macroeconomics by Adam Smith
Classical Theory of Macroeconomics by Adam SmithClassical Theory of Macroeconomics by Adam Smith
Classical Theory of Macroeconomics by Adam SmithAdamYassin2
 
Call Girls Near Delhi Pride Hotel, New Delhi|9873777170
Call Girls Near Delhi Pride Hotel, New Delhi|9873777170Call Girls Near Delhi Pride Hotel, New Delhi|9873777170
Call Girls Near Delhi Pride Hotel, New Delhi|9873777170Sonam Pathan
 
(中央兰开夏大学毕业证学位证成绩单-案例)
(中央兰开夏大学毕业证学位证成绩单-案例)(中央兰开夏大学毕业证学位证成绩单-案例)
(中央兰开夏大学毕业证学位证成绩单-案例)twfkn8xj
 
Stock Market Brief Deck for "this does not happen often".pdf
Stock Market Brief Deck for "this does not happen often".pdfStock Market Brief Deck for "this does not happen often".pdf
Stock Market Brief Deck for "this does not happen often".pdfMichael Silva
 
Stock Market Brief Deck for 4/24/24 .pdf
Stock Market Brief Deck for 4/24/24 .pdfStock Market Brief Deck for 4/24/24 .pdf
Stock Market Brief Deck for 4/24/24 .pdfMichael Silva
 
Quantitative Analysis of Retail Sector Companies
Quantitative Analysis of Retail Sector CompaniesQuantitative Analysis of Retail Sector Companies
Quantitative Analysis of Retail Sector Companiesprashantbhati354
 
(办理原版一样)QUT毕业证昆士兰科技大学毕业证学位证留信学历认证成绩单补办
(办理原版一样)QUT毕业证昆士兰科技大学毕业证学位证留信学历认证成绩单补办(办理原版一样)QUT毕业证昆士兰科技大学毕业证学位证留信学历认证成绩单补办
(办理原版一样)QUT毕业证昆士兰科技大学毕业证学位证留信学历认证成绩单补办fqiuho152
 
NO1 WorldWide Genuine vashikaran specialist Vashikaran baba near Lahore Vashi...
NO1 WorldWide Genuine vashikaran specialist Vashikaran baba near Lahore Vashi...NO1 WorldWide Genuine vashikaran specialist Vashikaran baba near Lahore Vashi...
NO1 WorldWide Genuine vashikaran specialist Vashikaran baba near Lahore Vashi...Amil baba
 
BPPG response - Options for Defined Benefit schemes - 19Apr24.pdf
BPPG response - Options for Defined Benefit schemes - 19Apr24.pdfBPPG response - Options for Defined Benefit schemes - 19Apr24.pdf
BPPG response - Options for Defined Benefit schemes - 19Apr24.pdfHenry Tapper
 

Kürzlich hochgeladen (20)

🔝+919953056974 🔝young Delhi Escort service Pusa Road
🔝+919953056974 🔝young Delhi Escort service Pusa Road🔝+919953056974 🔝young Delhi Escort service Pusa Road
🔝+919953056974 🔝young Delhi Escort service Pusa Road
 
government_intervention_in_business_ownership[1].pdf
government_intervention_in_business_ownership[1].pdfgovernment_intervention_in_business_ownership[1].pdf
government_intervention_in_business_ownership[1].pdf
 
Financial Leverage Definition, Advantages, and Disadvantages
Financial Leverage Definition, Advantages, and DisadvantagesFinancial Leverage Definition, Advantages, and Disadvantages
Financial Leverage Definition, Advantages, and Disadvantages
 
(办理学位证)加拿大萨省大学毕业证成绩单原版一比一
(办理学位证)加拿大萨省大学毕业证成绩单原版一比一(办理学位证)加拿大萨省大学毕业证成绩单原版一比一
(办理学位证)加拿大萨省大学毕业证成绩单原版一比一
 
Call Girls In Yusuf Sarai Women Seeking Men 9654467111
Call Girls In Yusuf Sarai Women Seeking Men 9654467111Call Girls In Yusuf Sarai Women Seeking Men 9654467111
Call Girls In Yusuf Sarai Women Seeking Men 9654467111
 
《加拿大本地办假证-寻找办理Dalhousie毕业证和达尔豪斯大学毕业证书的中介代理》
《加拿大本地办假证-寻找办理Dalhousie毕业证和达尔豪斯大学毕业证书的中介代理》《加拿大本地办假证-寻找办理Dalhousie毕业证和达尔豪斯大学毕业证书的中介代理》
《加拿大本地办假证-寻找办理Dalhousie毕业证和达尔豪斯大学毕业证书的中介代理》
 
NO1 Certified Ilam kala Jadu Specialist Expert In Bahawalpur, Sargodha, Sialk...
NO1 Certified Ilam kala Jadu Specialist Expert In Bahawalpur, Sargodha, Sialk...NO1 Certified Ilam kala Jadu Specialist Expert In Bahawalpur, Sargodha, Sialk...
NO1 Certified Ilam kala Jadu Specialist Expert In Bahawalpur, Sargodha, Sialk...
 
The Triple Threat | Article on Global Resession | Harsh Kumar
The Triple Threat | Article on Global Resession | Harsh KumarThe Triple Threat | Article on Global Resession | Harsh Kumar
The Triple Threat | Article on Global Resession | Harsh Kumar
 
Bladex 1Q24 Earning Results Presentation
Bladex 1Q24 Earning Results PresentationBladex 1Q24 Earning Results Presentation
Bladex 1Q24 Earning Results Presentation
 
Economic Risk Factor Update: April 2024 [SlideShare]
Economic Risk Factor Update: April 2024 [SlideShare]Economic Risk Factor Update: April 2024 [SlideShare]
Economic Risk Factor Update: April 2024 [SlideShare]
 
fca-bsps-decision-letter-redacted (1).pdf
fca-bsps-decision-letter-redacted (1).pdffca-bsps-decision-letter-redacted (1).pdf
fca-bsps-decision-letter-redacted (1).pdf
 
Classical Theory of Macroeconomics by Adam Smith
Classical Theory of Macroeconomics by Adam SmithClassical Theory of Macroeconomics by Adam Smith
Classical Theory of Macroeconomics by Adam Smith
 
Call Girls Near Delhi Pride Hotel, New Delhi|9873777170
Call Girls Near Delhi Pride Hotel, New Delhi|9873777170Call Girls Near Delhi Pride Hotel, New Delhi|9873777170
Call Girls Near Delhi Pride Hotel, New Delhi|9873777170
 
(中央兰开夏大学毕业证学位证成绩单-案例)
(中央兰开夏大学毕业证学位证成绩单-案例)(中央兰开夏大学毕业证学位证成绩单-案例)
(中央兰开夏大学毕业证学位证成绩单-案例)
 
Stock Market Brief Deck for "this does not happen often".pdf
Stock Market Brief Deck for "this does not happen often".pdfStock Market Brief Deck for "this does not happen often".pdf
Stock Market Brief Deck for "this does not happen often".pdf
 
Stock Market Brief Deck for 4/24/24 .pdf
Stock Market Brief Deck for 4/24/24 .pdfStock Market Brief Deck for 4/24/24 .pdf
Stock Market Brief Deck for 4/24/24 .pdf
 
Quantitative Analysis of Retail Sector Companies
Quantitative Analysis of Retail Sector CompaniesQuantitative Analysis of Retail Sector Companies
Quantitative Analysis of Retail Sector Companies
 
(办理原版一样)QUT毕业证昆士兰科技大学毕业证学位证留信学历认证成绩单补办
(办理原版一样)QUT毕业证昆士兰科技大学毕业证学位证留信学历认证成绩单补办(办理原版一样)QUT毕业证昆士兰科技大学毕业证学位证留信学历认证成绩单补办
(办理原版一样)QUT毕业证昆士兰科技大学毕业证学位证留信学历认证成绩单补办
 
NO1 WorldWide Genuine vashikaran specialist Vashikaran baba near Lahore Vashi...
NO1 WorldWide Genuine vashikaran specialist Vashikaran baba near Lahore Vashi...NO1 WorldWide Genuine vashikaran specialist Vashikaran baba near Lahore Vashi...
NO1 WorldWide Genuine vashikaran specialist Vashikaran baba near Lahore Vashi...
 
BPPG response - Options for Defined Benefit schemes - 19Apr24.pdf
BPPG response - Options for Defined Benefit schemes - 19Apr24.pdfBPPG response - Options for Defined Benefit schemes - 19Apr24.pdf
BPPG response - Options for Defined Benefit schemes - 19Apr24.pdf
 

Global Insight

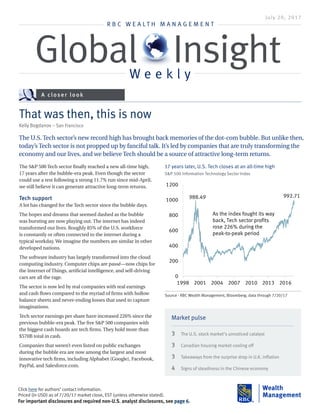
  • 1. Click here for authors’ contact information. Priced (in USD) as of 7/20/17 market close, EST (unless otherwise stated). For important disclosures and required non-U.S. analyst disclosures, see page 6. The S&P 500 Tech sector finally reached a new all-time high, 17 years after the bubble-era peak. Even though the sector could use a rest following a strong 11.7% run since mid-April, we still believe it can generate attractive long-term returns. Tech support A lot has changed for the Tech sector since the bubble days. The hopes and dreams that seemed dashed as the bubble was bursting are now playing out. The internet has indeed transformed our lives. Roughly 85% of the U.S. workforce is constantly or often connected to the internet during a typical workday. We imagine the numbers are similar in other developed nations. The software industry has largely transformed into the cloud computing industry. Computer chips are passé—now chips for the Internet of Things, artificial intelligence, and self-driving cars are all the rage. The sector is now led by real companies with real earnings and cash flows compared to the myriad of firms with hollow balance sheets and never-ending losses that used to capture imaginations. Tech sector earnings per share have increased 226% since the previous bubble-era peak. The five S&P 500 companies with the biggest cash hoards are tech firms. They hold more than $570B total in cash. Companies that weren’t even listed on public exchanges during the bubble era are now among the largest and most innovative tech firms, including Alphabet (Google), Facebook, PayPal, and Salesforce.com. That was then, this is now Kelly Bogdanov – San Francisco July 20, 2017 A closer look The U.S. Tech sector’s new record high has brought back memories of the dot-com bubble. But unlike then, today’s Tech sector is not propped up by fanciful talk. It’s led by companies that are truly transforming the economy and our lives, and we believe Tech should be a source of attractive long-term returns. R B C W E A L T H M A N A G E M E N T Global InsightW e e k l y 3 The U.S. stock market’s unnoticed catalyst 3 Canadian housing market cooling off 3 Takeaways from the surprise drop in U.K. inflation 4 Signs of steadiness in the Chinese economy Market pulse Source - RBC Wealth Management, Bloomberg; data through 7/20/17 17 years later, U.S. Tech closes at an all-time high S&P 500 Information Technology Sector Index 992.71988.49 0 200 400 600 800 1000 1200 1998 2001 2004 2007 2010 2013 2016 As the index fought its way back, Tech sector profits rose 226% during the peak-to-peak period
  • 2. 2 | Global Insight Weekly July 20, 2017 | RBC Wealth Management Leadership is also coming from companies that were public back then but have since reinvented their products and services, such as Adobe Systems, Analog Devices, Apple, Microsoft, and NVIDIA, just to name a handful. The U.S. is the home of eight of the 10 largest tech firms worldwide by market capitalization. U.S.-based firms garnered 66% of the revenues in the past 12 months among the largest 100 tech companies globally. Not over the top While the industry’s transformation has been nothing short of remarkable, ushering in a secular (long-term) growth phase that is impacting many segments of the global economy, there is another key difference between then and now that cannot be overlooked from an investment standpoint: valuation. The Tech sector was wildly overvalued at 83x trailing and 60x forward earnings during the bubble era. Today, while its valuations are elevated, they are nowhere near those levels, registering at 24.6x trailing and 19.4x forward estimates (see upper chart). From our vantage point, the current price-to- earnings (P/E) ratios are reasonable considering the economy remains locked in an ultralow interest rate environment, which can accommodate moderately elevated valuations, and given we view the quality of earnings and balance sheets as high. The ratio between the forward P/Es of the Tech sector and the S&P 500 currently stands at 1.02, below the average level since 2004. Meanwhile, Tech is forecast to moderately outgrow the S&P 500 in 2017 and 2018, according to the Thomson Reuters I/B/E/S consensus data. Despite its strong year-to-date rally, Tech’s free cash flow yield—a measure of expected return—exceeds the S&P 500 and seven of 10 other sectors. Furthermore, Tech is now on the dividend radar screen. The sector’s dividend yield has risen to 1.29% from only 0.09% at the bubble’s peak. We think the sector’s dividend yield expansion has much further to go, as some of the more mature companies with sizeable cash holdings have capacity to increase dividends, especially if overseas cash is repatriated as a part of a tax reform package. Among the five tech firms with the biggest cash holdings, roughly 85% of the cash is held overseas. Tech solution Despite the potential near-term headwinds following Tech’s strong run, innovation trends combined with reasonable valuations and attractive secular growth prospects are compelling reasons to own the U.S. Tech sector in equity portfolios. We believe the innovation wave has the sector well positioned to help lead the S&P 500 in the next year or longer. Source - RBC Wealth Management, Bloomberg; data through 7/19/17 Tech valuations have drifted up but are nowhere near peak levels Tech sector price-to-earnings (P/E) ratios 83x 24.6x 60x 19.4x 0 15 30 45 60 75 90 1998 2001 2004 2007 2010 2013 2016 Trailing P/E ratio Forward P/E ratio Source - RBC Wealth Management, Bloomberg; monthly data through 7/18/17 Tech makes up 23% of the S&P 500, well below bubble levels Tech sector as a percentage of S&P 500 market capitalization 0% 5% 10% 15% 20% 25% 30% 35% 1990 1995 2000 2005 2010 2015
  • 3. 3 | Global Insight Weekly July 20, 2017 | RBC Wealth Management factor underlying a sustained oil price recovery revolves around long cycle-time projects beginning to fade, which RBC Capital Markets anticipates in 2019. • In light of the lower crude oil forecasts, RBC Capital Markets’ energy team lowered its cash flow per share estimates for its Canadian integrated and senior producer coverage universe by 17% and 22% on average in 2017 and 2018, respectively. RBC Capital Markets’ updated forecasts align with our more cautious outlook for crude oil. In the current environment, we continue to favour well- capitalized producers with visible production growth and above-average execution capability. Eu ro pe Frédérique Carrier & Thomas McGarrity – London • As expected, the European Central Bank (ECB) kept its policy unchanged at its July meeting. The euro continued to strengthen versus the U.S. dollar (see chart on next page), crossing above $1.16 for the first time since May 2016, as ECB President Mario Draghi did not suggest the euro’s recent strength was becoming uncomfortable for policymakers. We expect the ECB to discuss some sort of changes to its monetary policy at its next meeting in September. RBC Capital Markets still sees the ECB extending its bond-buying program into the middle of next year but with purchases tapered to reflect the improvement in the euro area economy and the scarcity of government bonds available. • There was a surprise drop in U.K. inflation in June. The Consumer Price Index eased to 2.6% y/y, from 2.9% y/y in May, and versus consensus expectations for it to remain flat. Key drivers of the decline were lower prices for fuel and the “recreation and culture” component of the inflation United States Kelly Bogdanov – San Francisco • The equity market continued its winning ways with the S&P 500, Dow, and NASDAQ climbing to new all-time highs during the week. Solid corporate earnings reports helped boost the market. • One catalyst that has largely gone unnoticed is improved M&A activity during the first half of this year, up 11% since last period and 30% y/y (see chart). We believe domestic M&A will remain healthy so long as U.S. GDP averages 2% or more and the global economy continues to firm. In our view, the retail and packaged goods industries are candidates for consolidation given the pricing and volume challenges caused by technological innovations and customers’ changing purchasing patterns—i.e., the “Amazon effect.” Further out, RBC Capital Markets anticipates deals will transpire in the banking industry, potentially in late 2018 and into early 2019. Banks will likely seek to improve profitability and acquire deposit franchises as the Fed unwinds its balance sheet. Canada Alicia Buckiewicz & Farazeh Mahboob – Toronto • Data released this month showed that the Canadian housing market has cooled since April. The Canadian Real Estate Association reported that home sales fell 6.7% in June, which is the sharpest monthly decline since 2010. Sales declined 11.4% y/y nationwide, with the decline most pronounced in Toronto. Nationally, price action was also negative, with prices down approximately 10% from the April peak. Excluding Toronto andVancouver, the picture is brighter, with prices still up 5% y/y and monthly price gains recorded in Alberta, Manitoba, New Brunswick, and Prince Edward Island. The recent run of softer housing data comes against a backdrop of tighter policy on a number of fronts, including the newly introduced measures in Ontario designed to ease affordability pressures in the Greater Toronto Area. • RBC Capital Markets’ energy team has cut itsWTI crude forecasts to annual average prices of $48.47/barrel (bbl) in 2017 (from $54.50/bbl) and $50/bbl in 2018 (from $60/ bbl). U.S. oil supply growth forecasts, while down from previous expectations, remain robust while RBC Capital Markets expected shallower global inventory draws despite OPEC’s agreement to cap production. RBC Capital Markets believes it is likely that OPEC will extend its existing agreement beyond March 31, 2018 with its next meeting slated for November 30. The most important Source - RBC Wealth Management, Bloomberg; data as of 7/18/17 M&A has increased despite Washington uncertainties U.S. merger and acquisition volume $956 billion $1.126 trillion $1.247 trillion 2016 first half 2016 second half 2017 first half
  • 4. 4 | Global Insight Weekly July 20, 2017 | RBC Wealth Management basket. RBC Capital Markets believes June was a blip, and inflation in the U.K. will continue to head towards 3% y/y. We believe the dip in inflation has diminished the chances of increasing hawkish sentiment from the Bank of England’s Monetary Policy Committee at its August meeting, with the key focus shifting back to the downside risks to the U.K. economy, rather than trying to counter a bout of above-target inflation. • Swiss pharmaceutical group Novartis beat consensus earnings estimates by 3% for Q2. The company benefitted from higher-than-expected sales from recently launched drugs, which helped offset the impact of the ongoing decline of Gleevec, formerly Novartis’ best-selling drug, which is now exposed to generic competition. • SAP, the largest European software vendor, nudged up its revenue guidance for 2017 and announced a €500M share buyback. Operating profit was slightly below consensus expectations, however, as ongoing investments in its cloud business and increased hiring weighed on its operating margin. • Unilever’s operating profit for the first half of 2017 beat consensus estimates by 5%, as its operating margin increased 180 basis points to 17.8%, 100 basis points ahead of expectations. After rejecting Kraft Heinz’s takeover bid earlier in 2017, Unilever set a target to achieve a 20% operating margin by 2020. Asia Pacific Jay Roberts – Hong Kong • China’s economy grew by 6.9% y/y in Q2, faster than forecast and the same pace as in Q1. A broad range of economic indicators corroborate the steadiness at present in the Chinese economy. Primarily, these include both official and unofficial leading indicators, which range from moderately positive in the manufacturing sector to robust in the larger services sector. • At present, the Chinese economy is performing above expectations, in our view. A number of data points for the month of June, for example, show decent strength in the economy. These include: industrial production, +8% y/y; retail sales, +11% y/y; commercial vehicle sales, +19% y/y; and good data in the housing market. • E-commerce in China continues to grow at a far more rapid rate than the broad economy. The National Bureau of Statistics stated that online retail sales in the first half of the year rose by 33% y/y. This growth is corroborated by strong revenue growth in China’s largest internet companies, as well as by the number of packages delivered, heavily impacted by online sales. Deliveries rose by 31% y/y in June. • At the same time, the authorities in China continue to tighten leverage in the financial sector. It appears that as a result of recent, tighter policies, causing a funding squeeze for banks, some banks had pushed up yields on popular wealth management products in order to attract funds. The regulator has responded by ordering certain banks to lower the rates on these products. • The stabilizing renminbi, along with more stringent controls on capital flows, has caused capital outflows from China to decline significantly from the very high levels seen at the start of 2016. China’s FX reserves have been moving up again over the past few months. In parallel, the country’s holdings of U.S.Treasuries have also been rising, up for a fourth consecutive month in May, according to the U.S. Treasury Department. • China now holds $1.1T of U.S. government debt, slightly lower than Japan’s holdings of $1.11T. A total of $6.1T of U.S. debt is held by foreigners, of which $4T is held by governments. This means that China and Japan hold approximately one-third of all foreign holdings of U.S. Treasuries and over a half of foreign government holdings of Treasuries. • Ping An Insurance (2318 HK), the second-largest insurance company in China, is moving into wealth and asset management outside Greater China for the first time. Ping An’s Lufax division will begin operating in Singapore with a focus on global clients rather than Singapore residents. Lufax manages $65B of client assets in China. The stock has been particularly strong this year, rising by over 50% in Hong Kong. Other Chinese companies, such as Alibaba (BABA), have also been expanding into other parts of Asia. Source - RBC Wealth Management, Bloomberg; data through 7/20/17 A strengthening euro is the key driver of diverging investor returns in Europe STOXX Europe 600 returns, year to date 17% 6% -3% 0% 3% 6% 9% 12% 15% 18% Jan Mar May Jul STOXX 600 U.S. dollar returns STOXX 600 euro returns
  • 5. 5 | Global Insight Weekly July 20, 2017 | RBC Wealth Management Data as of July 20, 2017 Source - Bloomberg. Note: Equity returns do not include dividends, except for the German DAX and Brazilian Ibovespa. Bond yields in local currencies. Copper Index data and U.S. fixed income returns as of Wednesday’s close. Dollar Index measures USD vs. six major currencies. Currency rates reflect market convention (CAD/USD is the exception). Currency returns quoted in terms of the first currency in each pairing. Data as of 8:34 pm GMT 7/20/17. Examples of how to interpret currency data: CAD/USD 0.78 means 1 Canadian dollar will buy 0.78 U.S. dollar. CAD/USD 5.6% return means the Canadian dollar rose 5.6% vs. the U.S. dollar year to date. USD/JPY 113.25 means 1 U.S. dollar will buy 113.25 yen. USD/JPY -3.2% return means the U.S. dollar fell 3.2% vs. the yen year to date. Commodities (USD) Price MTD YTD 1 yr 2 yr Gold (spot $/oz) 1,243.91 0.2% 8.0% -5.5% 13.4% Silver (spot $/oz) 16.33 -1.8% 2.6% -15.9% 11.0% Copper ($/metric ton) 5,929.50 0.0% 7.4% 19.7% 8.6% Oil (WTI spot/bbl) 46.79 1.6% -12.9% 4.1% -6.7% Oil (Brent spot/bbl) 49.31 2.9% -13.2% 4.5% -13.0% Natural Gas ($/mmBtu) 3.03 -0.1% -18.6% 14.0% 7.4% Govt bonds (bps chg) Yield MTD YTD 1 yr 2 yr U.S. 10-Yr Tsy 2.259% -4.5 -18.5 67.9 -11.3 Canada 10-Yr 1.883% 12.1 16.2 76.0 30.5 U.K. 10-Yr 1.205% -5.2 -3.4 37.0 -85.6 Germany 10-Yr 0.530% 6.4 32.2 54.1 -23.2 Fixed Income (returns) Yield MTD YTD 1 yr 2 yr U.S. Aggregate 2.51% 0.4% 2.7% 0.0% 6.2% U.S. Invest Grade Corp 3.12% 0.7% 4.5% 2.2% 11.3% U.S. High Yield Corp 5.48% 0.8% 5.7% 10.3% 15.6% Currencies Rate MTD YTD 1 yr 2 yr U.S. Dollar Index 94.2790 -1.4% -7.8% -3.0% -3.8% CAD/USD 0.7945 3.0% 6.8% 3.7% 3.2% USD/CAD 1.2586 -2.9% -6.4% -3.6% -3.1% EUR/USD 1.1632 1.8% 10.6% 5.6% 7.5% GBP/USD 1.2973 -0.4% 5.1% -1.8% -16.6% AUD/USD 0.7959 3.5% 10.4% 6.4% 8.0% USD/JPY 111.9000 -0.4% -4.3% 4.7% -10.0% EUR/JPY 130.1600 1.4% 5.8% 10.6% -3.2% EUR/GBP 0.8966 2.2% 5.0% 7.5% 28.9% EUR/CHF 1.1066 1.1% 3.2% 1.8% 6.0% USD/SGD 1.3664 -0.7% -5.6% 0.7% -0.3% USD/CNY 6.7597 -0.3% -2.7% 1.2% 8.9% USD/MXN 17.4969 -3.4% -15.6% -6.3% 9.3% USD/BRL 3.1241 -5.6% -4.0% -4.2% -2.2% MARKET SCORECARD Equities (local currency) Level MTD YTD 1 yr 2 yr S&P 500 2,473.45 2.1% 10.5% 13.8% 16.2% Dow Industrials (DJIA) 21,611.78 1.2% 9.4% 16.2% 19.4% NASDAQ 6,390.00 4.1% 18.7% 25.5% 22.4% Russell 2000 1,442.35 1.9% 6.3% 19.2% 14.5% S&P/TSX Comp 15,264.64 0.5% -0.2% 5.0% 5.8% FTSE All-Share 4,095.07 2.3% 5.7% 12.4% 10.8% STOXX Europe 600 384.07 1.2% 6.3% 12.7% -5.6% EURO STOXX 50 3,499.49 1.7% 6.4% 17.9% -5.1% Hang Seng 26,740.21 3.8% 21.5% 22.2% 5.3% Shanghai Comp 3,244.87 1.6% 4.6% 7.2% -18.7% Nikkei 225 20,144.59 0.6% 5.4% 20.8% -2.5% India Sensex 31,904.40 3.2% 19.8% 14.3% 12.3% Singapore Straits Times 3,293.13 2.1% 14.3% 11.8% -2.4% Brazil Ibovespa 64,938.02 3.2% 7.8% 14.8% 25.8% Mexican Bolsa IPC 51,151.59 2.6% 12.1% 7.7% 12.3% UPCOMING EVENTS The dates reflect North American time zones. All data reflect Bloomberg consensus forecasts where available. Fri, Jul 21 Mon, Jul 24 Wed, Jul 26 Thu, Jul 27, cont. ECB Survey of Prof. Forecasters China Conf. Board Leading Eco. Index China Swift Global Payments Germany Consumer Confidence U.S. Markit Manuf. PMI Eurozone Markit Manuf. PMI China Industrial Profits Germany Retail Sales U.S. Markit Serv./Comp. PMI Eurozone Markit Serv./Comp. PMI U.K. Q2 GDP (0.3% q/q, 1.7% y/y) U.S. Durable and Capital Goods U.S. Existing-Home Sales (5.5M, -1.4% m/m) Germany Markit Manuf. PMI U.K. Index of Services U.S. Chicago Fed Nat'l Activity Canada CPI (1.1% y/y) Germany Markit Serv./Comp. PMI Fed Meeting Fri, Jul 28 Canada Retail Sales (0.3% m/m) Tue, Jul 25 U.S. New Home Sales (616K) U.S. Q2 GDP (2.6% q/q, annl'zd) Sun, Jul 23 Germany IFO Surveys Thu, Jul 27 U.S. Core PCE Japan Nikkei Manuf. PMI (52.4) U.S. Conf. Board Consumer Confidence Japan CPI Thu, Aug 3 Japan Retail Sales BoE Meeting
  • 6. 6 | Global Insight Weekly July 20, 2017 | RBC Wealth Management Authors Analyst Certification All of the views expressed in this report accurately reflect the personal views of the responsible analyst(s) about any and all of the subject securities or issuers. No part of the compensation of the responsible analyst(s) named herein is, or will be, directly or indirectly, related to the specific recommendations or views expressed by the responsible analyst(s) in this report. Important Disclosures In the U.S., RBC Wealth Management operates as a division of RBC Capital Markets, LLC. In Canada, RBC Wealth Management includes, without limitation, RBC Dominion Securities Inc., which is a foreign affiliate of RBC Capital Markets, LLC. This report has been prepared by RBC Capital Markets, LLC. which is an indirect wholly-owned subsidiary of the Royal Bank of Canada and, as such, is a related issuer of Royal Bank of Canada. Non-U.S. Analyst Disclosure: Alicia Buckiewicz, Farazeh Mahboob, and Jay Roberts, employees of RBC Wealth Management USA’s foreign affiliate RBC Dominion Securities Inc.; and Frédérique Carrier and Thomas McGarrity, employees of RBC Wealth Management USA’s foreign affiliate Royal Bank of Canada Investment Management (U.K.) Limited; contributed to the preparation of this publication. These individuals are not registered with or qualified as research analysts with the U.S. Financial Industry Regulatory Authority (“FINRA”) and, since they are not associated persons of RBC Wealth Management, they may not be subject to FINRA Rule 2241 governing communications with subject companies, the making of public appearances, and the trading of securities in accounts held by research analysts. In the event that this is a compendium report (covers six or more companies), RBC Wealth Management may choose to provide important disclosure information by reference. To access current Kelly Bogdanov – San Francisco, United States kelly.bogdanov@rbc.com; RBCCapital Markets, LLC Alicia Buckiewicz, CFA – Toronto, Canada alicia.buckiewicz@rbc.com; RBC Dominion Securities Inc. Farazeh Mahboob – Toronto, Canada farazeh.mahboob@rbc.com; RBC Dominion Securities Inc. Frédérique Carrier – London, United Kingdom frederique.carrier@rbc.com; Royal Bank of Canada Investment Management (U.K.) Ltd. Thomas McGarrity, CFA – London, United Kingdom thomas.mcgarrity@rbc.com; Royal Bank of Canada Investment Management (U.K.) Ltd. Jay Roberts – Hong Kong, China jay.roberts@rbc.com; RBC Dominion Securities Inc. D isclosures and Disclaimer disclosures, clients should refer to http://www.rbccm.com/ GLDisclosure/PublicWeb/DisclosureLookup.aspx?EntityID=2 to view disclosures regarding RBC Wealth Management and its affiliated firms. Such information is also available upon request to RBC Wealth Management Publishing, 60 South Sixth St, Minneapolis, MN 55402. References to a Recommended List in the recommendation history chart may include one or more recommended lists or model portfolios maintained by RBC Wealth Management or one of its affiliates. RBC Wealth Management recommended lists include the Guided Portfolio: Prime Income (RL 6), the Guided Portfolio: Dividend Growth (RL 8), the Guided Portfolio: ADR (RL 10), and the Guided Portfolio: All Cap Growth (RL 12), and former lists called the Guided Portfolio: Large Cap (RL 7), the Guided Portfolio: Midcap 111 (RL 9), and the Guided Portfolio: Global Equity (U.S.) (RL 11). RBC Capital Markets recommended lists include the Strategy Focus List and the Fundamental Equity Weightings (FEW) portfolios. The abbreviation ‘RL On’ means the date a security was placed on a Recommended List. The abbreviation ‘RL Off’ means the date a security was removed from a Recommended List. Distribution of Ratings For the purpose of ratings distributions, regulatory rules require member firms to assign ratings to one of three rating categories - Buy, Hold/Neutral, or Sell - regardless of a firm’s own rating categories. Although RBC Capital Markets, LLC ratings of Top Pick (TP)/Outperform (O), Sector Perform (SP) and Underperform (U) most closely correspond to Buy, Hold/Neutral and Sell, respectively, the meanings are not the same because our ratings are determined on a relative basis (as described below). Explanation of RBC Capital Markets, LLC Equity Rating System An analyst’s “sector” is the universe of companies for which the analyst provides research coverage. Accordingly, the rating assigned to a particular stock represents solely the analyst’s view of how that stock will perform over the next 12 months relative to the analyst’s sector average. Although RBC Capital Markets, LLC ratings of Top Pick (TP)/Outperform (O), Sector Perform (SP), and Underperform (U) most closely correspond to Buy, Hold/Neutral and Sell, respectively, the meanings are not the same because our ratings are determined on a relative basis (as described below). Ratings: Top Pick (TP): Represents analyst’s best idea in the sector; expected to provide significant absolute total return over 12 months with a favorable risk-reward ratio. Outperform (O): Expected to materially outperform sector average over 12 months. Sector Perform (SP): Returns expected to be in line with sector average over 12 months. Underperform (U): Returns expected to be materially below sector average over 12 months. As of June 30, 2017 Rating Count Percent Count Percent Buy [Top Pick & Outperform] 826 52.01 293 35.47 Hold [Sector Perform] 657 41.37 144 21.92 Sell [Underperform] 105 6.61 7 6.67 Investment Banking Services Provided During Past 12 Months Distribution of Ratings - RBC Capital Markets, LLC Equity Research
  • 7. 7 | Global Insight Weekly July 20, 2017 | RBC Wealth Management Risk Rating: As of March 31, 2013, RBC Capital Markets, LLC suspends its Average and Above Average risk ratings. The Speculative risk rating reflects a security’s lower level of financial or operating predictability, illiquid share trading volumes, high balance sheet leverage, or limited operating history that result in a higher expectation of financial and/ or stock price volatility. Valuation and Risks to Rating and Price Target When RBC Wealth Management assigns a value to a company in a research report, FINRA Rules and NYSE Rules (as incorporated into the FINRA Rulebook) require that the basis for the valuation and the impediments to obtaining that valuation be described. Where applicable, this information is included in the text of our research in the sections entitled “Valuation” and “Risks to Rating and Price Target”, respectively. The analyst(s) responsible for preparing this research report received compensation that is based upon various factors, including total revenues of RBC Capital Markets, LLC, and its affiliates, a portion of which are or have been generated by investment banking activities of the member companies of RBC Capital Markets, LLC and its affiliates. Other Disclosures Prepared with the assistance of our national research sources. RBC Wealth Management prepared this report and takes sole responsibility for its content and distribution. The content may have been based, at least in part, on material provided by our third-party correspondent research services. Our third-party correspondent has given RBC Wealth Management general permission to use its research reports as source materials, but has not reviewed or approved this report, nor has it been informed of its publication. Our third-party correspondent may from time to time have long or short positions in, effect transactions in, and make markets in securities referred to herein. Our third-party correspondent may from time to time perform investment banking or other services for, or solicit investment banking or other business from, any company mentioned in this report. RBC Wealth Management endeavors to make all reasonable efforts to provide research simultaneously to all eligible clients, having regard to local time zones in overseas jurisdictions. In certain investment advisory accounts, RBC Wealth Management will act as overlay manager for our clients and will initiate transactions in the securities referenced herein for those accounts upon receipt of this report. These transactions may occur before or after your receipt of this report and may have a short-term impact on the market price of the securities in which transactions occur. RBC Wealth Management research is posted to our proprietary Web sites to ensure eligible clients receive coverage initiations and changes in rating, targets, and opinions in a timely manner. Additional distribution may be done by sales personnel via e-mail, fax, or regular mail. Clients may also receive our research via third-party vendors. Please contact your RBC Wealth Management Financial Advisor for more information regarding RBC Wealth Management research. Conflicts Disclosure: RBC Wealth Management is registered with the Securities and Exchange Commission as a broker/dealer and an investment adviser, offering both brokerage and investment advisory services. RBC Wealth Management’s Policy for Managing Conflicts of Interest in Relation to Investment Research is available from us on our Web site at http://www.rbccm.com/GLDisclosure/PublicWeb/ DisclosureLookup.aspx?EntityID=2. Conflicts of interests related to our investment advisory business can be found in Part II of the Firm’s Form ADV or the Investment Advisor Group Disclosure Document. Copies of any of these documents are available upon request through your Financial Advisor. We reserve the right to amend or supplement this policy, Part II of the ADV, or Disclosure Document at any time. The authors are employed by one of the following entities: RBC Wealth Management USA, a division of RBC Capital Markets, LLC, a securities broker-dealer with principal offices located in Minnesota and New York, USA; by RBC Dominion Securities Inc., a securities broker-dealer with principal offices located in Toronto, Canada; by RBC Investment Services (Asia) Limited, a subsidiary of RBC Dominion Securities Inc., a securities broker-dealer with principal offices located in Hong Kong, China; and by Royal Bank of Canada Investment Management (U.K.) Limited, an investment management company with principal offices located in London, United Kingdom. Research Resources This document is produced by the Global Portfolio Advisory Committee within RBC Wealth Management’s Portfolio Advisory Group. The RBC WM Portfolio Advisory Group provides support related to asset allocation and portfolio construction for the firm’s Investment Advisors / Financial Advisors who are engaged in assembling portfolios incorporating individual marketable securities. The Committee leverages the broad market outlook as developed by the RBC Investment Strategy Committee, providing additional tactical and thematic support utilizing research from the RBC Investment Strategy Committee, RBC Capital Markets, and third-party resources. The Global Industry Classification Standard (“GICS”) was developed by and is the exclusive property and a service mark of MSCI Inc. (“MSCI”) and Standard & Poor’s Financial Services LLC (“S&P”) and is licensed for use by RBC. Neither MSCI, S&P, nor any other party involved in making or compiling the GICS or any GICS classifications makes any express or implied warranties or representations with respect to such standard or classification (or the results to be obtained by the use thereof), and all such parties hereby expressly disclaim all warranties of originality, accuracy, completeness, merchantability and fitness for a particular purpose with respect to any of such standard or classification. Without limiting any of the foregoing, in no event shall MSCI, S&P, any of their affiliates or any third party involved in making or compiling the GICS or any GICS classifications have any liability for any direct, indirect, special, punitive, consequential or any other damages (including lost profits) even if notified of the possibility of such damages. Disclaimer The information contained in this report has been compiled by RBC Wealth Management, a division of RBC Capital Markets, LLC, from sources believed to be reliable, but no representation or warranty, express or implied, is made by Royal Bank of Canada, RBC Wealth Management, its affiliates or any other person as to its accuracy, completeness or correctness. All opinions and estimates contained in this report constitute RBC Wealth Management’s judgment as of the date of this report, are subject to change without notice and are provided in good faith but without legal responsibility. Past performance is not a guide to future performance, future returns are not guaranteed, and a loss of original capital may occur. Every province in Canada, state in the U.S., and most countries throughout the world have their own laws regulating the types of securities and other investment products which may be offered to their residents, as well as the process for doing so. As a result, the securities discussed in this report may not be eligible for sale in some jurisdictions. This report is not, and under no circumstances should be construed as, a solicitation to act as securities broker or dealer in any jurisdiction by any person or company that is not legally permitted to
  • 8. 8 | Global Insight Weekly July 20, 2017 | RBC Wealth Management carry on the business of a securities broker or dealer in that jurisdiction. Nothing in this report constitutes legal, accounting or tax advice or individually tailored investment advice. This material is prepared for general circulation to clients, including clients who are affiliates of Royal Bank of Canada, and does not have regard to the particular circumstances or needs of any specific person who may read it. The investments or services contained in this report may not be suitable for you and it is recommended that you consult an independent investment advisor if you are in doubt about the suitability of such investments or services. To the full extent permitted by law neither Royal Bank of Canada nor any of its affiliates, nor any other person, accepts any liability whatsoever for any direct or consequential loss arising from any use of this report or the information contained herein. No matter contained in this document may be reproduced or copied by any means without the prior consent of Royal Bank of Canada. Additional information is available upon request. To U.S. Residents: This publication has been approved by RBC Capital Markets, LLC, Member NYSE/FINRA/SIPC, which is a U.S. registered broker-dealer and which accepts responsibility for this report and its dissemination in the United States. RBC Capital Markets, LLC, is an indirect wholly-owned subsidiary of the Royal Bank of Canada and, as such, is a related issuer of Royal Bank of Canada. Any U.S. recipient of this report that is not a registered broker-dealer or a bank acting in a broker or dealer capacity and that wishes further information regarding, or to effect any transaction in, any of the securities discussed in this report, should contact and place orders with RBC Capital Markets, LLC. International investing involves risks not typically associated with U.S. investing, including currency fluctuation, foreign taxation, political instability and different accounting standards. To Canadian Residents: This publication has been approved by RBC Dominion Securities Inc. RBC Dominion Securities Inc.* and Royal Bank of Canada are separate corporate entities which are affiliated. *Member-Canadian Investor Protection Fund. ®Registered trademark of Royal Bank of Canada. Used under license. RBC Wealth Management is a registered trademark of Royal Bank of Canada. Used under license. RBC Wealth Management (British Isles): This publication is distributed by Royal Bank of Canada Investment Management (U.K.) Limited and RBC Investment Solutions (CI) Limited. Royal Bank of Canada Investment Management (U.K.) Limited is authorised and regulated by the Financial Conduct Authority (Reference number: 146504). Registered office: Riverbank House, 2 Swan Lane , London, EC4R 3BF, UK. RBC Investment Solutions (CI) Limited is regulated by the Jersey Financial Services Commission in the conduct of investment business in Jersey. Registered office: Gaspé House, 66-72 Esplanade, St Helier, Jersey JE2 3QT, Channel Islands, registered company number 119162. To Hong Kong Residents: This publication is distributed in Hong Kong by Royal Bank of Canada, Hong Kong Branch which is regulated by the Hong Kong Monetary Authority and the Securities and Futures Commission (‘SFC’), RBC Investment Services (Asia) Limited and RBC Investment Management (Asia) Limited, both entities are regulated by the SFC. Financial Services provided to Australia: Financial services may be provided in Australia in accordance with applicable law. Financial services provided by the Royal Bank of Canada, Hong Kong Branch are provided pursuant to the Royal Bank of Canada’s Australian Financial Services Licence (‘AFSL’) (No. 246521). To Singapore Residents: This publication is distributed in Singapore by the Royal Bank of Canada, Singapore Branch, a registered entity granted offshore bank licence by the Monetary Authority of Singapore. This material has been prepared for general circulation and does not take into account the objectives, financial situation, or needs of any recipient. You are advised to seek indepen- dent advice from a financial adviser before purchasing any product. If you do not obtain independent advice, you should consider whether the product is suitable for you. Past performance is not indicative of future performance. If you have any questions related to this publication, please contact the Royal Bank of Canada, Singapore Branch. Royal Bank of Canada, Singapore Branch accepts responsibility for this report and its dissemination in Singapore. © RBC Capital Markets, LLC 2017 - Member NYSE/FINRA/SIPC © RBC Dominion Securities Inc. 2017 - Member Canadian Investor Protection Fund © RBC Europe Limited 2017 © Royal Bank of Canada 2017 All rights reserved RBC1253