DRI’s Expertise and Experience in Providing Solutions and Supporting Economic...
IUGG-IAPSO-V2
1. 1. Introduction
The World Data Center’s role is to foster international collaboration in identifying and filling spatial and temporal gaps in global data bases. This role
can be fulfilled by assembling multi-disciplinary metadata on the global scale, thus helping bridge the gap between national and international
research and monitoring programs. Such metadata will be regularly updated and made available on the World Wide Web to the global community in
near-real time. The global community’s role in providing feedback to the World Data Center is indispensable and would only grow with time as new
observational technologies become available and new oceanographic instruments (gliders, ARGO drifters, autonomous tethered vertical profilers,
instrumented animals etc.) go online.
4. Decadal Variability Studies at the NODC/WDC
The fast-increasing amount of oceanographic data rescued under GODAR resulted
in the rapidly improving spatial and temporal data coverage that enabled
observational studies of decadal variability that would hardly be possible a decade
ago.
The most important finding of the last decade was the discovery of global warming of
the World Ocean (Levitus et al., 2000; Figure 4). The global ocean warming research
was significantly expanded in the 2000s thanks to the vastly improved data coverage
that led to new, more accurate estimates of the rate of oceanic warming (Levitus et
al., 2005; Figure 5). Since the ongoing oceanic warming causes thermal expansion
of the ocean water volume (thermosteric effect), the newly available global data base
enabled a re-appraisal of the thermosteric global sea level rise (Antonov et al., 2005;
Figure 6).
International Collaboration and World Data Center’s Role in Improving
Space-Time Coverage of Global Data Bases for Observational Studies of
Decadal and Interdecadal Variability
Daphne Johnson and Sydney Levitus
NOAA1/NESDIS2/National Oceanographic Data Center
World Data Center for Oceanography, Silver Spring - USA
www.nodc.noaa.gov/OC5/
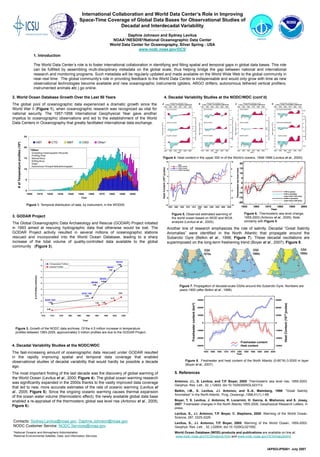
2. World Ocean Database Growth Over the Last 50 Years
The global pool of oceanographic data experienced a dramatic growth since the
World War II (Figure 1), when oceanographic research was recognized as vital for
national security. The 1957-1958 International Geophysical Year gave another
impetus to oceanographic observations and led to the establishment of the World
Data Centers in Oceanography that greatly facilitated international data exchange.
#ofTemperatureprofiles(104)
0
5
10
15
20
25
1900 1910 1920 1930 1940 1950 1960 1970 1980 1990 2000
Year
XBT CTD MBT OSD Other*
*Other:
Undulating Oceanographic Recorder
Profiling Float
Moored Buoy
Drifting Buoy
Glider
Autonomous Pinniped Bathythermograph
Figure 1. Temporal distribution of data, by instrument, in the WOD05.
Figure 7. Propagation of decadal-scale GSAs around the Subarctic Gyre. Numbers are
years-1900 (after Belkin et al., 1998).
3. GODAR Project
The Global Oceanographic Data Archaeology and Rescue (GODAR) Project initiated
in 1993 aimed at rescuing hydrographic data that otherwise would be lost. The
GODAR Project activity resulted in several millions of oceanographic stations
rescued and incorporated into the World Ocean Database, leading to a sharp
increase of the total volume of quality-controlled data available to the global
community (Figure 3).
Figure 3. Growth of the NODC data archives. Of the 4.5 million increase in temperature
profiles between 1993-2005, approximately 3 million profiles are due to the GODAR Project.
NODC 1974
1.49
NODC 1991
2.54
WOA94
4.49
WOD98
5.29
WOD05
7.90
WOD01
7.04
0.40
1.28 1.48
2.12
2.64
0
1
2
3
4
5
6
7
8
9
1970 1974 1978 1982 1986 1990 1994 1998 2002 2006
Year
#ofProfiles(millions)
Temperature Profiles
Salinity Profiles
Another line of research emphasizes the role of salinity. Decadal “Great Salinity
Anomalies” were identified in the North Atlantic that propagate around the
Subarctic Gyre (Belkin et al., 1998; Figure 7). These decadal oscillations are
superimposed on the long-term freshening trend (Boyer et al., 2007); Figure 8.
Figure 4. Heat content in the upper 300 m of the World’s oceans, 1948-1998 (Levitus et al., 2000).
Figure 6. Thermosteric sea level change,
1955-2003 (Antonov et al., 2005). Note
similarity with Figure 5.
4. Decadal Variability Studies at the NODC/WDC (cont’d)
Figure 5. Observed estimated warming of
the world ocean based on WOD and WOA
analysis (Levitus el al., 2005).
Figure 8. Freshwater and heat content of the North Atlantic (0-80°N) 0-2000 m layer
(Boyer et al., 2007).
Freshwater content
Heat content
Freshwatercontent(km3)
HeatContent(1018joules)
5. References
Antonov, J.I., S. Levitus, and T.P. Boyer, 2005: Thermosteric sea level rise, 1955-2003.
Geophys. Res. Lett., 32, L12602, doi:10.1029/2005GL023112.
Belkin, I.M., S. Levitus, J.I. Antonov, and S.-A. Malmberg, 1998: "Great Salinity
Anomalies" in the North Atlantic. Prog. Oceanogr.,1998,41(1),1-68.
Boyer, T, S. Levitus, J. Antonov, R. Locarnini, H. Garcia, A. Mishonov, and S. Josey,
2007: Freshwater changes in the North Atlantic 1955-2006, Geophysical Research Letters, in
press.
Levitus, S., J.I. Antonov, T.P. Boyer, C. Stephens, 2000: Warming of the World Ocean.
Science, 287, 2225-2229.
Levitus, S., J.I. Antonov, T.P. Boyer, 2005: Warming of the World Ocean, 1955-2003.
Geophys. Res. Lett. , 32, L02604, doi:10.1029GL021592.
World Ocean Database (WOD) products and publications are available on line at:
www.nodc.noaa.gov/OC5/indprod.html and www.nodc.noaa.gov/OC5/indpubhtml.
Contacts: Sydney.Levitus@noaa.gov; Daphne.Johnson@noaa.gov
NODC Customer Service: NODC.Services@noaa.gov
HeatContent(1022joules)
1National Oceanic and Atmospheric Administration
2National Environmental Satellite, Data, and Information Services
IAPSO/JPS001 July 2007