SlideShare ist ein Scribd-Unternehmen logo
1 von 4
DannyWalton - The rate of returnto educationinthe UK
Rate of returnto educationmeasuresthe gaininincome oninvestmentsineducation.Highereducation
isoftenconsideredaninvestment,asstudentsincurlarge costsintermsof tuitionfees(increasedfrom
0 to £3,000 in2006, and then£9,000 in2012), accommodationfees,andthe opportunitycostof work.
The Departmentof Educationand Skillsbelieve the difference inlifetime earningsbetweengraduates
and non-graduatestobe £400,000 ($592,000). (GreenawayandHaynes2003)
O’learyandSloane (2004) use an ordinaryleastsquareshumancapital model basedondatacollected
fromthe LabourForce Survey(LFS) bythe Office forNational Statistics(ONS) toestimatethe hourly
earningsof individual iwhograduatedinsubject j. The LFSaims to produce dataabout labourof 60,000
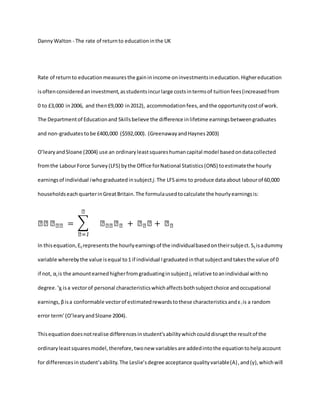
householdseachquarterinGreatBritain.The formulausedtocalculate the hourlyearningsis:
𝑙𝑙 𝑙 𝑙𝑙 = ∑
𝑙
𝑙=1
𝑙 𝑙𝑙 𝑙 𝑙 + 𝑙 𝑙 𝑙 + 𝑙 𝑙
In thisequation,Eij representsthe hourlyearningsof the individualbasedontheirsubject.Sij isadummy
variable wherebythe value isequal to1 if individual Igraduatedinthatsubjectandtakesthe value of 0
if not, αj is the amountearnedhigherfromgraduatinginsubjectj,relative toanindividual withno
degree.‘χi isa vectorof personal characteristicswhichaffectsbothsubjectchoice andoccupational
earnings,βisa conformable vectorof estimatedrewardstothese characteristicsandεi is a random
error term’(O’learyandSloane 2004).
Thisequationdoesnotrealise differencesinstudent’sabilitywhichcoulddisruptthe resultof the
ordinaryleastsquaresmodel,therefore,twonew variablesare addedintothe equationtohelpaccount
for differencesinstudent’sability.The Leslie’sdegree acceptance qualityvariable(A),and(γ),whichwill
representthe returntostudentability.The Leslie hypothesisisthatstudentswill selectsubjectsbased
on difficultybasedontheirability.DatacollectedfromUCASapplicationswasusedtocalculate the
value.Now,α will onlyreflectthe returntosubjectj basedonmarketforces.The new equationwiththe
Leslie’sdegree acceptance qualityvariable is:
𝑙𝑙 𝑙 𝑙𝑙 = ∑
𝑙
𝑙=1
𝑙 𝑙𝑙 𝑙 𝑙 + 𝑙 𝑙 𝑙 + 𝑙 𝑙 𝑙 + 𝑙 𝑙
Thisequationcanbe usedtocalculate the average future earningsof anindividualbasedontheir
undergraduate degree subject.Basedondatacollectedbythe LFSbetween1994 and 2002, using
informationfromapproximately17,500 malesand15,200 females,O’learyandSloane (2004) foundthat
a male witha degree wouldenjoya113.76% increase inhourlyearningsthanamale withno
qualifications,and131.56%. The increase inhourlyearningsformaleswithA-level standardeducation
standsat 30.03% againsta male withnoqualifications,and25.33% for females.Findingdataaboutthe
rate of returnto educationisimportantsothat studentscandecide whethertomake the investmentof
highereducation,andwhetherthe increase inearningsoveranindividual’slifetime wouldbe greater
than the cost of educationboththroughcost of living,costof tuition,andopportunitycostof missing
out on3 years(UK) of paidwork.It is alsoimportantsothat studentscanbe encouragedtojoincertain
degree subjectstoequibrilatethe supplyanddemandof labourwithindifferentmarkets,basedonthe
differencesinearningseachsubjectreturns.
The amount of male undergraduatesincreasedbyathird,and the amountof female undergraduates
doubled,between1990/91 and 2000/01 (O’learyandSloane 2005), thismeansthat there isan
increasingnumberof universityeducatedworkersjoiningthe labourforce eachyear.Giventhat
graduatesgainso much fromhavinga universityeducation,the increase innumberof applicantsand
therefore the increase insupplyof workerswithdegreesmayreduce the superiorwagespaidto
universitygraduates.Thishowevermaynotbe the case.There is evidence tosuggestthatwagesof
graduateshas remainedrelativelyconstantWalkerandZhu(2003), whichcan onlybe explainedby
demandforeducatedworkersmatchingthe increase insupply.Thisisthe case for the mostsubjects,
but subjectssuchas maths& computing,engineering&technologyandarchitecture have seen
significantincreasesinmedianearnings.Increasingreturnsinsome subjects,combinedwithdecreasing
returnsinothersubjectssuchas social sciencesandarts will resultinconstantaggregate returnsto
highereducation.Supplyanddemandshiftswill playacrucial role indeterminingwhichsubjectswill
showincreasinganddecreasingreturns.
The amount of newgraduatesthat take architecture increasedby44.86% between1994 and 2002 for
males,and25.00% for females(O’learlyandSloane 2005).There is therefore anobviousincrease in
supplyof architectures,whichwouldsuggestthatthe wage of architectureswouldfall relativelytothose
withoutdegrees,butthere hasbeenasignificantrise inmedianwagesrelative tothose with2+A levels,
11.64% for males.The change insupplydoesnotconnectwiththe changesinwages.Thisisbecause of
time lagsbetweenstudentstakingarchitecture andthe returninwagesinadultlife.Like anymarket,
once suppliersrealise there are gainstobe made,theywill enterthe market,butthe difference intime
betweenthe suppliers(students)realisingthatthere are gainsto be made from architecture degrees
and those studentsrealisingthosegainscouldspan20 years.Hence whythe increase inrelativewages
has increasedby11.64% between1994 and2002, but the no.of male studentstakingarchitecture has
increasedbya muchhigheramount,almost45%.
Rate of returnalsovariesbetweenregions,aswell aschoice of university.Returnstothose whoattend
longestablishedinstitutionscanearnupto 11% more than those otherwise(O’learyandSloane 2006).
Data showsthat inLondon,the nominal returnoneducationis20.7% per yearfor menand 22.2% (the
highestinthe country) forwomencomparedtoan individualinthe westmidlandswith2+A-levels,and
thisassumesthatduringstudygraduatesmade no income andincurred£3,000 pa tuitionfees(O’leary
and Sloane 2006). It it therefore obviousthatowningadegree inLondongivesthe highestreturns.
Although,otherdatashowsthatthe difference indegree returnsrelativetoA-level qualificationsinthe
same regionismuch lower,asmenonlymake a 1.5% increase and3.5% forfemales(the lowestinthe
country)(O’lrearyandSloane 2006).Therefore,the wagesavailable inLondoncomparedtoother
regionsare much higherhoweverthisdoesnotnecessarilydependonwhetherthe individual hasa
degree.Inotherregionsthere isasignificantdifference inreturnsdependingonwhetherthe individual
ownsa degree,sothe worthof owningadegree variesdependingonlocation.
Sloane,PJ.O’Leary,NC.(2004) “The Returnto a UniversityEducationinGreatBritain”
Sloane,PJ.O’Leary,NC.(2005) ”The ChangingWage Returnto an Undergraduate Education”
Sloane,PJ.O’Leary,NC.(2006) ”Ratesof Returnsto DegreesacrossBritishRegions”
Walker,I.AndZhu, Y. (2003) "Education,EarningsandProductivity:RecentUKEvidence",LabourMarket
Trends,March, pp. 145-152.
GreenawayD.and HaynesM.(2003) "FundingHigherEducationinthe UK: The Role of FeesandLoans",
EconomicJournal,vol.113, pp.F150-F166

Weitere ähnliche Inhalte

Ähnlich wie Rateofreturntoeducation.docx (1)

Erecruit education white paper
Erecruit education white paperErecruit education white paper
Erecruit education white paperLeeKnowles9
 
Advanced Economics Analysis
Advanced  Economics AnalysisAdvanced  Economics Analysis
Advanced Economics AnalysisStephen Doyle
 
Journal of Econometrics 121 (2004) 175–212www.elsevier.coml.docx
Journal of Econometrics 121 (2004) 175–212www.elsevier.coml.docxJournal of Econometrics 121 (2004) 175–212www.elsevier.coml.docx
Journal of Econometrics 121 (2004) 175–212www.elsevier.coml.docxpriestmanmable
 
Trends in UK Higher Education
Trends in UK Higher EducationTrends in UK Higher Education
Trends in UK Higher Educationdmclarkson
 
Project Brief - 5th Year
Project Brief - 5th YearProject Brief - 5th Year
Project Brief - 5th YearKerrie Noble
 
Analysis of Rising Tutition Rates in The United States Based on Clustering An...
Analysis of Rising Tutition Rates in The United States Based on Clustering An...Analysis of Rising Tutition Rates in The United States Based on Clustering An...
Analysis of Rising Tutition Rates in The United States Based on Clustering An...csandit
 
ANALYSIS OF RISING TUITION RATES IN THE UNITED STATES BASED ON CLUSTERING ANA...
ANALYSIS OF RISING TUITION RATES IN THE UNITED STATES BASED ON CLUSTERING ANA...ANALYSIS OF RISING TUITION RATES IN THE UNITED STATES BASED ON CLUSTERING ANA...
ANALYSIS OF RISING TUITION RATES IN THE UNITED STATES BASED ON CLUSTERING ANA...cscpconf
 
Technological progress and within occupation inequality
Technological progress and within occupation inequalityTechnological progress and within occupation inequality
Technological progress and within occupation inequalityGRAPE
 
Ict trends article may 2013
Ict trends article may 2013Ict trends article may 2013
Ict trends article may 2013Garry Roberton
 
Advanced Economic Analysis: The relationship between Earnings and Education
Advanced Economic Analysis: The relationship between Earnings and EducationAdvanced Economic Analysis: The relationship between Earnings and Education
Advanced Economic Analysis: The relationship between Earnings and EducationMark Clerkin
 
Ict trends article august 2013
Ict trends article august 2013Ict trends article august 2013
Ict trends article august 2013Garry Roberton
 
Ability and willingness to pay for university education in calabar, nigeria
Ability and willingness to pay for university education in calabar, nigeriaAbility and willingness to pay for university education in calabar, nigeria
Ability and willingness to pay for university education in calabar, nigeriaAlexander Decker
 
Impact of unit cost on academic performance of public secondary education in ...
Impact of unit cost on academic performance of public secondary education in ...Impact of unit cost on academic performance of public secondary education in ...
Impact of unit cost on academic performance of public secondary education in ...Alexander Decker
 
Labour plocies students fees research
Labour plocies  students fees researchLabour plocies  students fees research
Labour plocies students fees researchChloeKyri
 
Signaling or human capital: Evidence from the Finnish polytechnic school reform
Signaling or human capital: Evidence from the Finnish polytechnic school reformSignaling or human capital: Evidence from the Finnish polytechnic school reform
Signaling or human capital: Evidence from the Finnish polytechnic school reformPalkansaajien tutkimuslaitos
 
UK_Student_Accommodation_Report_Dec_15
UK_Student_Accommodation_Report_Dec_15UK_Student_Accommodation_Report_Dec_15
UK_Student_Accommodation_Report_Dec_15Sam Gadar
 
STEM education: preparing for the jobs of the future
STEM education: preparing for the jobs of the futureSTEM education: preparing for the jobs of the future
STEM education: preparing for the jobs of the futureElsevier
 
Adele Whelan on educational attainment and skill utilisation in the Irish lab...
Adele Whelan on educational attainment and skill utilisation in the Irish lab...Adele Whelan on educational attainment and skill utilisation in the Irish lab...
Adele Whelan on educational attainment and skill utilisation in the Irish lab...NUI Galway
 
Education and Earnings Inequality in Cameroon
Education and Earnings Inequality in CameroonEducation and Earnings Inequality in Cameroon
Education and Earnings Inequality in CameroonAJHSSR Journal
 

Ähnlich wie Rateofreturntoeducation.docx (1) (20)

Erecruit education white paper
Erecruit education white paperErecruit education white paper
Erecruit education white paper
 
Advanced Economics Analysis
Advanced  Economics AnalysisAdvanced  Economics Analysis
Advanced Economics Analysis
 
Journal of Econometrics 121 (2004) 175–212www.elsevier.coml.docx
Journal of Econometrics 121 (2004) 175–212www.elsevier.coml.docxJournal of Econometrics 121 (2004) 175–212www.elsevier.coml.docx
Journal of Econometrics 121 (2004) 175–212www.elsevier.coml.docx
 
Trends in UK Higher Education
Trends in UK Higher EducationTrends in UK Higher Education
Trends in UK Higher Education
 
Project Brief - 5th Year
Project Brief - 5th YearProject Brief - 5th Year
Project Brief - 5th Year
 
Analysis of Rising Tutition Rates in The United States Based on Clustering An...
Analysis of Rising Tutition Rates in The United States Based on Clustering An...Analysis of Rising Tutition Rates in The United States Based on Clustering An...
Analysis of Rising Tutition Rates in The United States Based on Clustering An...
 
ANALYSIS OF RISING TUITION RATES IN THE UNITED STATES BASED ON CLUSTERING ANA...
ANALYSIS OF RISING TUITION RATES IN THE UNITED STATES BASED ON CLUSTERING ANA...ANALYSIS OF RISING TUITION RATES IN THE UNITED STATES BASED ON CLUSTERING ANA...
ANALYSIS OF RISING TUITION RATES IN THE UNITED STATES BASED ON CLUSTERING ANA...
 
Technological progress and within occupation inequality
Technological progress and within occupation inequalityTechnological progress and within occupation inequality
Technological progress and within occupation inequality
 
Ict trends article may 2013
Ict trends article may 2013Ict trends article may 2013
Ict trends article may 2013
 
Advanced Economic Analysis: The relationship between Earnings and Education
Advanced Economic Analysis: The relationship between Earnings and EducationAdvanced Economic Analysis: The relationship between Earnings and Education
Advanced Economic Analysis: The relationship between Earnings and Education
 
Ict trends article august 2013
Ict trends article august 2013Ict trends article august 2013
Ict trends article august 2013
 
Ability and willingness to pay for university education in calabar, nigeria
Ability and willingness to pay for university education in calabar, nigeriaAbility and willingness to pay for university education in calabar, nigeria
Ability and willingness to pay for university education in calabar, nigeria
 
Impact of unit cost on academic performance of public secondary education in ...
Impact of unit cost on academic performance of public secondary education in ...Impact of unit cost on academic performance of public secondary education in ...
Impact of unit cost on academic performance of public secondary education in ...
 
Labour plocies students fees research
Labour plocies  students fees researchLabour plocies  students fees research
Labour plocies students fees research
 
Signaling or human capital: Evidence from the Finnish polytechnic school reform
Signaling or human capital: Evidence from the Finnish polytechnic school reformSignaling or human capital: Evidence from the Finnish polytechnic school reform
Signaling or human capital: Evidence from the Finnish polytechnic school reform
 
UK_Student_Accommodation_Report_Dec_15
UK_Student_Accommodation_Report_Dec_15UK_Student_Accommodation_Report_Dec_15
UK_Student_Accommodation_Report_Dec_15
 
STEM education: preparing for the jobs of the future
STEM education: preparing for the jobs of the futureSTEM education: preparing for the jobs of the future
STEM education: preparing for the jobs of the future
 
Adele Whelan on educational attainment and skill utilisation in the Irish lab...
Adele Whelan on educational attainment and skill utilisation in the Irish lab...Adele Whelan on educational attainment and skill utilisation in the Irish lab...
Adele Whelan on educational attainment and skill utilisation in the Irish lab...
 
What's next for travel demand and energy in transport?
What's next for travel demand and energy in transport?What's next for travel demand and energy in transport?
What's next for travel demand and energy in transport?
 
Education and Earnings Inequality in Cameroon
Education and Earnings Inequality in CameroonEducation and Earnings Inequality in Cameroon
Education and Earnings Inequality in Cameroon
 

Rateofreturntoeducation.docx (1)

  • 1. DannyWalton - The rate of returnto educationinthe UK Rate of returnto educationmeasuresthe gaininincome oninvestmentsineducation.Highereducation isoftenconsideredaninvestment,asstudentsincurlarge costsintermsof tuitionfees(increasedfrom 0 to £3,000 in2006, and then£9,000 in2012), accommodationfees,andthe opportunitycostof work. The Departmentof Educationand Skillsbelieve the difference inlifetime earningsbetweengraduates and non-graduatestobe £400,000 ($592,000). (GreenawayandHaynes2003) O’learyandSloane (2004) use an ordinaryleastsquareshumancapital model basedondatacollected fromthe LabourForce Survey(LFS) bythe Office forNational Statistics(ONS) toestimatethe hourly earningsof individual iwhograduatedinsubject j. The LFSaims to produce dataabout labourof 60,000 householdseachquarterinGreatBritain.The formulausedtocalculate the hourlyearningsis: 𝑙𝑙 𝑙 𝑙𝑙 = ∑ 𝑙 𝑙=1 𝑙 𝑙𝑙 𝑙 𝑙 + 𝑙 𝑙 𝑙 + 𝑙 𝑙 In thisequation,Eij representsthe hourlyearningsof the individualbasedontheirsubject.Sij isadummy variable wherebythe value isequal to1 if individual Igraduatedinthatsubjectandtakesthe value of 0 if not, αj is the amountearnedhigherfromgraduatinginsubjectj,relative toanindividual withno degree.‘χi isa vectorof personal characteristicswhichaffectsbothsubjectchoice andoccupational earnings,βisa conformable vectorof estimatedrewardstothese characteristicsandεi is a random error term’(O’learyandSloane 2004). Thisequationdoesnotrealise differencesinstudent’sabilitywhichcoulddisruptthe resultof the ordinaryleastsquaresmodel,therefore,twonew variablesare addedintothe equationtohelpaccount for differencesinstudent’sability.The Leslie’sdegree acceptance qualityvariable(A),and(γ),whichwill
  • 2. representthe returntostudentability.The Leslie hypothesisisthatstudentswill selectsubjectsbased on difficultybasedontheirability.DatacollectedfromUCASapplicationswasusedtocalculate the value.Now,α will onlyreflectthe returntosubjectj basedonmarketforces.The new equationwiththe Leslie’sdegree acceptance qualityvariable is: 𝑙𝑙 𝑙 𝑙𝑙 = ∑ 𝑙 𝑙=1 𝑙 𝑙𝑙 𝑙 𝑙 + 𝑙 𝑙 𝑙 + 𝑙 𝑙 𝑙 + 𝑙 𝑙 Thisequationcanbe usedtocalculate the average future earningsof anindividualbasedontheir undergraduate degree subject.Basedondatacollectedbythe LFSbetween1994 and 2002, using informationfromapproximately17,500 malesand15,200 females,O’learyandSloane (2004) foundthat a male witha degree wouldenjoya113.76% increase inhourlyearningsthanamale withno qualifications,and131.56%. The increase inhourlyearningsformaleswithA-level standardeducation standsat 30.03% againsta male withnoqualifications,and25.33% for females.Findingdataaboutthe rate of returnto educationisimportantsothat studentscandecide whethertomake the investmentof highereducation,andwhetherthe increase inearningsoveranindividual’slifetime wouldbe greater than the cost of educationboththroughcost of living,costof tuition,andopportunitycostof missing out on3 years(UK) of paidwork.It is alsoimportantsothat studentscanbe encouragedtojoincertain degree subjectstoequibrilatethe supplyanddemandof labourwithindifferentmarkets,basedonthe differencesinearningseachsubjectreturns. The amount of male undergraduatesincreasedbyathird,and the amountof female undergraduates doubled,between1990/91 and 2000/01 (O’learyandSloane 2005), thismeansthat there isan increasingnumberof universityeducatedworkersjoiningthe labourforce eachyear.Giventhat graduatesgainso much fromhavinga universityeducation,the increase innumberof applicantsand therefore the increase insupplyof workerswithdegreesmayreduce the superiorwagespaidto
  • 3. universitygraduates.Thishowevermaynotbe the case.There is evidence tosuggestthatwagesof graduateshas remainedrelativelyconstantWalkerandZhu(2003), whichcan onlybe explainedby demandforeducatedworkersmatchingthe increase insupply.Thisisthe case for the mostsubjects, but subjectssuchas maths& computing,engineering&technologyandarchitecture have seen significantincreasesinmedianearnings.Increasingreturnsinsome subjects,combinedwithdecreasing returnsinothersubjectssuchas social sciencesandarts will resultinconstantaggregate returnsto highereducation.Supplyanddemandshiftswill playacrucial role indeterminingwhichsubjectswill showincreasinganddecreasingreturns. The amount of newgraduatesthat take architecture increasedby44.86% between1994 and 2002 for males,and25.00% for females(O’learlyandSloane 2005).There is therefore anobviousincrease in supplyof architectures,whichwouldsuggestthatthe wage of architectureswouldfall relativelytothose withoutdegrees,butthere hasbeenasignificantrise inmedianwagesrelative tothose with2+A levels, 11.64% for males.The change insupplydoesnotconnectwiththe changesinwages.Thisisbecause of time lagsbetweenstudentstakingarchitecture andthe returninwagesinadultlife.Like anymarket, once suppliersrealise there are gainstobe made,theywill enterthe market,butthe difference intime betweenthe suppliers(students)realisingthatthere are gainsto be made from architecture degrees and those studentsrealisingthosegainscouldspan20 years.Hence whythe increase inrelativewages has increasedby11.64% between1994 and2002, but the no.of male studentstakingarchitecture has increasedbya muchhigheramount,almost45%. Rate of returnalsovariesbetweenregions,aswell aschoice of university.Returnstothose whoattend longestablishedinstitutionscanearnupto 11% more than those otherwise(O’learyandSloane 2006). Data showsthat inLondon,the nominal returnoneducationis20.7% per yearfor menand 22.2% (the highestinthe country) forwomencomparedtoan individualinthe westmidlandswith2+A-levels,and thisassumesthatduringstudygraduatesmade no income andincurred£3,000 pa tuitionfees(O’leary
  • 4. and Sloane 2006). It it therefore obviousthatowningadegree inLondongivesthe highestreturns. Although,otherdatashowsthatthe difference indegree returnsrelativetoA-level qualificationsinthe same regionismuch lower,asmenonlymake a 1.5% increase and3.5% forfemales(the lowestinthe country)(O’lrearyandSloane 2006).Therefore,the wagesavailable inLondoncomparedtoother regionsare much higherhoweverthisdoesnotnecessarilydependonwhetherthe individual hasa degree.Inotherregionsthere isasignificantdifference inreturnsdependingonwhetherthe individual ownsa degree,sothe worthof owningadegree variesdependingonlocation. Sloane,PJ.O’Leary,NC.(2004) “The Returnto a UniversityEducationinGreatBritain” Sloane,PJ.O’Leary,NC.(2005) ”The ChangingWage Returnto an Undergraduate Education” Sloane,PJ.O’Leary,NC.(2006) ”Ratesof Returnsto DegreesacrossBritishRegions” Walker,I.AndZhu, Y. (2003) "Education,EarningsandProductivity:RecentUKEvidence",LabourMarket Trends,March, pp. 145-152. GreenawayD.and HaynesM.(2003) "FundingHigherEducationinthe UK: The Role of FeesandLoans", EconomicJournal,vol.113, pp.F150-F166