
Empfohlen
Weitere ähnliche Inhalte
Was ist angesagt?
Was ist angesagt? (20)
Andere mochten auch
Andere mochten auch (14)
Ähnlich wie Copenhagen
Ähnlich wie Copenhagen (20)
Copenhagen
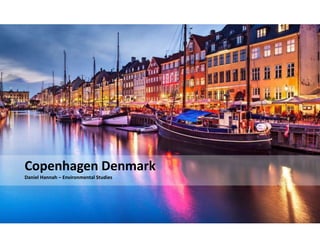
- 1. Copenhagen Denmark Daniel Hannah – Environmental Studies
- 2. Population: 2,000,000 Land: 2,770 square km Density: 722 per square km
- 4. Statistics Overall CO2 Energy Buildings Transport Water Waste and Land use Air Quality Copenhagen 8.35 (4) 8.69 (2) 9.17 (4) 8.29 (3) 8.88 (5) 8.05 (7) 8.43 (5) Stockholm 8.99 7.61 9.44 8.81 7.14 8.05 9.35 Oslo 9.58 8.71 9.22 7.92 6.85 8.23 7.00 Vienna 7.53 6.92 8.62 8.00 9.13 8.60 7.59 Amsterdam 7.10 7.08 9.01 8.44 9.21 8.98 7.48 Zurich 8.48 6.92 8.43 7.83 8.88 8.82 7.70 Helsinki 7.30 4.49 9.11 7.08 7.92 8.69 8.84 • According to the European Green city index, Copenhagen scored first out of all cities in Europe for it’s overall performance. • Strong correlation between wealth and overall ranking Findings discovered from the European Green City Index
- 5. Urban Rights The municipality has been in talks with an architectural firm to transform the area around Nørrebro Station, where a common complaint has been that the overhead railways only serves to separate the district from the rest of Copenhagen. The intention is to transform the area – including the premises below the overhead railway - into more open spaces, squares and shops. The Nørrebro district, - pejoratively referred to among some Danes as "NørreBronx" - contains a number of areas designated as ghettos, with high crime rates and low unemployment. • Adds public spaces • Adds parks and recreational areas • Installs markets, shopping and commerce • Creates a new central hub out of an old run down neighbourhood
- 6. Urban Mobility Copenhagen mobility • Many cycling paths • Per 1 square km of land, there is an average of 4km of bicycle paths • One of the most bicycle friendly cities in the world • 40% of Copenhageners ride their bikes to work/school • Better infrastructure and bike lanes over the years Metro • Clean • Reliable • Efficient and utilized metro system • Flexible • Inexpensive • 24 hour service every day • 2 – 4 minute arrivals during rush-hour 3 – 6 minute arrivals outside of rush 7 – 15 minute after midnight
- 7. Zone System Copenhagen’s public transit system is divided into concentric zones beginning with Zone 1 in the centre of the city and continuing up to Zone 10 in the outlying areas. Above Zone 2, the system is subdivided into sectors much like a dart-board. The cost of transport is based on the number of zones through which you travel. Like many things in Denmark, public transportation can be quite expensive. However, there are many ways to reduce costs and the system is quite flexible, allowing you to use all forms of public transit (buses, metro, S- and regional trains) on the same ticket. Honor System If you are expecting to have to pass through turnstiles or other barriers to enter the public transit system, you may be surprised. The entire system is completely open and it is up to you to ensure that you have the appropriate ticket, klippekort or pass corresponding with the zone(s) you are travelling in. Traffic is the biggest challenge. The number of private cars is growing, and this means higher CO2 emissions and more air pollution. Today, traffic is responsible for 20% of the city’s carbon emissions.
- 8. Urban Metabolism The mayor of Copenhagen wants to be the first capital city in the world to be completely carbon neutral, by 2025. Already by 2015 , they have a 20% reduction in emissions. benchmark of 50% was set for the amount of waste cities should aim to recycle, which is in line with the EU’s 2020 target for recycling waste. accounting for 17% of total energy consumption in 2008 and for 27% of electricity consumption. Initiative: The national government’s climate change strategy aims to raise the share of renewable energy to 30% of total consumption by 2025. Waste Management Copenhagen has become an exemplary C40 city (a group of the world’s largest cities committed to tackling climate change) in its work to fight climate change. emissions per head: 5.38 tonnes Energy consumption per head: 80.63 gigajoules* Percentage of renewable energy consumed by the city: 18.76 % Total percentage of citizens walking, cycling or taking public transport to work: 68 % Annual water consumption per head: 147 m3 Share of waste recycled: 23.61 % The Copenhagen municipality aims to achieve 10% of its CO2 reductions through construction and renovation projects. The municipality intends to upgrade all municipal buildings to ensure compliance with the highest energy-efficiency standards. The annual energy consumption of residential buildings, at 554 megajoules per square metre, is the lowest of the 30 cities in the survey, being marginally better than that of Berlin.
- 9. Waste-to-energy plant with multiple purposes Copenhagen’s state of the art plant sets new standards for environmental performance, energy production and waste treatment. Innovative technology and architecture integrate to form anew future of waste management and recycling In year 2017, Copenhageners and visitors will witness a waste-to-energy plant that is not only one of the best performing European plants in terms of energy efficiency, waste treatment capacity, and environmental consideration, but also in terms of visual rendition and local acceptance. the best-scoring cities in waste management. Copenhagen claimed joint top spot for water system leakages, wastewater treatment and water efficiency. Initiative: The municipality reduced household water consumption from 114 litres per person per day in 2007 to 100 litres per person in 2012. The city council spends around Dkr2 million (€270,000) each year on water-saving initiatives.
- 10. • By 2017 Amager Resource centre will run a plant that burns 2 x 35 tonnes of waste per hour. • Treat around 400,000 tonnes of waste annually produced by 500,000 – 700,000 inhabitants and at least 46,000 companies. • Supply a minimum of 50,000 households with electricity and 120,000 households with district heating. • Have steam data at 440 degrees and 70 bars which doubles the electrical efficiency compared to the former plant. • The plants architecture includes roof wide artificial ski sloped which are open to public. • utilizes more than 100% of the fuel’s energy content, has a 28% electrical efficiency rate, reduces sulphur emissions by 99.5%, and minimizes NOx emissions to a tenth 400 000 tones of waste a year • 99% energy efficiency • District heating for 160 000 houses • Electricity for 62 500 houses • 100 million litres of spare water recovered through flue gas condensation • 90% reuse of metals = 10 000 tones of metal a year • 100 000 tones of bottom ash reused for road material
- 11. CO2 emissions: Copenhagen is ranked fourth for carbon dioxide (CO2) emissions, thanks to good scores in the CO2 intensity and CO2 reduction strategy subcategories. The city’s primary fuel sources are coal, oil and natural gas. A drive to improve energy efficiency has contributed to a significant fall in emissions over the past decade or so. The city now produces about 5.4 tonnes of CO2 emissions per head per year, slightly above the index average. A large proportion of the city’s carbon emissions is generated by Copenhageners themselves. Campaigns are in place to motivate their lifestyle changes. Public involvement is in place to involve the citizens in developing solutions to the problems Waste and land use • Copenhagen ranks seventh for waste and land use. However, the city is placed joint first for its green land use policies • widespread availability of green spaces (almost 80% of residents in the municipality of Copenhagen live within 300 metres of a park or recreation area). • 55% of all waste is recycled, although the proportion for household waste is lower, at 24%. Initiative: • The municipality actively seeks to use urban development as a tool to minimise transport requirements and energy consumption. • Copenhagen is ranked fifth for air quality, with a score that is broadly similar to those of several other north European cities. • The great bulk of air pollutants measured in Copenhagen come from traffic. • Copenhagen is ranked joint first for environmental governance. The municipality has recently taken steps to ensure integrated environmental management across all of its departments
- 12. City as habitat • Copenhagen is ranked fourth in the buildings category. • Danish buildings are among the most energy-efficient in the world, despite the ageing housing stock. • Almost all buildings in the Danish capital are connected to the district heating system. Initiative: • 97% of the residents of Copenhagen have heating • Clean and fresh water for drinking and swimming Green living - Bicycle Culture - Strategies and policies - Sustainable projects - Wind energy - Parks - Public spaces Lifestyle - Architecture - Design - Fashion - Film - Food and drunk - Literature - Music - Sport Culture - Markets - History - Urban design - Nightlife In Copenhagen, the water in the harbour is so clean that you can even swim in it.
- 13. History Copenhagen has a strong culture around it’s history and ancestry. Being a Nordic city and established in 1167, Copenhagen has a lot of history and is preserved very well. This is a major point of tourism and travel and adds diversity amongst the modern buildings and infrastructure. Even though the history spans nearly a millennium, it is well preserved and in good shape, renovated and modernized to create more appeal and usage. Bicycle Culture With one of the worlds leading Bicycle culture, Copenhagen is a very pedestrian friendly and accessible city. This results in lower carbon emissions, greener spaces and more infrastructure for bikes and accessibility by foot. Arts, Dance, festivals, Markets Copenhagen has a very alive and diverse nightlife with many types of shows, dances, festivals for many occasions and parties. This means there is always something to do in the city and keeps the residents happy and occupied. Copenhagen is also known to have some of the best markets in Scandinavia and is a large part of their culture C U L T U R E