Region vc non-tech
•
0 gefällt mir•124 views

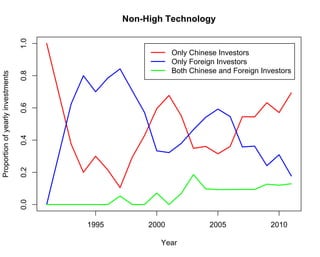
This chart shows the proportion of yearly investments from only Chinese investors, only foreign investors, and both Chinese and foreign investors in non-high technology industries in China from 1995 to 2010. It reveals that investments from only Chinese investors have consistently been the highest proportion each year, while investments from only foreign investors have been the lowest proportion each year. Investments from both Chinese and foreign investors fell between those two categories each year.

Empfohlen
Weitere ähnliche Inhalte
Mehr von Dan Wang
Mehr von Dan Wang (14)
Kürzlich hochgeladen
Kürzlich hochgeladen (20)
Region vc non-tech
- 1. 1.0 Non-High Technology Only Chinese Investors Only Foreign Investors Both Chinese and Foreign Investors Proportion of yearly investments 0.8 0.6 0.4 0.2 0.0 1995 2000 2005 2010 Year