Boyle County, KY Employment Census: Q1, 2013
•
1 gefällt mir•1,509 views

This is the quarterly employment census for an index of employers in Boyle County, Kentucky, compiled by the Boyle County Industrial Foundation and reported by the Danville-Boyle County Economic Development Partnership.

Empfohlen
Empfohlen
Weitere ähnliche Inhalte
Mehr von Danville-Boyle County Economic Development Partnership
Mehr von Danville-Boyle County Economic Development Partnership (20)
Kürzlich hochgeladen
Kürzlich hochgeladen (20)
Boyle County, KY Employment Census: Q1, 2013
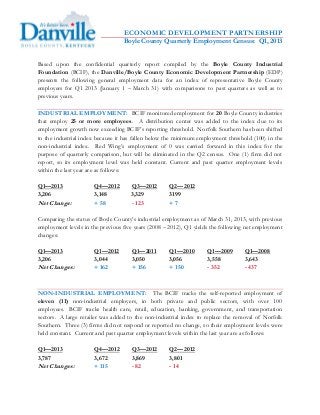
- 1. ECONOMIC DEVELOPMENT PARTNERSHIP Boyle County Quarterly Employment Census: Q1, 2013 Based upon the confidential quarterly report compiled by the Boyle County Industrial Foundation (BCIF), the Danville/Boyle County Economic Development Partnership (EDP) presents the following general employment data for an index of representative Boyle County employers for Q1 2013 (January 1 – March 31) with comparisons to past quarters as well as to previous years. INDUSTRIAL EMPLOYMENT: BCIF monitored employment for 20 Boyle County industries that employ 25 or more employees. A distribution center was added to the index due to its employment growth now exceeding BCIF’s reporting threshold. Norfolk Southern has been shifted to the industrial index because it has fallen below the minimum employment threshold (100) in the non-industrial index. Red Wing’s employment of 0 was carried forward in this index for the purpose of quarterly comparison, but will be eliminated in the Q2 census. One (1) firm did not report, so its employment level was held constant. Current and past quarter employment levels within the last year are as follows: Q1—2013 Q4—2012 Q3—2012 Q2—2012 3,206 3,148 3,329 3199 Net Change: + 58 - 123 + 7 Comparing the status of Boyle County’s industrial employment as of March 31, 2013, with previous employment levels in the previous five years (2008 – 2012), Q1 yields the following net employment changes: Q1—2013 Q1—2012 Q1—2011 Q1—2010 Q1—2009 Q1—2008 3,206 3,044 3,050 3,056 3,558 3,643 Net Changes: + 162 + 156 + 150 - 352 - 437 NON-INDUSTRIAL EMPLOYMENT: The BCIF tracks the self-reported employment of eleven (11) non-industrial employers, in both private and public sectors, with over 100 employees. BCIF tracks health care, retail, education, banking, government, and transportation sectors. A large retailer was added to the non-industrial index to replace the removal of Norfolk Southern. Three (3) firms did not respond or reported no change, so their employment levels were held constant. Current and past quarter employment levels within the last year are as follows: Q1—2013 Q4—2012 Q3—2012 Q2—2012 3,787 3,672 3,869 3,801 Net Changes: + 115 - 82 - 14
- 2. Boyle County Quarterly Employment Census: Q1, 2013 Page 2 Comparing the status of Boyle County’s non-industrial employment as of March 31, 2013, with previous employment levels in three (3) previous years, Q1 yields the following net employment changes: Q1—2013 Q1—2012 Q1—2011 Q1—2010 3,787 3,842 3,806 4,161 Net Changes: - 55 - 19 - 374 TOTAL OVERALL EMPLOYMENT: In light of the above statistics, total employment for Boyle County in Q1 2013 with previous quarter and a 2-year comparison is as follows: Q1—2013 Q4—2012 Q1—2012 Q1—2011 Q1—2010 6,993 6,820 6,886 6,856 7,217 Net Changes: + 173 + 107 + 137 - 224 OVERALL LABOR FORCE STATISTICS: For all sectors of the Boyle County economy, the Kentucky Office of Employment & Training reports the following data for Boyle Countians in the most recent quarters available: Mar ’13 Dec ’12 Change Employed 11,195 11,313 - 118 Unemployed 1,228 1,169 + 59 Unemployment Rate 9.9% 9.4% + 0.5% An annual comparison of unemployment rates reveals the following: Mar ’13 Mar ‘12 Change Unemployment Rate 9.9% 9.9% 0.0% Please contact the EDP if you have any questions or have any suggestions about how this quarterly report can be more meaningful to you, your organization, or agency. JODY A. LASSITER, JD President/CEO Danville-Boyle County Economic Development Partnership Boyle County Industrial Foundation 304 South Fourth Street, Suite 201 | Danville, Kentucky 40422 Office: (859) 236-2805 | Mobile: (859) 319-8068 | jody@betterindanville.com Website | Facebook | Blog | Twitter | LinkedIn | YouTube | Slideshare