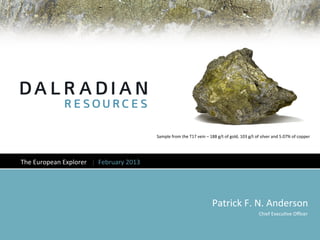
1. Sample
from
the
T17
vein
–
188
g/t
of
gold,
103
g/t
of
silver
and
5.07%
of
copper
The
European
Explorer
│
February
2013
Patrick
F.
N.
Anderson
Chief
Execu8ve
Officer
2. Forward-‐Looking
Statement
&
Qualified
Persons
This
presenta8on
contains
“forward‑looking
informa8on”
which
may
include,
but
is
not
limited
to,
statements
with
respect
to
the
comple8on
of
the
acquisi8on
(the
“Acquisi8on”)
by
the
Company
from
a
group
of
private
vendors
of
approximately
1.7
million
hectares
of
mineral
rights
over
four
greenstone
belts
and
a
historic
silver
mining
camp
in
Norway,
future
financial
or
opera8ng
performance
of
the
Company
and
its
mineral
projects,
the
future
price
of
metals,
the
es8ma8on
of
mineral
resources,
the
realiza8on
of
mineral
resource
es8mates,
the
8ming
and
amount
of
es8mated
future
produc8on,
costs
of
produc8on,
capital,
opera8ng
and
explora8on
expenditures,
costs
and
8ming
of
the
development
of
new
deposits,
costs
and
8ming
of
future
explora8on,
requirements
for
addi8onal
capital,
government
regula8on
of
mining
opera8ons,
environmental
risks,
reclama8on
expenses,
8tle
disputes
or
claims
and
limita8ons
of
insurance
coverage.
OYen,
but
not
always,
forward‑looking
statements
can
be
iden8fied
by
the
use
of
words
and
phrases
such
as
“plans,”
“expects,”
“is
expected,”
“budget,”
“scheduled,”
“es8mates,”
“forecasts,”
“intends,”
“an8cipates,”
or
“believes”
or
varia8ons
(including
nega8ve
varia8ons)
of
such
words
and
phrases,
or
state
that
certain
ac8ons,
events
or
results
“may,”
“could,”
“would,”
“might”
or
“will”
be
taken,
occur
or
be
achieved.
Forward-‐looking
statements
are
based
on
the
opinions
and
es8mates
of
management
as
of
the
date
such
statements
are
made
and
are
based
on
various
assump8ons,
such
as
approvals
from
the
Toronto
Stock
Exchange
and
the
Norwegian
Directorate
of
Mining
will
be
obtained
in
respect
of
the
Acquisi8on,
the
con8nued
poli8cal
stability
in
Northern
Ireland
and
Norway,
that
permits
required
for
the
Company’s
opera8ons
will
be
obtained
in
a
8mely
basis
in
order
to
permit
the
Company
to
proceed
on
schedule
with
its
planned
drilling
programs,
that
skilled
personnel
and
contractors
will
be
available
as
the
Company’s
opera8ons
con8nue
to
grow,
that
the
price
of
gold
will
be
at
levels
that
render
the
project
economic,
or
that
the
Company
will
be
able
to
con8nue
raising
the
necessary
capital
to
finance
its
opera8ons
and
realize
on
mineral
resource
es8mates,
and
that
the
assump8ons
contained
in
the
Preliminary
Economic
Assessment
rela8ng
to
the
Curraghinalt
Deposit
are
accurate
and
complete.
Forward‑looking
statements
involve
known
and
unknown
risks,
uncertain8es
and
other
factors
which
may
cause
the
actual
results,
performance
or
achievements
of
the
Company
to
be
materially
different
from
any
future
results,
performance
or
achievements
expressed
or
implied
by
the
forward‑looking
statements.
Such
factors
include,
among
others,
general
business,
economic,
compe88ve,
poli8cal
and
social
uncertain8es;
the
actual
results
of
current
and
future
explora8on
ac8vi8es;
actual
results
of
reclama8on
ac8vi8es;
conclusions
of
economic
evalua8ons;
changes
in
project
parameters
and/or
economic
assessments
as
plans
con8nue
to
be
refined;
future
prices
of
metals;
possible
varia8ons
of
mineral
grade
or
recovery
rates;
the
risk
that
actual
costs
may
excel
es8mated
costs;
failure
of
plant,
equipment
or
processes
to
operate
as
an8cipated;
accidents,
labour
disputes
and
other
risks
of
the
mining
industry;
poli8cal
instability;
delays
in
obtaining
governmental
approvals
or
financing
or
in
the
comple8on
of
development
or
construc8on
ac8vi8es,
as
well
as
those
factors
discussed
in
the
sec8on
en8tled
“Risk
Factors”
in
the
Company’s
Annual
Informa8on
Form.
Although
the
Company
has
abempted
to
iden8fy
important
factors
that
could
cause
actual
ac8ons,
events
or
results
to
differ
materially
from
those
described
in
forward‑looking
statements,
there
may
be
other
factors
that
cause
ac8ons,
events
or
results
to
differ
from
those
an8cipated,
es8mated
or
intended.
Forward‑looking
statements
contained
herein
are
made
as
of
the
date
of
this
presenta8on
and
the
Company
disclaims
any
obliga8on
to
update
any
forward‑looking
statements,
whether
as
a
result
of
new
informa8on,
future
events
or
results,
except
as
may
be
required
by
applicable
securi8es
laws.
There
can
be
no
assurance
that
forward‑looking
statements
will
prove
to
be
accurate,
as
actual
results
and
future
events
could
differ
materially
from
those
an8cipated
in
such
statements.
Accordingly,
readers
should
not
place
undue
reliance
on
forward‑looking
statements.
Some
technical
data
in
this
presenta8on
was
taken
from
the
technical
report
en8tled
“An
Updated
Mineral
Resource
Es8mate
for
the
Curraghinalt
Gold
Deposit,
Tyrone
Project,
County
Tyrone
and
County
Londonderry,
Northern
Ireland
dated
January
10,
2012,
prepared
by
B.
Terrence
Hennessey,
P.Geo.,
and
Dibya
Kan8
Mukhopadhyay,
M.Sc.,
MAusIMM,
of
Micon
Interna8onal
Limited
(the
Technical
Report ).
Michele
L.
Cote,
MSc.,
P.
Geo.,
Dalradian
Resources,
is
the
Qualified
Person
who
supervised
the
prepara8on
of
the
explora8on
technical
data
for
in
this
presenta8on.
The
technical
informa8on
contained
in
this
news
release
is
based
upon
informa8on
prepared
by
Messrs.
Hennessey,
Jacobs,
Villeneuve,
Damjanović
and
Foo
of
Micon
Interna8onal
Ltd.,
who
are
each
a
Qualified
Person
as
defined
by
NI
43-‐101.
Messrs.
Hennessey,
Jacobs,
Villeneuve,
Damjanović
and
Foo
are
independent
of
Dalradian
as
defined
by
NI
43-‐101.
2
3. Capital
Structure
TSX,
OTCQX:
DNA,
DRLDF
STOCK
PRICE
Shares
outstanding:
89.5
million
$1.33
Fully
diluted
:
97.5
million
January 29, 2013
(January
17,
2013)
$24.00
Market
cap:
$119.1
million
$2.00
(January
29,
2013)
DNA
$22.00
Average
volume:
62,039
(30
day)
$1.50
$20.00
Aug
2010
IPO
@
$1.50
$39.1
million
Feb
2012
Financing
@
$2.00
$27.8
million
$18.00
Insider
ownership:
6%
$1.00
(approximate)
$16.00
Cash
balance:
$28.9
million
(as
at
September
30,
2012)
$14.00
$0.50
BMO
Junior
Gold
Index
ETF
$12.00
John
Hayes
$0.00
$10.00
Analyst
coverage:
Dec
2011
Dec
2012
Jan
2012
Jun
2012
Jul
2012
Feb
2012
Mar
2012
Aug
2012
Sep
2012
Jan
2013
Apr
2012
Nov
2012
Oct
2012
May
2012
Jamie
Sprab
Craig
Stanley
All
dollars
quoted
in
$
CAD
3
4. The
Board:
A
Track
Record
of
Discovery
and
Development
PATRICK
F.
N.
ANDERSON
KEITH
D.
MCKAY
CHIEF
EXECUTIVE
OFFICER
CHIEF
FINANCIAL
OFFICER
Former
CEO
of
Aurelian
Resources
Former
CFO
of
Aurelian
Resources
Also
Director
of
Connental
Gold
COLIN
K.
BENNER
THOMAS
J.
OBRADOVICH
CHAIRMAN
OF
DELTA
MINERALS
AND
AURICO
GOLD
CHAIRMAN
Also
Director
of
Mercator
Minerals,
Lundin
Mining,
Chairman
of
Lago
Dourado
Minerals
Former
CEO
of
Young-‐Davidson
Mines
Former
Director
of
Aurelian
Resources
JOSEPH
F.
CONWAY
SEAN
E.
O.
ROOSEN
CEO
OF
PRIMERO
MINING
CORP.
CEO
OF
OSISKO
MINING
CORPORATION
Former
CEO
of
IAMGOLD
Also
Director
of
Astur
Gold
RONALD
P.
GAGEL
ARI
B.
SUSSMAN
Former
SVP
and
CFO
of
FNX
Mining
CEO
OF
CONTINENTAL
GOLD
LIMITED
4
5. Targeng
High-‐Grade
Deposits
in
Low
Risk
Jurisdicons
NORTHERN
IRELAND
§ Posi8ve
PEA
§ High-‐grade
2.7M
ounce
gold
resource
(all
categories)1
Norway
− Measured:
0.02
MT
grading
21.51
g/t
Au
for
10,000
contained
ounces
− Indicated:
1.11
MT
grading
12.84
g/t
Au
for
460,000
contained
ounces
− Inferred:
5.45
MT
grading
12.74
g/t
Au
for
Northern
2.23
million
contained
ounces
Ireland
§ Ac8ve
drilling
&
explora8on
NORWAY
§ 1.3
M
hectares
of
explora8on
permits
§ Over
15
precious
metals
targets
iden8fied
in
2012
season
1
Refer
to
press
release
dated
Nov.
30,
2011
en8tled
“Dalradian
Announces
Resource
Increase
at
Curraghinalt”
at
www.dalradian.com
5
6. Northern
Ireland
§ Our
flagship
asset:
Curraghinalt
mesothermal
Gold
high-‐grade
gold
deposit
Base
Metals
Salt
Mine
§ Excellent
regional
infrastructure
Scotgold
§ Over
84,000
hectares
under
license
Permibed
in
2012
§ Recent
discoveries
demonstrate
untapped
Underground
Cononish
poten8al
Conroy
Salt
Mine
+1M
ounce
resource
NORTHERN
Curraghinalt
IRELAND
Galantas
Gold
Curraghinalt
Lonmin
Permibed
in
2007
Cavanacaw
Clonbret
Boliden
In
produc8on
Croagh
Patrick
Irish
Salt
Tara
Parys
Mountain
Mining
Vedanta
Resources
In
produc8on
Galmoy
Avoca
Gor8n
Silvermines
Gwynfynydd
Pallas
Green
Lisheen
Cavanacaw
Galantas
Omagh
BELFAST
IMC
Discovery
Gold
Allihies
Copper
354
g/t
gold
over
1.5m
Mines
Conroy
Lundin
Diamonds
&
Gold
Xstrata
In
produc8on
PFS
South
Cro_y
6
7. Acve
Resource
Industry
Curraghinalt
Logging
at
Gor8n
Glen
Forest
Park
Curraghinalt
Adit
Construc8on
Curraghinalt
Gorn
DG3
Alwories
Quarry
0 1 2
kilometres
Greencastle
Quarry
7
8. Curraghinalt
2012
2012
Q1
Q2
Q3
Q4
JAN
FEB
MAR
APR
MAY
JUN
JUL
AUG
SEP
OCT
NOV
DEC
Posive
PEA
Curraghinalt
Drilling:
More
Alwories
Intercepts:
Alwories
discovery
$28.2
million
bought
• 3.35m
@
13.80
g/t
Au
Completes
airborne
1.47m
@
23.62
g/t
Au
• 1.22m
@
25.14
g/t
Au
deal
financing
• 3.75m
@
10.43
g/t
Au
geophysical
survey
2.22m
@
14.07
g/t
Au
• 1.28m
@
30.58
g/t
Au
announced
• 1.48m
@
22.83
g/t
Au
Water
discharge
C-‐veins
show
wall
Curraghinalt
Drilling:
permit
in
hand
Micon
appointed
as
rock
carry
gold
• 2.34m
@
47.94
g/t
Au
lead
consultant
for
PEA
• 3.97m
@
38.00
g/t
Au
Soil
geochem
grid
43-‐101
Technical
iden8fies
new
targets
Report
filed
Curraghinalt
Drilling:
• 1.7m
@
17.55
g/t
Au
2013
• 2.47m
@
18.99
g/t
Au
Q1
JAN
FEB
2013
Explora8on
Program
Announced
Fallagh
Prospect
announced
with
float
samples
of:
• 30.30
g/t
Au
• 29.20
g/t
Au
12. 2012
Drill
Program
Highlights
A
Growing
Resource
12
Approximately
26,000
metres
drilled
since
last
resource
update
13. C
Veins
–
Potenal
to
Expand
the
Resource
§ Assembled
80
km
of
historic
core
in
a
modern
facility
§ Most
was
found
unsampled
§ Iden8fied
a
mineralized
oblique
vein
set
Dalradian
Gold
Omagh,
13 Core
Facility
13
14. § Evalua8ng
the
poten8al
contribu8on
to
the
resource
at
Curraghinalt
‘Resource’
or
‘D’
Vein
Newly
idenfied
‘C’
Vein
Plan
View
Looking
North
14 600
m
hole
yielded
over
1000
veinlets
14
15. Not
a
Trend
but
a
District
GLACIATED
TERRAIN
WITH
MINIMAL
OUTCROP
Golan
Burn
Outcropping
veins
including
60cm
@
61.43
g/t
Au
Ajagh
Burn
2.47m
@
18.99
g/t
Au
8
km
Curraghinalt
400
m
Step-‐out
Alwories
Discovery
Holes
Deposit
3.2m
@
5.34
g/t
Au
1.47m
@
23.6
g/t
Au
2.22m
@
14.1
g/t
Au
Curraghinalt
4.72m
@
14.82
g/t
Au
Trend
Scotch
Town
Peak
of
10.52
g/t
Au
In
mineralized
boulders
“Fallagh”
New
Au
Prospect
1700
30.30
g/t
Au,
m
29.20
g/t
Au
&
Curraghinalt
Deposit
17.25
g/t
Au
in
Float
Resource
as
at
Nov
2011
–
Measured:
0.01
Moz
Au
(0.02MT
@
21.51
g/t)
Indicated:
0.46
Moz
Au
Curraghinalt
Trend
(1.11MT
@
12.84
g/t)
Veins
in
Current
Resource Alwories
Inferred:
2.23
Moz
Au
1.88
m
@
20.8
g/t
Au
in
Interpreted
Veins
Historic
Findings
(5.45
MT
@
12.74
g/t)
vein
in
quarry
Intercept
in
hole
11-‐CT-‐99
projected
up
dip
to
170m
mSL
15
16. Exploraon
Summary
§ In
the
last
2
years…
– >4-‐fold
increase
in
contained
ounces
– Implemented
a
modern
explora8on
organiza8on
§ Deposit
is
open
in
all
direc8ons
§ Successfully
mapping
high
grade
shoots
§ “C”
veinlet
swarms,
a
game
changer…
– Reduce
dilu8on
– Stand-‐alone
ounces?
– Poten8al
for
alterna8ve
mining
methods
§ Big
trend
&
excellent
explora8on
tools
§ Clear
strategy,
competent
team
16
17. Preliminary
Economic
Assessment
3
YEAR
TRAILING
5
YEAR
TRAILING
KEY
PEA
DATA*
AVERAGE
GOLD
PRICE:
AVERAGE
GOLD
PRICE:
NPV
with
8%
discount
rate
(AYer-‐tax)
$467
million
$331
million
IRR
(AYer-‐tax)
41.9%
33.4%
Average
Annual
Produc8on
145,000
ounces/year
Processing
Rate
1,700
tonnes/day
Life
of
Mine
15
years
Ini8al
Capex
($38M
con8ngency)
$192
million
Cash
Costs
$532/ounce
or
$125/tonne
Diluted
Grade
8.1
g/t
Au
Gold
Recovery
92%
PEA
results
released
on
July
25,
2012.
The
PEA
is
preliminary
in
nature.
It
includes
inferred
mineral
resources
that
are
considered
too
specula8ve
geologically
to
have
the
economic
considera8ons
applied
to
them
that
would
enable
them
to
be
categorized
as
mineral
reserves.
There
is
no
certainty
that
the
results
of
the
PEA
will
be
realized.
*
Prepared
by
Micon
Interna8onal
Limited
All
dollars
quoted
in
$
USD
unless
stated
otherwise
17
17
18. Underground
Exploraon
Development
GETTING
BACK
UNDERGROUND
§ 2,000
metres
planned
§ Bulk
sample
for
metallurgical
test
work
§ Prove
up
vein
con8nuity
§ Convert
ounces
to
Measured
&
Indicated
§ Demonstrate
mining
method
works
PERMITTING
§ Working
with
government
to
op8mize
the
permi|ng
process
§ Pre
consulta8on
permi|ng
discussions
with
10+
agencies
§ Formal
submission
of
applica8on
for
underground
explora8on
development
18
20. Norway:
“Let
the
Treasure
Hunt
Begin”
Industry
Minister,
Trond
Giske
at
Press
conference
announcing
new
direc8on
in
mineral
strategy
for
Norway
(Oct.
2010)
20
21. Land
Posion
NORTHERN
NORWAY
Greenstone
Belts
Volcanic
Belts
NORWAY
&
Metasediments
SWEDEN
FINLAND
Bidjovagge
RUSSIA
Pechenga
Pasvik
Karasjok RUSSIA
Kautokeino
Saka|lampi
Ki|lä
SOUTHERN
NORWAY
Rombak
Kongsberg
FINLAND
SWEDEN
Oslo
Northern
Norway
§ Four
concessions
over
three
greenstone
belts
and
a
basement
window
Southern
Norway
§ Kongsberg
concession
hos8ng
an
historic
silver
mining
district
22. 2012
Exploraon
Norway
Kautokeino
§ Largest
of
3
greenstone
belts
§ 10
gold-‐in-‐+ll
anomalies
iden+fied
§ 2,476
8ll
samples
collected
§ 48
rock
samples
collected
§ Completed
8ll
orienta8on
survey
around
former
producing
gold
mine,
Bidjovagge
Explora8on
Team
Norway
Kongsberg
§ Historic
silver
mining
district
with
produc8on
of
40+
million
ounces
with
average
grades
of
356
g/t
silver
§ Five
silver
targets
iden+fied
§ 462
stream
sediment
samples
completed
§ 156
rock
samples
completed,
including:
– 278
g/t
of
silver
with
0.28%
zinc
– 61
g/t
of
silver
with
21.60%
zinc
Historical
Workings
in
the
Kongsberg
– 109
g/t
of
silver
with
16.20%
zinc
22
23. 2013
Exploraon
Timeline
2013
Q1
Q2
Q3
Q4
JAN
FEB
MAR
APR
MAY
JUN
JUL
AUG
SEP
OCT
NOV
DEC
2013
Field
Planning
Stakeholder
Consultaons
Kongsberg:
Regional
stream
sediment
sampling
Kongsberg:
Follow-‐up
of
5
stream
sediment
silver
targets
&
exisng
silver
workings
Kautokeino:
Detailed
follow-‐up
of
10
gold-‐in-‐ll
dispersions
Northern
Permits:
Regional
ll
&
stream
sediment
sampling
§ 2013
Explora8on
Program
will
incorporate
– Detailed
follow-‐up
on
15
precious
metals
targets
– Sampling,
prospec8ng
&
geophysics
– Detailed
follow-‐up
of
historical
showings
in
Kongsberg
&
Rombak
23
24. Moving
Ahead
NORTHERN
IRELAND
Advanced
Exploraon
§ Grow
Exis8ng
Resource
EXPLORATION
§ Realize
poten8al
of
district
§ Explore
Along
Strike
from
Curraghinalt
§ Explore
Regional
Targets
for
New
Discovery
Underground
Development
§ Explora8on
development
DEVELOPMENT
planning
applica8on
being
prepared
for
submission
NORWAY
Greenfields
Exploraon
EXPLORATION
§ Extensive
program
to
iden8fy
priority
explora8on
targets
24
25. The European Explorer
Patrick F. N. Anderson
Chief Executive Officer
Investor Relations
Shae-Lynn Mathers
Director, Investor Relations
smathers@dalradian.com
416.583.5622
Trading Symbol:
DNA on TSX
Executive Office:
Dalradian Resources Inc.
155 Wellington Street West
Suite 2920
Toronto, Ontario
Canada M5V 3H1
www.dalradian.com
25
26. Curraghinalt
NI
43-‐101
Technical
Report
Prepared
by
Micon
Internaonal
Limited
§ Dated
January
10,
2012
§ Updated
from
May
10,
2010
and
reflects
revised
gold
price
Curraghinalt Mesothermal Gold Deposit
Measured
0.02 MT @ 21.51 g/t Au for 0.01 million contained ounces
Indicated
1.11 MT @ 12.84 g/t Au for 0.46 million contained ounces
Inferred
5.45 MT @ 12.74 g/t Au for 2.23 million contained ounces
Notes:
§ Combined royalties of 6%
§ Assumes US$900/oz and an economic cut-off grade of 5 g/t Au over a minimum thickness of 0.10 metres, diluted to 1 metre at 0 grade
§ Using a cut-off grade of 5 g/t
§ All veins less than 10 cm were excluded
§ Width or vein thickness is measured at 90 degrees to the vertical
§ "Vein thickness" refers to a zone of grade and may not be 100 per cent vein material
§ Please see "A Mineral Estimate for The Curraghinalt Gold Deposit, Tyrone Project, County Tyrone and County Londonderry, Northern Ireland” dated January 10,
2012 and available at www.dalradian.com
26
27. Exploraon
Tools
CURRAGHINALT
TREND
2012
Geophysics
High Resolution Aeromagnetic
Image flown over Curraghinalt
Trend – April 2012
2012
Geochem
Historical Geochem with Extended
2012 Soil Survey
Curraghinalt
Trend
Glaciated terrain with minimal outcrop
27
28. Curraghinalt:
A
Growing
Resource
CURRAGHINALT
RESOURCE
ESTIMATE
§ 1986-‐1987
resources
es8mates
are
historical
non
43-‐101
compliant
resources
Millions
of
Ounces
Metres
Drilled
§ 2003
to
2011
resource
es8mates
are
reported
43-‐101
compliant
3.0
50,000
2.5
40,000
2.0
30,000
1.5
20,000
1.0
10,000
0.5
0.0
0
2007
2011
DNA
2012
DNA
(Pre-‐DNA)
Year
1
Year
2
27
years
of
work
2
years
of
work
Images presented for illustrative purposes only 28
29. PEA:
Mining
Longhole
Mining
with
Ramp
Access
&
Truck
Haulage:
§ Local
availability
of
experienced
longhole
miners
§ More
dilu8ve
than
cut
and
fill
but
less
expensive
and
easier
to
manage
§ Cost
trade-‐off
not
material
§ 1.8
metres
mined
width
(80%
dilu8on
on
resource)
§ 20
metre
sub
level
spacing
§ Less
than
10
working
faces
at
any
one
8me
Longhole
Mining
at
Bulyanhulu
Gold
Mine
PRODUCTION
RATE
MINING
COST
PROJECT
(TPD)
(US$/T
MILLED)
COMMENTS
Curraghinalt
1,700
$76.50
(US$/t
mined)
(Dalradian,
N.
Ireland)
1.8
m
stope
widths
(planned)
(PEA
es8mate)
Bulyanhulu
(African
Barrick,
Tanzania)
3,300
$156.00
Narrow,
steeply-‐dipping
veins
Daisy
Milano
(Silver
Lake
Resources,
W.
540
Cash
Costs
of
$660/oz
Stope
widths
down
to
1
m
Australia)
Lawlers
$30.06
(Barrick,
Australia)
2,200
Shallow
dipping
veins,
2-‐6
m
thick
29 (2003)
29
29
30. PEA:
Processing
Opons
Examined:
Preferred
opon:
§ Grinding
–
Whole
Ore
Leach
§ Crushing,
grinding,
whole
ore
cyanida8on
and
conven8onal
tailings
disposal
§ Grinding
–
Gravity
–
Flota8on
of
Gravity
Tails
–
CN
of
Flota8on
Concentrate
§ 92%
gold
recovery
§ Grinding
–
Gravity
–
Flota8on
–
Sale
of
Concentrate § Opportunity
for
further
op8miza8on
(s)
of
mill
circuit
§ Grinding
–
Cu
Flota8on
–
Pyrite
Flota8on
–
CN
of
Pyrite
Concentrate
30
Rio
Tinto
Group's
Northparkes
mine
in
Parkes,
New
South
Wales,
Australia
30
30
31. Northern
Concession:
Kautokeino
§ 2012
Explora8on
program
focused
on
Kautokeino
greenstone
belt
–
largest
of
the
3
belts
§ 2,476
8ll
samples
collected
§ 48
rock
samples
collected
§ Completed
8ll
orienta8on
survey
around
former
producing
gold
mine,
Bidjovagge
§ 10
gold-‐in-‐+ll
anomalies
iden+fied
§ 2013
Next
steps
–
follow-‐up
via
sampling,
prospec8ng
and
geophysics
of
10
anomalies
31
32. Southern
Concession:
Kongsberg
§ Historic
silver
mining
district
with
produc8on
of
40+
million
ounces
with
average
grades
of
356
g/t
silver
§ 462
stream
sediment
samples
completed
§ 156
rock
samples
completed,
including:
– 278
g/t
of
silver
with
0.28%
zinc
– 61
g/t
of
silver
with
21.60%
zinc
– 109
g/t
of
silver
with
16.20%
zinc
§ 2013
Next
Steps:
– Crews
will
return
in
H1
2013
for
program
comple8on
– Follow-‐up
of
five
stream
sediment
silver
targets
– Extensive
program
of
reviewing
and
reprocessing
new
and
historic
geophysical
data
to
iden8fy
priority
explora8on
targets
will
con8nue
32