2. Most reports analyse past
results (lag indicators)
instead of the factors that
will determine the future
performance and
profitability (lead
indicators).....
The nature of doing business and
competing is currently changing
dramatically. Quality, innovation
and service are just as essential
as costs to survive and grow, but
are hardly mentioned in existing
reports.....
The reports sometimes
stimulate actions that have a
positive impact on the short
term results, but a negative
effect on the long term.....
Only looking at financial measurements often
doesn’t provide complete steering information
3. Who are our profitable customers?
Do we pay the most attention to those customers?
Do we know what these customers expect from us now and
in the (near) future?
Do we develop the products and services that will keep us in
the running?
Do our employees develop the knowledge and skills that the
markets (will) ask?
Do we recruit the right people?
4. Reliance on only financial measures of performance as
the one true way to gauge success, &
Inability of many organizations to successfully execute
their strategies.
the need for a Balanced
Scorecard system
Reasons
6. BSC IS A PERFORMANCEManagement TECHNIQUE
DEVELOPEDBY :
ROBERT S KAPLAN
AND
DAVIDNORTON
PROFESSORS AT
HARVARDBUSINESS SCHOOL
IN 1992
7. Where did the BSC come from?
THEN NOW
Industrial revolution Information age
Financial measures Non-financial measures
Tangible assets Intangible assets
Lagging indicators Leading indicators
8. “The balanced scorecard retains traditional financial
measures. But financial measures tell the story of past
events, an adequate story for industrial age companies for
which investments in long-term capabilities and customer
relationships were not critical for success.
These financial measures are inadequate, however, for
guiding and evaluating the journey that information age
companies must make to create future value through
investment in customers, suppliers, employees, processes,
technology, and innovation.“ -Norton and Kaplan
BSC translates an organization’s mission and strategy into a set of
performance measures that provides the framework for
implementing the strategy.
9. “Balanced Score Card" as a set of measures that gives top
managers a fast but comprehensive view of the business.
The balanced scorecard includes financial measures that
tell the results of actions already taken.
It complements the financial measures with operational
measures on customer satisfaction, internal processes,
and the organization's innovation and improvement
activities- operational measures that are the drivers of
future financial performance.
- Kaplan and Norton (1992)
10. What is a Balanced Score Card?
1) A measurement system
2) A strategic management system
3) A communication tool
11. Translating with the BSC
Desired state
Differentiating activities
What must be done
well to implement
strategies
How strategic
success is
measured
Mission
Vision
Strategy/Goals
Objectives
In each perspective
Measures
In each perspective
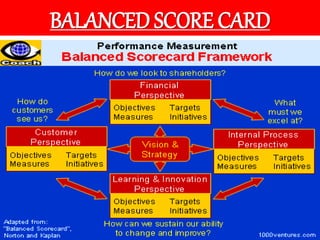
12. BSC as a Measurement System
Translates mission, vision and
strategy through objectives and
measures
Provides a framework to describe the
key elements in the achievement of
the strategy
Measures four perspectives:
- Financial
- Customer Relations
- Internal Business Processes
- Learning, Innovation and Growth
14. INTERNAL VALUE CHAIN
CUSTOMER
NEED
IDENTIFIED
Innovation cycle:
-Identify the market
-Create the product
Operating cycle:
-Build the product
-Deliver the product
Post sales services cycle:
Service the customer
CUSTOMER
NEED
FULFILLED
15. Knowledge, Skills, Systems, and Tools
Financial
Results
To Build the Strategic Capabilities..
Needed to Deliver Unique
Sets of Benefits to Customers...
To Drive Financial
Success...
And Realize
the Vision
Equip our People...
Internal
Capabilities
Customer
Benefits
INTERRELATIONSHIP BETWEEN FOUR
PERSPECTIVES OF BSC
16. FINANCIAL: Revenue generated, ROS, ROI, RI,
EVA, MVA
CUSTOMERS:
INTERNAL BUSINESS PROCESSES :
Customer acquisition, Customer satisfaction &
delight, Customer retention, Market share
-Processes adopted to enhance EVA
-Processes to serve the customer better e.g.
Internal Value Chain
LEARNING &GROWTH : Employees, Infrastructure, Systems
18. BSC as a StrategicManagement System
Translates strategy
into:
Objectives
Measures
Targets
Initiatives
19. Perspectives Objectives
FINANCIAL
To increase financial
growth
CUSTOMER
To increase Customer
satisfaction
INTERNAL BUSINESS
PROCESSES
To reduce cycle time,
To reduce defects &
costs
LEARNING AND GROWTH
To increase core
skills and systems
availability.
Vision &
Strategy
20. Perspective Objectives Measurements
Financial To increase
financial growth.
Revenue growth, Return of Capital Employed, Return on investment,
Operating income, Economic value added, gross margin, Cash flow etc.
Customer To increase
customer
satisfaction .
Customer satisfaction ratings, Customer-retention percentage, Market
share, Time taken to fulfil customers’ requests , no. of customer
complaints etc.
Internal To reduce cycle
business time,
Process To reduce defects
&
costs
Innovation - measures of how well the company identifies the
customers’ future needs, new-product development times, no. of new
products, etc.
Operations - Measures of quality, Cycle time, and costs, Defect rates,
Average time taken to respond to orders, etc.
Post sales service - measures for warranty, repair and treatment of
defects and returns, hours of customer training for using the product
etc.
Learning and To increase core
Growth skills and systems
availability.
People - employee retention, training, skills, morale, employee-
satisfaction ratings, employee turnover rates, percentage of employee
suggestions implemented etc.
Systems - measure of availability of critical real time information
21. 8. Sample Generic Scorecard
Perspectives Objectives Measurements
Learning &
Growth
Develop process skills
Align the employee & org’s goals
% of employees trained in process
management
Employee satisfaction ratings
Internal
Business
Process
Increase quality. Number of defects and
number of items reworked.
Improve post sales service Service response time
Customer
Increase on time delivery.
Percentage of deliveries
on time.
Reduce customer
complaints.
Number of customer
complaints.
Financial
Return on capital employed
Increase shareholders value
Return on investment
22. Perspectives Objectives Measurements
2012 2013
Financial Maximise Returns
Utilization of Assets
Revenue Growth
Return on Equity
Utilization Rates
% Change in
Revenues
12%
7%
+11%
13%
8%
+11%
Customer Customer Retention
Customer Relations
Retention %
% Self Initiated Calls
75%
35%
75%
40%
Internal
Processes
Fast Delivery
Effective Service
Turnaround Time
1st Time Resolvement
15m
68%
14m
69%
Learning &
Growth
High Skill Levels
Employee Satisfaction
Skill set ratio
Survey Index
65%
75%
68%
77%
Targets
23. Perspectives Objectives Measurements 2012 2013 Initiatives
Financial Maximum Returns
Utilization of Assets
Revenue Growth
Return on Equity
Utilization Rates
% Change in
Revenues
12%
7%
+11%
13%
8%
+11%
Customer Customer
Retention
Customer Relations
Retention %
% Self Initiated
Calls
75%
35%
75% Customer
40% Relation mgt.
Internal
Processes
Fast Delivery
Effective Service
Turnaround Time
1st Time
Resolvement
15m
68%
14m Cycle process
system
69% Customer
relations mgt.
Learning &
Growth
High Skill Levels
Employee
Satisfaction
Skill set ratio
Survey Index
65%
75%
68%
77% corporate
initiatives
Targets
24. IMPLEMENTATION OF THE BSC
AT INDIA LEVEL
1.Infosys Technologies
2.Philips Electronics
3.Nerolac Paints Limited
4.Gorej-GE Appliances
limited
5.Tata Consultancy
Services
AT GLOBAL LEVEL
1.ABB
2.Skandia
3.Analog Device, Inc.
4.Compaq
5.Halifax
6.Eletrolux