SlideShare ist ein Scribd-Unternehmen logo
1 von 9
Downloaden Sie, um offline zu lesen
Amylin Pharmaceuticals Inc. (AMLN)
                                                               ®
                                                                           COMPANY UPDATE                                                       Michael G. King, Jr.
                                                                                                                                                      212-430-1794
                                                                                                                                                  mking@rodm.com
                                                                           LIFE SCIENCES

May 14, 2012                       Market Underperform / Speculative
                                   Risk
        Bydureon Posts Flat NRx Market Share, While GLP-1 TRx Grow Over 5% Sequentially
                                                                                     Updated GLP-1 Rx data for the week ending May 4th. Wolters-Kluwer
MARKET DATA                                                   5/11/2012
                                                                                     reported that there were 3,332 new starts (NRx) on Bydureon for the
Price                                                         $25.86                 week of April 28th to May 4th (week 12 of the launch). On an absolute
Exchange                                                    NASDAQ                   basis, new starts were up 3.4% from the previous week’s total of 3,224.
Target Price                                                  $22.00                 However, Bydureon NRx market shares was flat at 11.0%, as the entire
52 Wk Hi - Low                                         $26.87 - $8.03
                                                                                     GLP-1 class had its largest sequential rise in NRx in more than two
Market Cap(MM)                                              $4,211.4
EV(MM)                                                      $5,581.0
                                                                                     months, rising to 30,388 NRx from 29,220 the previous week. This is
Shares Out (MM)                                                 162.9                also an all-time high for the class in terms of NRx.
Public Mkt Float (MM)                                         1,617.8
Avg. Daily Vol                                             4,123,688
                                                                                     NRx for the overall exenatide franchise rose again for the third
Short Interest                                            10,496,372
                                                                                     consecutive week. Exenatide NRx grew 3.6% this week, building upon
BALANCE SHEET METRICS                                                                last week’s of 3.8% to rise to 13,746 NRx. Exenatide NRx market share
Cash (MM)                                                                $204.1      rose dipped marginally to 45.2% from 45.4%. Table 1 details the
LTD (MM)                                                                 $714.8      comparison of NRx results for the week compared to the 4-week moving
Total Debt/Capital                                                          NA       averages prior to the launch. Figures 1 and 2 detail the NRx figures and
Cash/Share                                                                $1.39      market share.
Book Value(MM)                                                              NA
Book Value/Share                                                          $0.05
                                                                                     Exenatide total Rx (TRx) market share rises above ~45%. We
EARNINGS DATA ($)                                                                    recommend investors focus on total Rx (TRx) as the key metric, as it
FY - Dec                         2010A          2011A                 2012E          relates directly to revenues, to judge the exenatide franchise. Bydureon
Q1 (Mar)                          (0.27)         (0.26)              (0.66)A         posted TRx of 5,155, up 8.6% from last week’s total of 4,746. TRx
Q2 (Jun)                          (0.31)         (0.22)                (0.51)        market share rose modestly to 6.9% from 6.8%. Byetta TRx was 28,314
Q3 (Sep)                          (0.35)         (0.09)                (0.44)        up 7% from last week’s results of to 26,379, however, still well below the
Q4 (Dec)                          (0.13)         (3.16)                (0.40)        high of ~30,000 weekly Byetta TRx earlier this year. TRx market share
Full Year EPS                     (1.06)         (3.73)                (2.03)
                                                                                     for the exenatide franchise rose to 44.9% from 44.2%, as the franchise
Revenue (MM)                      669.0          650.7                 624.9
                                                                                     built upon last week’s gains. TRx for the entire GLP-1 class was 74,481,
                                                                                     up 5.9% from 70,363, and the highest total weekly total since the launch
VALUATION METRICS                                                                    of Byetta. Table 2 details the comparison of TRx results for the week
Price/Earnings                        NM            NM                      NM       compared to the 4-week moving averages prior to the launch. We
EV/Revenue                           8.3x          8.6x                    8.9x      compare the Bydureon launch to Victoza on the following page.
Y/Y EPS Growth                                  251.9%                      NM
EV/Sales
                                                                                     Bydureon fails to gain any ground on Victoza launch. In order to
INDICES                                                                              compare the relative launches of Bydureon and Victoza, we pulled the
                                                                                     weekly Rx statistics from Victoza two years ago (Figure 3 and Table 5).
DJIA                                                               12,820.6
SP-500                                                              1,353.4
                                                                                     Despite the GLP-1 market growing some 20% in the two years since the
NASDAQ                                                              2,616.0          launch of Victoza, the absolute NRx (3,332) generated by Bydureon is
NBI                                                                 1,313.5          41% lower than that achieved by Victoza (5,686) at the same point in the
                                                                                     respective launches.
                         1 Year Price History


                                                                                30
                                                                                25
                                                                                20
                                                                                     We maintain our Market Underperform rating and a $22 target. We
                                                                                15   continue to believe our skepticism is justified given the company’s history
                                                                                10
                                                                                5
                                                                                     of poor execution and the most recent quarter’s fair-to-middling (in our
 Q1         Q2          Q3                             Q1                  Q2
                                         2012
                                                                                50
                                                                                     opinion) results. We continue to believe the exenatide franchise is
                                                                                40
                                                                                30
                                                                                     unwanted by those who already have a presence in the diabetes space
                                                                                20
                                                                                10   and a sub-optimal set of assets for those companies to gain a presence
                                                                                0
                                                 Created by BlueMatrix               in the diabetes/metabolic disease space. In our opinion, AMLN
                                                                                     management would have done well to accept the BMY offer of $22 per
                                                                                     share; justifying our price target on the shares.


 For definitions and the distribution of analyst ratings, and other disclosures, please refer to pages 8 - 9 of this report.
Amylin Pharmaceuticals Inc.                          May 14, 2012


            Figure 1. NRx Absolute Figures by Week


            Figure 2. NRx Market Share by Week


RODMAN & RENSHAW EQUITY RESEARCH                               2
Amylin Pharmaceuticals Inc.                                                        May 14, 2012


            Figure 3. Comparison of Victoza and Bydureon Launches (Absolute NRx)


            Figure 4. Absolute TRx by Week


RODMAN & RENSHAW EQUITY RESEARCH                                                             3
Amylin Pharmaceuticals Inc.                                                                                May 14, 2012


            Table 1. Changes in NRx from Week Ending 5/4/12 Vs. Moving Avgs. Prior to Bydureon Approval

                                                   4-week
                                                   Moving
             Changes in NRx                                     5/4/2012    Variance
                                                  Averages
                                                  1/27/2012

              BYDUREON                                              3,332     3,332
              BYETTA                                 11,412        10,414      (998)
             Total Exenetide Franchise               11,412        13,746     2,334
              VICTOZA                                15,063        16,642     1,579
             TOTAL GLP-1 New Rx                      26,475        30,388     3,913

             Market Share % of NRx
              BYDUREON                                              11.0%     11.0%
              BYETTA                                   43.1%        34.3%     -8.8%
             Total Exenetide %                         43.1%        45.2%      2.1%
              VICTOZA                                  56.9%        54.8%     -2.1%

            Table 2. Changes in TRx from Week Ending 5/4/12 Vs. Moving Avgs. Prior to Bydureon Approval

                                                   4-week
                                                   Moving
             Changes in TRx                                     5/4/2012    Variance
                                                  Averages
                                                  1/27/2012

              BYDUREON                                              5,155     5,155
              BYETTA                                 28,429        28,314      (115)
             Total Exenetide Franchise               28,429        33,469     5,041
              VICTOZA                                36,009        41,012     5,004
             TOTAL GLP-1 Rx                          64,437        74,481    10,044

             Market Share % of TRx
              BYDUREON                                               6.9%      6.9%
              BYETTA                                   43.8%        38.0%     -5.8%
             Total Exenetide %                         43.8%        44.9%      1.1%
              VICTOZA                                  56.2%        55.1%     -1.1%

            Upcoming Milestones

            Product                  Event                                                  Timing
            Corporate                Annual meeting and proxy fight                         May 24, 2012
            Bydureon                 Secure EU partner                                      2012
            Metreleptin              Potential EU orphan designation                        1H12
            Exenatide suspension     Once-weekly Phase III initiation                       2Q12/3Q12
            Bydureon                 Launch pen/device                                      4Q12/1Q13
            Exenatide suspension     Once-monthly Phase III initiation                      2013


RODMAN & RENSHAW EQUITY RESEARCH                                                                                     4
Amylin Pharmaceuticals Inc.                                                                                                                                                                                                                                         May 14, 2012


            Table 3. New Prescription Starts (NRx) for the GLP-1 Market by Week

             Total New Rx (NRx)
             Product                      1/6/2012   1/13/2012   1/20/2012       1/27/2012   2/3/2012       2/10/2012   2/17/2012   2/24/2012   3/2/2012   3/9/2012   3/16/2012   3/23/2012   3/30/2012   4/6/2012   4/13/2012   4/20/2012   4/27/2012   5/4/2012
             Week                                                                                                          1           2           3          4          5           6           7           8          9           10          11         12
              BYDUREON
               TOTAL BYDUREON Rx                                                                        1          15        386         894       1,275      1,845     2,073       2,467       2,719       2,940       2,801       2,963       3,224      3,332
               Sequential Growth                                                                                        2473.33%     131.61%      42.62%     44.71%    12.36%      19.01%      10.21%       8.13%      -4.73%       5.78%       8.81%      3.35%
               4-wk Moving Avg.                                                                                              134         324         643      1,100     1,522       1,915       2,276       2,550       2,732       2,856       2,982      3,080

              BYETTA
               10MCG/0.04                    7,866      8,353       7,915           8,106       8,854          8,047       7,485       7,556       7,517      7,911      7,336       7,148       7,433      7,255       6,762       6,841       7,055      7,259
               5MCG/0.02                     3,198      3,403       3,394           3,413       3,569          3,465       3,199       3,158       3,274      3,486      3,189       3,173       3,141      3,089       2,872       2,974       2,987      3,155
               TOTAL BYETTA Rx              11,064     11,756      11,309          11,519      12,423         11,512      10,684      10,714      10,791     11,397     10,525      10,321      10,574     10,344       9,634       9,815      10,042     10,414
               Sequential Growth            18.78%      6.25%      -3.80%           1.86%       7.85%         -7.33%      -7.19%       0.28%       0.72%      5.62%     -7.65%      -1.94%       2.45%     -2.18%      -6.86%       1.88%       2.31%      3.70%
                4-wk Moving Avg.            10,550     10,745      10,861          11,412      11,752         11,691      11,535      11,333      10,925     10,897     10,857      10,759      10,704     10,441      10,218      10,092       9,959      9,976

              TOTAL EXENETIDE FRANCHISE     11,064     11,756      11,309          11,519      12,424         11,527      11,070      11,608      12,066     13,242     12,598      12,788      13,293     13,284      12,435      12,778      13,266     13,746
               Sequential Growth            18.78%      6.25%      -3.80%           1.86%       7.86%         -7.22%      -3.96%       4.86%       3.95%      9.75%     -4.86%       1.51%       3.95%     -0.07%      -6.39%       2.76%       3.82%      3.62%
               4-wk Moving Avg.             10,550     10,745      10,861          11,412      11,752         11,695      11,635      11,657      11,568     11,997     12,379      12,674      12,980     12,991      12,950      12,948      12,941     13,056
                                                                             ~
              VICTOZA
               2-PACK                        5,010      5,301       5,214           5,162       5,615          5,389       5,303       5,334       5,431      5,711      5,381       5,467       5,356      5,306       5,527       5,719       5,539      5,654
               3-PACK                        9,626      9,944       9,927          10,067      10,472         10,439      10,382       9,958      10,330     11,012     10,101      10,417      10,422     10,247       9,944      10,484      10,415     10,988
               TOTAL VICTOZA Rx             14,636     15,245      15,141          15,229      16,087         15,828      15,685      15,292      15,761     16,723     15,482      15,884      15,778     15,553      15,471      16,203      15,954     16,642
               Sequential Growth            19.12%      4.16%      -0.68%           0.58%       5.63%         -1.61%      -0.90%      -2.51%       3.07%      6.10%     -7.42%       2.60%      -0.67%     -1.43%      -0.53%       4.73%      -1.54%      4.31%
                4-wk Moving Avg.            13,899     14,148      14,327          15,063      15,426         15,571      15,707      15,723      15,642     15,865     15,815      15,963      15,967     15,674      15,672      15,751      15,795     16,068

              TOTAL GLP-1 NRx               25,700     27,001      26,450          26,748      28,511         27,355      26,755      26,900      27,827     29,965     28,080      28,672      29,071     28,837      27,906      28,981      29,220     30,388
               Sequential Growth            18.97%      5.06%      -2.04%           1.13%       6.59%         -4.05%      -2.19%       0.54%       3.45%      7.68%     -6.29%       2.11%       1.39%     -0.80%      -3.23%       3.85%       0.82%      4.00%
               4-wk Moving Avg.             24,448     24,893      25,188          26,475      27,178         27,266      27,342      27,380      27,209     27,862     28,193      28,636      28,947     28,665      28,622      28,699      28,736     29,124

             % of NRx by Product
             Product                      1/6/2012   1/13/2012   1/20/2012       1/27/2012   2/3/2012       2/10/2012   2/17/2012   2/24/2012   3/2/2012   3/9/2012   3/16/2012   3/23/2012   3/30/2012   4/6/2012   4/13/2012   4/20/2012   4/27/2012   5/4/2012
             Week                                                                                                          1           2           3          4          5           6           7           8          9           10          11         12
             BYDUREON                        0.0%       0.0%        0.0%            0.0%        0.0%           0.1%        1.4%        3.3%        4.6%       6.2%       7.4%        8.6%        9.4%      10.2%       10.0%       10.2%       11.0%      11.0%
             BYETTA                         43.1%      43.5%       42.8%           43.1%       43.6%          42.1%       39.9%       39.8%       38.8%      38.0%      37.5%       36.0%       36.4%      35.9%       34.5%       33.9%       34.4%      34.3%
              Total Exenetide %             43.1%      43.5%       42.8%           43.1%       43.6%          42.1%       41.4%       43.2%       43.4%      44.2%      44.9%       44.6%       45.7%      46.1%       44.6%       44.1%       45.4%      45.2%
             VICTOZA                        56.9%      56.5%       57.2%           56.9%       56.4%          57.9%       58.6%       56.8%       56.6%      55.8%      55.1%       55.4%       54.3%      53.9%       55.4%       55.9%       54.6%      54.8%


RODMAN & RENSHAW EQUITY RESEARCH                                                                                                                                                                                                                                              5
Amylin Pharmaceuticals Inc.                                                                                                                                                                                                                                          May 14, 2012


            Table 4. Total Prescriptions (TRx) for the GLP-1 Market by Week

             GLP-1 Agonist - Total Rx (TRx)
             Product                          1/6/2012   1/13/2012   1/20/2012   1/27/2012   2/3/2012       2/10/2012   2/17/2012    2/24/2012   3/2/2012   3/9/2012   3/16/2012   3/23/2012   3/30/2012   4/6/2012   4/13/2012   4/20/2012   4/27/2012   5/4/2012
             Week                                                                                                              1            2           3          4          5           6           7         8           9         10           11         12
              BYDUREON
               TOTAL BYDUREON Rx                                                                        1          15          387        903       1,284      1,881     2,235       2,797       3,291       3,702       3,775      4,247       4,746       5,155
               Sequential Growth                                                                                                      133.33%      42.19%     46.50%    18.82%      25.15%      17.66%      12.49%       1.97%     12.50%      11.75%       8.62%
               4-wk Moving Avg. Bydureon                                                                                       134        327         647      1,114     1,576       2,049       2,551       3,006       3,391      3,754       4,118       4,481

              BYETTA
               10MCG/0.04                       22,680     21,602      21,029      20,736      23,378         21,115      20,663       20,323      21,902     22,357     20,244      20,090      21,126     21,428      19,637      19,519      20,003     21,345
               5MCG/0.02                         7,145      6,893       6,911       6,718       7,446          6,982       6,729        6,539       7,107      7,222      6,629       6,666       6,864      6,887       6,119       6,330       6,376      6,969
               TOTAL BYETTA Rx                  29,825     28,495      27,940      27,454      30,824         28,097      27,392       26,862      29,009     29,579     26,873      26,756      27,990     28,315      25,756      25,849      26,379     28,314
               Sequential Growth                10.27%     -4.46%      -1.95%      -1.74%      12.28%         -8.85%      -2.51%       -1.93%       7.99%      1.96%     -9.15%      -0.44%       4.61%      1.16%      -9.04%       0.36%       2.05%      7.34%
               4-wk Moving Avg.                 28,465     28,504      28,327      28,429      28,678         28,579      28,442       28,294      27,840     28,211     28,081      28,054      27,800     27,484      27,204      26,978      26,575     26,575

              TOTAL EXENETIDE FRANCHISE         29,825     28,495      27,940      27,454      30,825         28,112      27,779       27,765      30,293     31,460     29,108      29,553      31,281     32,017      29,531      30,096      31,125     33,469
               Sequential Growth                10.27%     -4.46%      -1.95%      -1.74%      12.28%         -8.80%      -1.18%       -0.05%       9.10%      3.85%     -7.48%       1.53%       5.85%      2.35%      -7.76%       1.91%       3.42%      7.53%
               4-wk Moving Avg.                 28,465     28,504      28,327      28,429      28,679         28,583      28,543       28,620      28,487     29,324     29,657      30,104      30,351     30,490      30,596      30,731      30,692     31,055

              VICTOZA
               2-PACK                           12,317     12,211      12,100      11,831      12,815         12,625      12,277       12,446      12,762     13,557     12,636      12,822      12,974     12,995      12,935      13,327      13,097     13,709
               3-PACK                           24,536     23,842      23,804      23,393      24,900         25,045      24,585       24,212      25,490     26,407     25,209      25,399      25,966     26,030      25,180      26,112      26,141     27,303
               TOTAL VICTOZA Rx                 36,853     36,053      35,904      35,224      37,715         37,670      36,862       36,658      38,252     39,964     37,845      38,221      38,940     39,025      38,115      39,439      39,238     41,012
               Sequential Growth                11.49%     -2.17%      -0.41%      -1.89%       7.07%         -0.12%      -2.14%       -0.55%       4.35%      4.48%     -5.30%       0.99%       1.88%      0.22%      -2.33%       3.47%      -0.51%      4.52%
               4-wk Moving Avg.                 35,358     35,510      35,466      36,009      36,224         36,628      36,868       37,226      37,361     37,934     38,180      38,571      38,743     38,508      38,575      38,880      38,954     39,451

              TOTAL GLP-1 Rx                    66,678     64,548      63,844      62,678      68,540         65,782      64,641       64,423      68,545     71,424     66,953      67,774      70,221     71,042      67,646      69,535      70,363     74,481
               Sequential Growth                10.94%     -3.19%      -1.09%      -1.83%       9.35%         -4.02%      -1.73%       -0.34%       6.40%      4.20%     -6.26%       1.23%       3.61%      1.17%      -4.78%       2.79%       1.19%      5.85%
               4-wk Moving Avg.                 63,823     64,014      63,793      64,437      64,903         65,211      65,410       65,847      65,848     67,258     67,836      68,674      69,093     68,998      69,171      69,611      69,647     70,506

             % of TRx by Product
             Product                          1/6/2012   1/13/2012   1/20/2012   1/27/2012   2/3/2012       2/10/2012   2/17/2012    2/24/2012   3/2/2012   3/9/2012   3/16/2012   3/23/2012   3/30/2012   4/6/2012   4/13/2012   4/20/2012   4/27/2012   5/4/2012
             Week                                                                                                          1            2           3          4          5           6           7             8           9         10           11         12
             BYDUREON                            0.00%      0.00%       0.00%       0.00%       0.00%          0.02%       0.60%        1.40%       1.87%      2.63%      3.34%       4.13%       4.69%      5.21%       5.58%       6.11%       6.75%      6.92%
             BYETTA                              44.7%      44.1%       43.8%       43.8%       45.0%          42.7%       42.4%        41.7%       42.3%      41.4%      40.1%       39.5%       38.6%      39.9%       38.1%       37.2%       37.5%      38.0%
              Total Exenetide %                  44.7%      44.1%       43.8%       43.8%       45.0%          42.7%       43.0%        43.1%       44.2%      44.0%      43.5%       43.6%       43.3%      45.1%       43.7%       43.3%       44.2%      44.9%
             VICTOZA                             55.3%      55.9%       56.2%       56.2%       55.0%          57.3%       57.0%        56.9%       55.8%      56.0%      56.5%       56.4%       56.8%      54.9%       56.3%       56.7%       55.8%      55.1%


RODMAN & RENSHAW EQUITY RESEARCH                                                                                                                                                                                                                                               6
Amylin Pharmaceuticals Inc.                                                                                                                                                       May 14, 2012


            Table 5. Comparison of Bydureon and Victoza Launches by NRx

                                                                                                  NRx by Week Since Launch
                                                           1          2         3          4         5         6         7          8         9         10        11         12
                                                        2/17/2012 2/24/2012   3/2/2012   3/9/2012 3/16/2012 3/23/2012 3/30/2012   4/6/2012 4/13/2012 4/20/2012 4/27/2012   5/4/2012
             Bydureon                                          386     894      1,275     1,845     2,073     2,467      2,719      2,940     2,801     2,963     3,224     3,332
              % Sequential Growth                                   131.6%      42.6%     44.7%     12.4%     19.0%      10.2%       8.1%      -4.7%     5.8%      8.8%       3.3%
                                                        2/19/2010 2/26/2010   3/5/2010 3/12/2010 3/19/2010 3/26/2010   4/2/2010   4/9/2010 4/16/2010 4/23/2010 4/30/2010 4/30/2010
             Victoza                                         411     1,057      1,465     2,234     2,540     3,153      3,605      3,809     4,346     4,742     5,214     5,686
               % Sequential Growth                                  157.2%      38.6%     52.5%     13.7%     24.1%      14.3%        5.7%    14.1%       9.1%    10.0%       9.1%

             Bydureon Performance Relative to Victoza                -15.4%   -13.0%     -17.4%    -18.4%     -21.8%    -24.6%    -22.8%    -35.5%     -37.5%    -38.2%     -41.4%


RODMAN & RENSHAW EQUITY RESEARCH                                                                                                                                                            7
Amylin Pharmaceuticals Inc.                                                                                                       May 14, 2012


 RODMAN & RENSHAW RATING SYSTEM: Rodman & Renshaw employs a three tier rating system for evaluating both the potential
 return and risk associated with owning common equity shares of rated firms. The expected return of any given equity is measured on a
 RELATIVE basis of other companies in the same sector, as defined by First Call. The price objective is calculated to estimate the potential
 movement in price a given equity could achieve given certain targets are met over a defined time horizon. Price objectives are subject to
 exogenous factors including industry events and market volatility. The risk assessment evaluates the company specific risk and accounts
 for the following factors, maturity of market, maturity of technology, maturity of firm, cash utilization, and valuation considerations.
 Potential factors contributing to risk: relatively undefined market, new technologies, immature firm, high cash burn rates, intrinsic value
 weighted toward future earnings or events.


 RETURN ASSESSMENT
     q
        Market Outperform (Buy): The common stock of the company is expected to outperform a passive index comprised of all the
        common stock of companies within the same sector, as defined by First Call.
     q
        Market Perform (Hold): The common stock of the company is expected to mimic the performance of a passive index comprised
        of all the common stock of companies within the same sector, as defined by First Call.
     q
        Market Underperform (Sell): The common stock of the company is expected to underperform a passive index comprised of all
        the common stock of companies within the same sector, as defined by First Call.
 RISK ASSESSMENT
     q
         Speculative - The common stock risk level is significantly greater than market risk. The stock price of these equities is
         exceptionally volatile.
     q
         Aggressive - The common stock risk level is materially higher than market level risk. The stock price is typically more volatile
         than the general market.
     q
         Moderate - The common stock is moderately risky, or equivalent to stock market risk. The stock price volatility is typically in-line
         with movements in the general market.


                 Rating and Price Target History for: Amylin Pharmaceuticals Inc. (AMLN) as of 05-11-2012

     01/05/12        04/27/12
      I:MU:$8         MU:$22

                                                                                                                         30

                                                                                                                         25

                                                                                                                         20

                                                                                                                         15

                                                                                                                         10

                                                                                                                       5
    Q1          Q2              Q3          Q1      Q2    Q3             Q1    Q2      Q3                 Q1         Q2
                                     2010                         2011                         2012


                                                                                                 Created by BlueMatrix


 RATING SUMMARY
                                                 Distribution of Ratings Table
                                                                                             IB Serv./Past 12 Mos
                   Rating                                 Count           Percent           Count           Percent
   Market Outperform(MO)                                   73             62.39%              10            13.70%
   Market Perform(MP)                                      28             23.93%               3            10.71%
   Market Underperform(MU)                                  6              5.13%               0             0.00%
   Under Review(UR)                                        10              8.55%               3            30.00%
   Total                                                   117             100%               16             100%


 Investment Banking Services include, but are not limited to, acting as a manager/co-manager in the underwriting or placement of
 securities, acting as financial advisor, and/or providing corporate finance or capital markets-related services to a company or one of its
RODMAN & RENSHAW EQUITY RESEARCH                                                                                                                8
Amylin Pharmaceuticals Inc.                                                                                                      May 14, 2012


 affiliates or subsidiaries within the past 12 months.


 ADDITIONAL DISCLOSURES
 Rodman & Renshaw, LLC. (the "Firm") is a member of FINRA and SIPC and a registered U.S. Broker-Dealer.

 ANALYST CERTIFICATION
 I, Michael G. King, Jr., hereby certify that the views expressed in this research report accurately reflect my personal views about the
 subject company(ies) and its (their) securities.
 None of the research analysts or the research analyst's household has a financial interest in the securities of Amylin Pharmaceuticals Inc.
 (including, without limitation, any option, right, warrant, future, long or short position).

 As of Apr 30 2012 neither the Firm nor its affiliates beneficially own 1% or more of any class of common equity securities of Amylin
 Pharmaceuticals Inc..

 Neither the research analyst nor the Firm has any material conflict of interest with Amylin Pharmaceuticals Inc., of which the research
 analyst knows or has reason to know at the time of publication of this research report.
 The research analyst principally responsible for preparation of the report does not receive compensation that is based upon any specific
 investment banking services or transaction but is compensated based on factors including total revenue and profitability of the Firm, a
 substantial portion of which is derived from investment banking services.
 The Firm or its affiliates did not receive compensation from Amylin Pharmaceuticals Inc. for any investment banking services within twelve
 months before, but intends to seek compensation from the companies mentioned in this report for investment banking services within
 three months, following publication of the research report.

 Neither the research analyst nor any member of the research analyst's household nor the Firm serves as an officer, director or advisory
 board member of Amylin Pharmaceuticals Inc..

 The Firm does make a market in Amylin Pharmaceuticals Inc. securities as of the date of this research report.

 Any opinions expressed herein are statements of our judgment as of the date of publication and are subject to change without notice.
 Reproduction without written permission is prohibited. The closing prices of securities mentioned in this report are as of May 11 2012.
 Additional information is available to clients upon written request. For complete research report on Amylin Pharmaceuticals Inc., please
 call (212) 356-0500.
 Readers are advised that this analysis report is issued solely for informational purposes and is not to be construed as an offer to sell or
 the solicitation of an offer to buy. The information contained herein is based on sources which we believe to be reliable but is not
 guaranteed by us as being accurate and does not purport to be a complete statement or summary of the available data. Past performance
 is no guarantee of future results.


RODMAN & RENSHAW EQUITY RESEARCH                                                                                                               9

Weitere ähnliche Inhalte

Mehr von DailyDoseEquities

Rodman & Renshaw on Amylin Pharma (AMLN) 5-21-12
Rodman & Renshaw on Amylin Pharma (AMLN) 5-21-12Rodman & Renshaw on Amylin Pharma (AMLN) 5-21-12
Rodman & Renshaw on Amylin Pharma (AMLN) 5-21-12DailyDoseEquities
 
Rodman renshaw life sciences conference update 5 11-12
Rodman renshaw life sciences conference update 5 11-12Rodman renshaw life sciences conference update 5 11-12
Rodman renshaw life sciences conference update 5 11-12DailyDoseEquities
 
Rodman renshaw report on onty
Rodman renshaw report on ontyRodman renshaw report on onty
Rodman renshaw report on ontyDailyDoseEquities
 
Bell Potter Securities Report on Mesoblast 1 31-2012
Bell Potter Securities Report on Mesoblast 1 31-2012Bell Potter Securities Report on Mesoblast 1 31-2012
Bell Potter Securities Report on Mesoblast 1 31-2012DailyDoseEquities
 
Dd&d addressing the unmet needs of ami patients - dr. pecora 01.31.12
Dd&d   addressing the unmet needs of ami patients - dr. pecora 01.31.12Dd&d   addressing the unmet needs of ami patients - dr. pecora 01.31.12
Dd&d addressing the unmet needs of ami patients - dr. pecora 01.31.12DailyDoseEquities
 
Rodman renshaw report on affy
Rodman renshaw report on affyRodman renshaw report on affy
Rodman renshaw report on affyDailyDoseEquities
 
Vstm report by lazard capital markets 3 15-12
Vstm report by lazard capital markets 3 15-12Vstm report by lazard capital markets 3 15-12
Vstm report by lazard capital markets 3 15-12DailyDoseEquities
 
Cowen and company report - ONTY
Cowen and company report - ONTY Cowen and company report - ONTY
Cowen and company report - ONTY DailyDoseEquities
 

Mehr von DailyDoseEquities (9)

Rodman & Renshaw on Amylin Pharma (AMLN) 5-21-12
Rodman & Renshaw on Amylin Pharma (AMLN) 5-21-12Rodman & Renshaw on Amylin Pharma (AMLN) 5-21-12
Rodman & Renshaw on Amylin Pharma (AMLN) 5-21-12
 
Rodman renshaw life sciences conference update 5 11-12
Rodman renshaw life sciences conference update 5 11-12Rodman renshaw life sciences conference update 5 11-12
Rodman renshaw life sciences conference update 5 11-12
 
Rodman renshaw report on onty
Rodman renshaw report on ontyRodman renshaw report on onty
Rodman renshaw report on onty
 
Bell Potter Securities Report on Mesoblast 1 31-2012
Bell Potter Securities Report on Mesoblast 1 31-2012Bell Potter Securities Report on Mesoblast 1 31-2012
Bell Potter Securities Report on Mesoblast 1 31-2012
 
Dd&d addressing the unmet needs of ami patients - dr. pecora 01.31.12
Dd&d   addressing the unmet needs of ami patients - dr. pecora 01.31.12Dd&d   addressing the unmet needs of ami patients - dr. pecora 01.31.12
Dd&d addressing the unmet needs of ami patients - dr. pecora 01.31.12
 
ThinkEquity report on DRRX
ThinkEquity report on DRRXThinkEquity report on DRRX
ThinkEquity report on DRRX
 
Rodman renshaw report on affy
Rodman renshaw report on affyRodman renshaw report on affy
Rodman renshaw report on affy
 
Vstm report by lazard capital markets 3 15-12
Vstm report by lazard capital markets 3 15-12Vstm report by lazard capital markets 3 15-12
Vstm report by lazard capital markets 3 15-12
 
Cowen and company report - ONTY
Cowen and company report - ONTY Cowen and company report - ONTY
Cowen and company report - ONTY
 

Kürzlich hochgeladen

Call Girls In Amritsar 💯Call Us 🔝 76967 34778🔝 💃 Independent Escort In Amritsar
Call Girls In Amritsar 💯Call Us 🔝 76967 34778🔝 💃 Independent Escort In AmritsarCall Girls In Amritsar 💯Call Us 🔝 76967 34778🔝 💃 Independent Escort In Amritsar
Call Girls In Amritsar 💯Call Us 🔝 76967 34778🔝 💃 Independent Escort In Amritsaronly4webmaster01
 
Collective Mining | Corporate Presentation - April 2024
Collective Mining | Corporate Presentation - April 2024Collective Mining | Corporate Presentation - April 2024
Collective Mining | Corporate Presentation - April 2024CollectiveMining1
 
The exim bank in power point presentation
The exim bank in  power point presentationThe exim bank in  power point presentation
The exim bank in power point presentationsharmahemant3612
 
CALL ON ➥8923113531 🔝Call Girls Fazullaganj Lucknow best sexual service
CALL ON ➥8923113531 🔝Call Girls Fazullaganj Lucknow best sexual serviceCALL ON ➥8923113531 🔝Call Girls Fazullaganj Lucknow best sexual service
CALL ON ➥8923113531 🔝Call Girls Fazullaganj Lucknow best sexual serviceanilsa9823
 
Call Girls in Friends Colony 9711199171 Delhi Enjoy Call Girls With Our Escorts
Call Girls in Friends Colony 9711199171 Delhi Enjoy Call Girls With Our EscortsCall Girls in Friends Colony 9711199171 Delhi Enjoy Call Girls With Our Escorts
Call Girls in Friends Colony 9711199171 Delhi Enjoy Call Girls With Our Escortsindian call girls near you
 
Short-, Mid-, and Long-term gxxoals.pptx
Short-, Mid-, and Long-term gxxoals.pptxShort-, Mid-, and Long-term gxxoals.pptx
Short-, Mid-, and Long-term gxxoals.pptxHenryBriggs2
 
Q3 FY24 Earnings Conference Call Presentation
Q3 FY24 Earnings Conference Call PresentationQ3 FY24 Earnings Conference Call Presentation
Q3 FY24 Earnings Conference Call PresentationSysco_Investors
 
Collective Mining | Corporate Presentation - May 2024
Collective Mining | Corporate Presentation - May 2024Collective Mining | Corporate Presentation - May 2024
Collective Mining | Corporate Presentation - May 2024CollectiveMining1
 
Russian Call Girls Kolkata Indira 🤌 8250192130 🚀 Vip Call Girls Kolkata
Russian Call Girls Kolkata Indira 🤌  8250192130 🚀 Vip Call Girls KolkataRussian Call Girls Kolkata Indira 🤌  8250192130 🚀 Vip Call Girls Kolkata
Russian Call Girls Kolkata Indira 🤌 8250192130 🚀 Vip Call Girls Kolkataanamikaraghav4
 
《加州大学圣克鲁兹分校学位证书复制》Q微信741003700美国学历疑难问题指南|挂科被加州大学圣克鲁兹分校劝退没有毕业证怎么办?《UCSC毕业证购买|加...
《加州大学圣克鲁兹分校学位证书复制》Q微信741003700美国学历疑难问题指南|挂科被加州大学圣克鲁兹分校劝退没有毕业证怎么办?《UCSC毕业证购买|加...《加州大学圣克鲁兹分校学位证书复制》Q微信741003700美国学历疑难问题指南|挂科被加州大学圣克鲁兹分校劝退没有毕业证怎么办?《UCSC毕业证购买|加...
《加州大学圣克鲁兹分校学位证书复制》Q微信741003700美国学历疑难问题指南|挂科被加州大学圣克鲁兹分校劝退没有毕业证怎么办?《UCSC毕业证购买|加...wyqazy
 
OKC Thunder Reveal Game 2 Playoff T Shirts
OKC Thunder Reveal Game 2 Playoff T ShirtsOKC Thunder Reveal Game 2 Playoff T Shirts
OKC Thunder Reveal Game 2 Playoff T Shirtsrahman018755
 

Kürzlich hochgeladen (20)

Call Girls In Amritsar 💯Call Us 🔝 76967 34778🔝 💃 Independent Escort In Amritsar
Call Girls In Amritsar 💯Call Us 🔝 76967 34778🔝 💃 Independent Escort In AmritsarCall Girls In Amritsar 💯Call Us 🔝 76967 34778🔝 💃 Independent Escort In Amritsar
Call Girls In Amritsar 💯Call Us 🔝 76967 34778🔝 💃 Independent Escort In Amritsar
 
Collective Mining | Corporate Presentation - April 2024
Collective Mining | Corporate Presentation - April 2024Collective Mining | Corporate Presentation - April 2024
Collective Mining | Corporate Presentation - April 2024
 
Call Girls 🫤 East Of Kailash ➡️ 9999965857 ➡️ Delhi 🫦 Russian Escorts FULL ...
Call Girls 🫤 East Of Kailash ➡️ 9999965857  ➡️ Delhi 🫦  Russian Escorts FULL ...Call Girls 🫤 East Of Kailash ➡️ 9999965857  ➡️ Delhi 🫦  Russian Escorts FULL ...
Call Girls 🫤 East Of Kailash ➡️ 9999965857 ➡️ Delhi 🫦 Russian Escorts FULL ...
 
The exim bank in power point presentation
The exim bank in  power point presentationThe exim bank in  power point presentation
The exim bank in power point presentation
 
CALL ON ➥8923113531 🔝Call Girls Fazullaganj Lucknow best sexual service
CALL ON ➥8923113531 🔝Call Girls Fazullaganj Lucknow best sexual serviceCALL ON ➥8923113531 🔝Call Girls Fazullaganj Lucknow best sexual service
CALL ON ➥8923113531 🔝Call Girls Fazullaganj Lucknow best sexual service
 
Call Girls in Friends Colony 9711199171 Delhi Enjoy Call Girls With Our Escorts
Call Girls in Friends Colony 9711199171 Delhi Enjoy Call Girls With Our EscortsCall Girls in Friends Colony 9711199171 Delhi Enjoy Call Girls With Our Escorts
Call Girls in Friends Colony 9711199171 Delhi Enjoy Call Girls With Our Escorts
 
Escort Service Call Girls In Shalimar Bagh, 99530°56974 Delhi NCR
Escort Service Call Girls In Shalimar Bagh, 99530°56974 Delhi NCREscort Service Call Girls In Shalimar Bagh, 99530°56974 Delhi NCR
Escort Service Call Girls In Shalimar Bagh, 99530°56974 Delhi NCR
 
Call Girls Service Green Park @9999965857 Delhi 🫦 No Advance VVIP 🍎 SERVICE
Call Girls Service Green Park @9999965857 Delhi 🫦 No Advance  VVIP 🍎 SERVICECall Girls Service Green Park @9999965857 Delhi 🫦 No Advance  VVIP 🍎 SERVICE
Call Girls Service Green Park @9999965857 Delhi 🫦 No Advance VVIP 🍎 SERVICE
 
Short-, Mid-, and Long-term gxxoals.pptx
Short-, Mid-, and Long-term gxxoals.pptxShort-, Mid-, and Long-term gxxoals.pptx
Short-, Mid-, and Long-term gxxoals.pptx
 
Preet Vihar (Delhi) 9953330565 Escorts, Call Girls Services
Preet Vihar (Delhi) 9953330565 Escorts, Call Girls ServicesPreet Vihar (Delhi) 9953330565 Escorts, Call Girls Services
Preet Vihar (Delhi) 9953330565 Escorts, Call Girls Services
 
Vip Call Girls Vasant Kunj ➡️ Delhi ➡️ 9999965857 No Advance 24HRS Live
Vip Call Girls Vasant Kunj ➡️ Delhi ➡️ 9999965857 No Advance 24HRS LiveVip Call Girls Vasant Kunj ➡️ Delhi ➡️ 9999965857 No Advance 24HRS Live
Vip Call Girls Vasant Kunj ➡️ Delhi ➡️ 9999965857 No Advance 24HRS Live
 
Call Girls 🫤 Nehru Place ➡️ 9999965857 ➡️ Delhi 🫦 Russian Escorts FULL ENJOY
Call Girls 🫤 Nehru Place ➡️ 9999965857  ➡️ Delhi 🫦  Russian Escorts FULL ENJOYCall Girls 🫤 Nehru Place ➡️ 9999965857  ➡️ Delhi 🫦  Russian Escorts FULL ENJOY
Call Girls 🫤 Nehru Place ➡️ 9999965857 ➡️ Delhi 🫦 Russian Escorts FULL ENJOY
 
Call Girls In Kalkaji 📱 9999965857 🤩 Delhi 🫦 HOT AND SEXY VVIP 🍎 SERVICE
Call Girls In Kalkaji 📱  9999965857  🤩 Delhi 🫦 HOT AND SEXY VVIP 🍎 SERVICECall Girls In Kalkaji 📱  9999965857  🤩 Delhi 🫦 HOT AND SEXY VVIP 🍎 SERVICE
Call Girls In Kalkaji 📱 9999965857 🤩 Delhi 🫦 HOT AND SEXY VVIP 🍎 SERVICE
 
Q3 FY24 Earnings Conference Call Presentation
Q3 FY24 Earnings Conference Call PresentationQ3 FY24 Earnings Conference Call Presentation
Q3 FY24 Earnings Conference Call Presentation
 
Collective Mining | Corporate Presentation - May 2024
Collective Mining | Corporate Presentation - May 2024Collective Mining | Corporate Presentation - May 2024
Collective Mining | Corporate Presentation - May 2024
 
@9999965857 🫦 Sexy Desi Call Girls Karol Bagh 💓 High Profile Escorts Delhi 🫶
@9999965857 🫦 Sexy Desi Call Girls Karol Bagh 💓 High Profile Escorts Delhi 🫶@9999965857 🫦 Sexy Desi Call Girls Karol Bagh 💓 High Profile Escorts Delhi 🫶
@9999965857 🫦 Sexy Desi Call Girls Karol Bagh 💓 High Profile Escorts Delhi 🫶
 
Russian Call Girls Kolkata Indira 🤌 8250192130 🚀 Vip Call Girls Kolkata
Russian Call Girls Kolkata Indira 🤌  8250192130 🚀 Vip Call Girls KolkataRussian Call Girls Kolkata Indira 🤌  8250192130 🚀 Vip Call Girls Kolkata
Russian Call Girls Kolkata Indira 🤌 8250192130 🚀 Vip Call Girls Kolkata
 
Call Girls In Vasant Kunj 📱 9999965857 🤩 Delhi 🫦 HOT AND SEXY VVIP 🍎 SERVICE
Call Girls In Vasant Kunj 📱  9999965857  🤩 Delhi 🫦 HOT AND SEXY VVIP 🍎 SERVICECall Girls In Vasant Kunj 📱  9999965857  🤩 Delhi 🫦 HOT AND SEXY VVIP 🍎 SERVICE
Call Girls In Vasant Kunj 📱 9999965857 🤩 Delhi 🫦 HOT AND SEXY VVIP 🍎 SERVICE
 
《加州大学圣克鲁兹分校学位证书复制》Q微信741003700美国学历疑难问题指南|挂科被加州大学圣克鲁兹分校劝退没有毕业证怎么办?《UCSC毕业证购买|加...
《加州大学圣克鲁兹分校学位证书复制》Q微信741003700美国学历疑难问题指南|挂科被加州大学圣克鲁兹分校劝退没有毕业证怎么办?《UCSC毕业证购买|加...《加州大学圣克鲁兹分校学位证书复制》Q微信741003700美国学历疑难问题指南|挂科被加州大学圣克鲁兹分校劝退没有毕业证怎么办?《UCSC毕业证购买|加...
《加州大学圣克鲁兹分校学位证书复制》Q微信741003700美国学历疑难问题指南|挂科被加州大学圣克鲁兹分校劝退没有毕业证怎么办?《UCSC毕业证购买|加...
 
OKC Thunder Reveal Game 2 Playoff T Shirts
OKC Thunder Reveal Game 2 Playoff T ShirtsOKC Thunder Reveal Game 2 Playoff T Shirts
OKC Thunder Reveal Game 2 Playoff T Shirts
 

Rodman renshaw report on amln 5 14-12

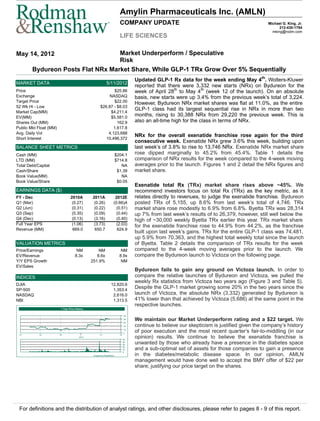
  • 1. Amylin Pharmaceuticals Inc. (AMLN) ® COMPANY UPDATE Michael G. King, Jr. 212-430-1794 mking@rodm.com LIFE SCIENCES May 14, 2012 Market Underperform / Speculative Risk Bydureon Posts Flat NRx Market Share, While GLP-1 TRx Grow Over 5% Sequentially Updated GLP-1 Rx data for the week ending May 4th. Wolters-Kluwer MARKET DATA 5/11/2012 reported that there were 3,332 new starts (NRx) on Bydureon for the Price $25.86 week of April 28th to May 4th (week 12 of the launch). On an absolute Exchange NASDAQ basis, new starts were up 3.4% from the previous week’s total of 3,224. Target Price $22.00 However, Bydureon NRx market shares was flat at 11.0%, as the entire 52 Wk Hi - Low $26.87 - $8.03 GLP-1 class had its largest sequential rise in NRx in more than two Market Cap(MM) $4,211.4 EV(MM) $5,581.0 months, rising to 30,388 NRx from 29,220 the previous week. This is Shares Out (MM) 162.9 also an all-time high for the class in terms of NRx. Public Mkt Float (MM) 1,617.8 Avg. Daily Vol 4,123,688 NRx for the overall exenatide franchise rose again for the third Short Interest 10,496,372 consecutive week. Exenatide NRx grew 3.6% this week, building upon BALANCE SHEET METRICS last week’s of 3.8% to rise to 13,746 NRx. Exenatide NRx market share Cash (MM) $204.1 rose dipped marginally to 45.2% from 45.4%. Table 1 details the LTD (MM) $714.8 comparison of NRx results for the week compared to the 4-week moving Total Debt/Capital NA averages prior to the launch. Figures 1 and 2 detail the NRx figures and Cash/Share $1.39 market share. Book Value(MM) NA Book Value/Share $0.05 Exenatide total Rx (TRx) market share rises above ~45%. We EARNINGS DATA ($) recommend investors focus on total Rx (TRx) as the key metric, as it FY - Dec 2010A 2011A 2012E relates directly to revenues, to judge the exenatide franchise. Bydureon Q1 (Mar) (0.27) (0.26) (0.66)A posted TRx of 5,155, up 8.6% from last week’s total of 4,746. TRx Q2 (Jun) (0.31) (0.22) (0.51) market share rose modestly to 6.9% from 6.8%. Byetta TRx was 28,314 Q3 (Sep) (0.35) (0.09) (0.44) up 7% from last week’s results of to 26,379, however, still well below the Q4 (Dec) (0.13) (3.16) (0.40) high of ~30,000 weekly Byetta TRx earlier this year. TRx market share Full Year EPS (1.06) (3.73) (2.03) for the exenatide franchise rose to 44.9% from 44.2%, as the franchise Revenue (MM) 669.0 650.7 624.9 built upon last week’s gains. TRx for the entire GLP-1 class was 74,481, up 5.9% from 70,363, and the highest total weekly total since the launch VALUATION METRICS of Byetta. Table 2 details the comparison of TRx results for the week Price/Earnings NM NM NM compared to the 4-week moving averages prior to the launch. We EV/Revenue 8.3x 8.6x 8.9x compare the Bydureon launch to Victoza on the following page. Y/Y EPS Growth 251.9% NM EV/Sales Bydureon fails to gain any ground on Victoza launch. In order to INDICES compare the relative launches of Bydureon and Victoza, we pulled the weekly Rx statistics from Victoza two years ago (Figure 3 and Table 5). DJIA 12,820.6 SP-500 1,353.4 Despite the GLP-1 market growing some 20% in the two years since the NASDAQ 2,616.0 launch of Victoza, the absolute NRx (3,332) generated by Bydureon is NBI 1,313.5 41% lower than that achieved by Victoza (5,686) at the same point in the respective launches. 1 Year Price History 30 25 20 We maintain our Market Underperform rating and a $22 target. We 15 continue to believe our skepticism is justified given the company’s history 10 5 of poor execution and the most recent quarter’s fair-to-middling (in our Q1 Q2 Q3 Q1 Q2 2012 50 opinion) results. We continue to believe the exenatide franchise is 40 30 unwanted by those who already have a presence in the diabetes space 20 10 and a sub-optimal set of assets for those companies to gain a presence 0 Created by BlueMatrix in the diabetes/metabolic disease space. In our opinion, AMLN management would have done well to accept the BMY offer of $22 per share; justifying our price target on the shares. For definitions and the distribution of analyst ratings, and other disclosures, please refer to pages 8 - 9 of this report.
  • 2. Amylin Pharmaceuticals Inc. May 14, 2012 Figure 1. NRx Absolute Figures by Week Figure 2. NRx Market Share by Week RODMAN & RENSHAW EQUITY RESEARCH 2
  • 3. Amylin Pharmaceuticals Inc. May 14, 2012 Figure 3. Comparison of Victoza and Bydureon Launches (Absolute NRx) Figure 4. Absolute TRx by Week RODMAN & RENSHAW EQUITY RESEARCH 3
  • 4. Amylin Pharmaceuticals Inc. May 14, 2012 Table 1. Changes in NRx from Week Ending 5/4/12 Vs. Moving Avgs. Prior to Bydureon Approval 4-week Moving Changes in NRx 5/4/2012 Variance Averages 1/27/2012 BYDUREON 3,332 3,332 BYETTA 11,412 10,414 (998) Total Exenetide Franchise 11,412 13,746 2,334 VICTOZA 15,063 16,642 1,579 TOTAL GLP-1 New Rx 26,475 30,388 3,913 Market Share % of NRx BYDUREON 11.0% 11.0% BYETTA 43.1% 34.3% -8.8% Total Exenetide % 43.1% 45.2% 2.1% VICTOZA 56.9% 54.8% -2.1% Table 2. Changes in TRx from Week Ending 5/4/12 Vs. Moving Avgs. Prior to Bydureon Approval 4-week Moving Changes in TRx 5/4/2012 Variance Averages 1/27/2012 BYDUREON 5,155 5,155 BYETTA 28,429 28,314 (115) Total Exenetide Franchise 28,429 33,469 5,041 VICTOZA 36,009 41,012 5,004 TOTAL GLP-1 Rx 64,437 74,481 10,044 Market Share % of TRx BYDUREON 6.9% 6.9% BYETTA 43.8% 38.0% -5.8% Total Exenetide % 43.8% 44.9% 1.1% VICTOZA 56.2% 55.1% -1.1% Upcoming Milestones Product Event Timing Corporate Annual meeting and proxy fight May 24, 2012 Bydureon Secure EU partner 2012 Metreleptin Potential EU orphan designation 1H12 Exenatide suspension Once-weekly Phase III initiation 2Q12/3Q12 Bydureon Launch pen/device 4Q12/1Q13 Exenatide suspension Once-monthly Phase III initiation 2013 RODMAN & RENSHAW EQUITY RESEARCH 4
  • 5. Amylin Pharmaceuticals Inc. May 14, 2012 Table 3. New Prescription Starts (NRx) for the GLP-1 Market by Week Total New Rx (NRx) Product 1/6/2012 1/13/2012 1/20/2012 1/27/2012 2/3/2012 2/10/2012 2/17/2012 2/24/2012 3/2/2012 3/9/2012 3/16/2012 3/23/2012 3/30/2012 4/6/2012 4/13/2012 4/20/2012 4/27/2012 5/4/2012 Week 1 2 3 4 5 6 7 8 9 10 11 12 BYDUREON TOTAL BYDUREON Rx 1 15 386 894 1,275 1,845 2,073 2,467 2,719 2,940 2,801 2,963 3,224 3,332 Sequential Growth 2473.33% 131.61% 42.62% 44.71% 12.36% 19.01% 10.21% 8.13% -4.73% 5.78% 8.81% 3.35% 4-wk Moving Avg. 134 324 643 1,100 1,522 1,915 2,276 2,550 2,732 2,856 2,982 3,080 BYETTA 10MCG/0.04 7,866 8,353 7,915 8,106 8,854 8,047 7,485 7,556 7,517 7,911 7,336 7,148 7,433 7,255 6,762 6,841 7,055 7,259 5MCG/0.02 3,198 3,403 3,394 3,413 3,569 3,465 3,199 3,158 3,274 3,486 3,189 3,173 3,141 3,089 2,872 2,974 2,987 3,155 TOTAL BYETTA Rx 11,064 11,756 11,309 11,519 12,423 11,512 10,684 10,714 10,791 11,397 10,525 10,321 10,574 10,344 9,634 9,815 10,042 10,414 Sequential Growth 18.78% 6.25% -3.80% 1.86% 7.85% -7.33% -7.19% 0.28% 0.72% 5.62% -7.65% -1.94% 2.45% -2.18% -6.86% 1.88% 2.31% 3.70% 4-wk Moving Avg. 10,550 10,745 10,861 11,412 11,752 11,691 11,535 11,333 10,925 10,897 10,857 10,759 10,704 10,441 10,218 10,092 9,959 9,976 TOTAL EXENETIDE FRANCHISE 11,064 11,756 11,309 11,519 12,424 11,527 11,070 11,608 12,066 13,242 12,598 12,788 13,293 13,284 12,435 12,778 13,266 13,746 Sequential Growth 18.78% 6.25% -3.80% 1.86% 7.86% -7.22% -3.96% 4.86% 3.95% 9.75% -4.86% 1.51% 3.95% -0.07% -6.39% 2.76% 3.82% 3.62% 4-wk Moving Avg. 10,550 10,745 10,861 11,412 11,752 11,695 11,635 11,657 11,568 11,997 12,379 12,674 12,980 12,991 12,950 12,948 12,941 13,056 ~ VICTOZA 2-PACK 5,010 5,301 5,214 5,162 5,615 5,389 5,303 5,334 5,431 5,711 5,381 5,467 5,356 5,306 5,527 5,719 5,539 5,654 3-PACK 9,626 9,944 9,927 10,067 10,472 10,439 10,382 9,958 10,330 11,012 10,101 10,417 10,422 10,247 9,944 10,484 10,415 10,988 TOTAL VICTOZA Rx 14,636 15,245 15,141 15,229 16,087 15,828 15,685 15,292 15,761 16,723 15,482 15,884 15,778 15,553 15,471 16,203 15,954 16,642 Sequential Growth 19.12% 4.16% -0.68% 0.58% 5.63% -1.61% -0.90% -2.51% 3.07% 6.10% -7.42% 2.60% -0.67% -1.43% -0.53% 4.73% -1.54% 4.31% 4-wk Moving Avg. 13,899 14,148 14,327 15,063 15,426 15,571 15,707 15,723 15,642 15,865 15,815 15,963 15,967 15,674 15,672 15,751 15,795 16,068 TOTAL GLP-1 NRx 25,700 27,001 26,450 26,748 28,511 27,355 26,755 26,900 27,827 29,965 28,080 28,672 29,071 28,837 27,906 28,981 29,220 30,388 Sequential Growth 18.97% 5.06% -2.04% 1.13% 6.59% -4.05% -2.19% 0.54% 3.45% 7.68% -6.29% 2.11% 1.39% -0.80% -3.23% 3.85% 0.82% 4.00% 4-wk Moving Avg. 24,448 24,893 25,188 26,475 27,178 27,266 27,342 27,380 27,209 27,862 28,193 28,636 28,947 28,665 28,622 28,699 28,736 29,124 % of NRx by Product Product 1/6/2012 1/13/2012 1/20/2012 1/27/2012 2/3/2012 2/10/2012 2/17/2012 2/24/2012 3/2/2012 3/9/2012 3/16/2012 3/23/2012 3/30/2012 4/6/2012 4/13/2012 4/20/2012 4/27/2012 5/4/2012 Week 1 2 3 4 5 6 7 8 9 10 11 12 BYDUREON 0.0% 0.0% 0.0% 0.0% 0.0% 0.1% 1.4% 3.3% 4.6% 6.2% 7.4% 8.6% 9.4% 10.2% 10.0% 10.2% 11.0% 11.0% BYETTA 43.1% 43.5% 42.8% 43.1% 43.6% 42.1% 39.9% 39.8% 38.8% 38.0% 37.5% 36.0% 36.4% 35.9% 34.5% 33.9% 34.4% 34.3% Total Exenetide % 43.1% 43.5% 42.8% 43.1% 43.6% 42.1% 41.4% 43.2% 43.4% 44.2% 44.9% 44.6% 45.7% 46.1% 44.6% 44.1% 45.4% 45.2% VICTOZA 56.9% 56.5% 57.2% 56.9% 56.4% 57.9% 58.6% 56.8% 56.6% 55.8% 55.1% 55.4% 54.3% 53.9% 55.4% 55.9% 54.6% 54.8% RODMAN & RENSHAW EQUITY RESEARCH 5
  • 6. Amylin Pharmaceuticals Inc. May 14, 2012 Table 4. Total Prescriptions (TRx) for the GLP-1 Market by Week GLP-1 Agonist - Total Rx (TRx) Product 1/6/2012 1/13/2012 1/20/2012 1/27/2012 2/3/2012 2/10/2012 2/17/2012 2/24/2012 3/2/2012 3/9/2012 3/16/2012 3/23/2012 3/30/2012 4/6/2012 4/13/2012 4/20/2012 4/27/2012 5/4/2012 Week 1 2 3 4 5 6 7 8 9 10 11 12 BYDUREON TOTAL BYDUREON Rx 1 15 387 903 1,284 1,881 2,235 2,797 3,291 3,702 3,775 4,247 4,746 5,155 Sequential Growth 133.33% 42.19% 46.50% 18.82% 25.15% 17.66% 12.49% 1.97% 12.50% 11.75% 8.62% 4-wk Moving Avg. Bydureon 134 327 647 1,114 1,576 2,049 2,551 3,006 3,391 3,754 4,118 4,481 BYETTA 10MCG/0.04 22,680 21,602 21,029 20,736 23,378 21,115 20,663 20,323 21,902 22,357 20,244 20,090 21,126 21,428 19,637 19,519 20,003 21,345 5MCG/0.02 7,145 6,893 6,911 6,718 7,446 6,982 6,729 6,539 7,107 7,222 6,629 6,666 6,864 6,887 6,119 6,330 6,376 6,969 TOTAL BYETTA Rx 29,825 28,495 27,940 27,454 30,824 28,097 27,392 26,862 29,009 29,579 26,873 26,756 27,990 28,315 25,756 25,849 26,379 28,314 Sequential Growth 10.27% -4.46% -1.95% -1.74% 12.28% -8.85% -2.51% -1.93% 7.99% 1.96% -9.15% -0.44% 4.61% 1.16% -9.04% 0.36% 2.05% 7.34% 4-wk Moving Avg. 28,465 28,504 28,327 28,429 28,678 28,579 28,442 28,294 27,840 28,211 28,081 28,054 27,800 27,484 27,204 26,978 26,575 26,575 TOTAL EXENETIDE FRANCHISE 29,825 28,495 27,940 27,454 30,825 28,112 27,779 27,765 30,293 31,460 29,108 29,553 31,281 32,017 29,531 30,096 31,125 33,469 Sequential Growth 10.27% -4.46% -1.95% -1.74% 12.28% -8.80% -1.18% -0.05% 9.10% 3.85% -7.48% 1.53% 5.85% 2.35% -7.76% 1.91% 3.42% 7.53% 4-wk Moving Avg. 28,465 28,504 28,327 28,429 28,679 28,583 28,543 28,620 28,487 29,324 29,657 30,104 30,351 30,490 30,596 30,731 30,692 31,055 VICTOZA 2-PACK 12,317 12,211 12,100 11,831 12,815 12,625 12,277 12,446 12,762 13,557 12,636 12,822 12,974 12,995 12,935 13,327 13,097 13,709 3-PACK 24,536 23,842 23,804 23,393 24,900 25,045 24,585 24,212 25,490 26,407 25,209 25,399 25,966 26,030 25,180 26,112 26,141 27,303 TOTAL VICTOZA Rx 36,853 36,053 35,904 35,224 37,715 37,670 36,862 36,658 38,252 39,964 37,845 38,221 38,940 39,025 38,115 39,439 39,238 41,012 Sequential Growth 11.49% -2.17% -0.41% -1.89% 7.07% -0.12% -2.14% -0.55% 4.35% 4.48% -5.30% 0.99% 1.88% 0.22% -2.33% 3.47% -0.51% 4.52% 4-wk Moving Avg. 35,358 35,510 35,466 36,009 36,224 36,628 36,868 37,226 37,361 37,934 38,180 38,571 38,743 38,508 38,575 38,880 38,954 39,451 TOTAL GLP-1 Rx 66,678 64,548 63,844 62,678 68,540 65,782 64,641 64,423 68,545 71,424 66,953 67,774 70,221 71,042 67,646 69,535 70,363 74,481 Sequential Growth 10.94% -3.19% -1.09% -1.83% 9.35% -4.02% -1.73% -0.34% 6.40% 4.20% -6.26% 1.23% 3.61% 1.17% -4.78% 2.79% 1.19% 5.85% 4-wk Moving Avg. 63,823 64,014 63,793 64,437 64,903 65,211 65,410 65,847 65,848 67,258 67,836 68,674 69,093 68,998 69,171 69,611 69,647 70,506 % of TRx by Product Product 1/6/2012 1/13/2012 1/20/2012 1/27/2012 2/3/2012 2/10/2012 2/17/2012 2/24/2012 3/2/2012 3/9/2012 3/16/2012 3/23/2012 3/30/2012 4/6/2012 4/13/2012 4/20/2012 4/27/2012 5/4/2012 Week 1 2 3 4 5 6 7 8 9 10 11 12 BYDUREON 0.00% 0.00% 0.00% 0.00% 0.00% 0.02% 0.60% 1.40% 1.87% 2.63% 3.34% 4.13% 4.69% 5.21% 5.58% 6.11% 6.75% 6.92% BYETTA 44.7% 44.1% 43.8% 43.8% 45.0% 42.7% 42.4% 41.7% 42.3% 41.4% 40.1% 39.5% 38.6% 39.9% 38.1% 37.2% 37.5% 38.0% Total Exenetide % 44.7% 44.1% 43.8% 43.8% 45.0% 42.7% 43.0% 43.1% 44.2% 44.0% 43.5% 43.6% 43.3% 45.1% 43.7% 43.3% 44.2% 44.9% VICTOZA 55.3% 55.9% 56.2% 56.2% 55.0% 57.3% 57.0% 56.9% 55.8% 56.0% 56.5% 56.4% 56.8% 54.9% 56.3% 56.7% 55.8% 55.1% RODMAN & RENSHAW EQUITY RESEARCH 6
  • 7. Amylin Pharmaceuticals Inc. May 14, 2012 Table 5. Comparison of Bydureon and Victoza Launches by NRx NRx by Week Since Launch 1 2 3 4 5 6 7 8 9 10 11 12 2/17/2012 2/24/2012 3/2/2012 3/9/2012 3/16/2012 3/23/2012 3/30/2012 4/6/2012 4/13/2012 4/20/2012 4/27/2012 5/4/2012 Bydureon 386 894 1,275 1,845 2,073 2,467 2,719 2,940 2,801 2,963 3,224 3,332 % Sequential Growth 131.6% 42.6% 44.7% 12.4% 19.0% 10.2% 8.1% -4.7% 5.8% 8.8% 3.3% 2/19/2010 2/26/2010 3/5/2010 3/12/2010 3/19/2010 3/26/2010 4/2/2010 4/9/2010 4/16/2010 4/23/2010 4/30/2010 4/30/2010 Victoza 411 1,057 1,465 2,234 2,540 3,153 3,605 3,809 4,346 4,742 5,214 5,686 % Sequential Growth 157.2% 38.6% 52.5% 13.7% 24.1% 14.3% 5.7% 14.1% 9.1% 10.0% 9.1% Bydureon Performance Relative to Victoza -15.4% -13.0% -17.4% -18.4% -21.8% -24.6% -22.8% -35.5% -37.5% -38.2% -41.4% RODMAN & RENSHAW EQUITY RESEARCH 7
  • 8. Amylin Pharmaceuticals Inc. May 14, 2012 RODMAN & RENSHAW RATING SYSTEM: Rodman & Renshaw employs a three tier rating system for evaluating both the potential return and risk associated with owning common equity shares of rated firms. The expected return of any given equity is measured on a RELATIVE basis of other companies in the same sector, as defined by First Call. The price objective is calculated to estimate the potential movement in price a given equity could achieve given certain targets are met over a defined time horizon. Price objectives are subject to exogenous factors including industry events and market volatility. The risk assessment evaluates the company specific risk and accounts for the following factors, maturity of market, maturity of technology, maturity of firm, cash utilization, and valuation considerations. Potential factors contributing to risk: relatively undefined market, new technologies, immature firm, high cash burn rates, intrinsic value weighted toward future earnings or events. RETURN ASSESSMENT q Market Outperform (Buy): The common stock of the company is expected to outperform a passive index comprised of all the common stock of companies within the same sector, as defined by First Call. q Market Perform (Hold): The common stock of the company is expected to mimic the performance of a passive index comprised of all the common stock of companies within the same sector, as defined by First Call. q Market Underperform (Sell): The common stock of the company is expected to underperform a passive index comprised of all the common stock of companies within the same sector, as defined by First Call. RISK ASSESSMENT q Speculative - The common stock risk level is significantly greater than market risk. The stock price of these equities is exceptionally volatile. q Aggressive - The common stock risk level is materially higher than market level risk. The stock price is typically more volatile than the general market. q Moderate - The common stock is moderately risky, or equivalent to stock market risk. The stock price volatility is typically in-line with movements in the general market. Rating and Price Target History for: Amylin Pharmaceuticals Inc. (AMLN) as of 05-11-2012 01/05/12 04/27/12 I:MU:$8 MU:$22 30 25 20 15 10 5 Q1 Q2 Q3 Q1 Q2 Q3 Q1 Q2 Q3 Q1 Q2 2010 2011 2012 Created by BlueMatrix RATING SUMMARY Distribution of Ratings Table IB Serv./Past 12 Mos Rating Count Percent Count Percent Market Outperform(MO) 73 62.39% 10 13.70% Market Perform(MP) 28 23.93% 3 10.71% Market Underperform(MU) 6 5.13% 0 0.00% Under Review(UR) 10 8.55% 3 30.00% Total 117 100% 16 100% Investment Banking Services include, but are not limited to, acting as a manager/co-manager in the underwriting or placement of securities, acting as financial advisor, and/or providing corporate finance or capital markets-related services to a company or one of its RODMAN & RENSHAW EQUITY RESEARCH 8
  • 9. Amylin Pharmaceuticals Inc. May 14, 2012 affiliates or subsidiaries within the past 12 months. ADDITIONAL DISCLOSURES Rodman & Renshaw, LLC. (the "Firm") is a member of FINRA and SIPC and a registered U.S. Broker-Dealer. ANALYST CERTIFICATION I, Michael G. King, Jr., hereby certify that the views expressed in this research report accurately reflect my personal views about the subject company(ies) and its (their) securities. None of the research analysts or the research analyst's household has a financial interest in the securities of Amylin Pharmaceuticals Inc. (including, without limitation, any option, right, warrant, future, long or short position). As of Apr 30 2012 neither the Firm nor its affiliates beneficially own 1% or more of any class of common equity securities of Amylin Pharmaceuticals Inc.. Neither the research analyst nor the Firm has any material conflict of interest with Amylin Pharmaceuticals Inc., of which the research analyst knows or has reason to know at the time of publication of this research report. The research analyst principally responsible for preparation of the report does not receive compensation that is based upon any specific investment banking services or transaction but is compensated based on factors including total revenue and profitability of the Firm, a substantial portion of which is derived from investment banking services. The Firm or its affiliates did not receive compensation from Amylin Pharmaceuticals Inc. for any investment banking services within twelve months before, but intends to seek compensation from the companies mentioned in this report for investment banking services within three months, following publication of the research report. Neither the research analyst nor any member of the research analyst's household nor the Firm serves as an officer, director or advisory board member of Amylin Pharmaceuticals Inc.. The Firm does make a market in Amylin Pharmaceuticals Inc. securities as of the date of this research report. Any opinions expressed herein are statements of our judgment as of the date of publication and are subject to change without notice. Reproduction without written permission is prohibited. The closing prices of securities mentioned in this report are as of May 11 2012. Additional information is available to clients upon written request. For complete research report on Amylin Pharmaceuticals Inc., please call (212) 356-0500. Readers are advised that this analysis report is issued solely for informational purposes and is not to be construed as an offer to sell or the solicitation of an offer to buy. The information contained herein is based on sources which we believe to be reliable but is not guaranteed by us as being accurate and does not purport to be a complete statement or summary of the available data. Past performance is no guarantee of future results. RODMAN & RENSHAW EQUITY RESEARCH 9