Large Vehicle Accidents by the Numbers [21 Data Driven Slides]
721P1_daic_revision3
1. Reference: "Dear Mona, Which State Has The Worst Drivers?" , Web. 2 Oct 2015.
Dai Chen Carnegie Mellon University Masters of Statistical Practice
Which State Has The Worst Drivers?
20
25
30
35
40
20
30
40
50
80
85
90
95
100
25
50
75
100
30000
40000
50000
60000
1980 1990 2000 2010
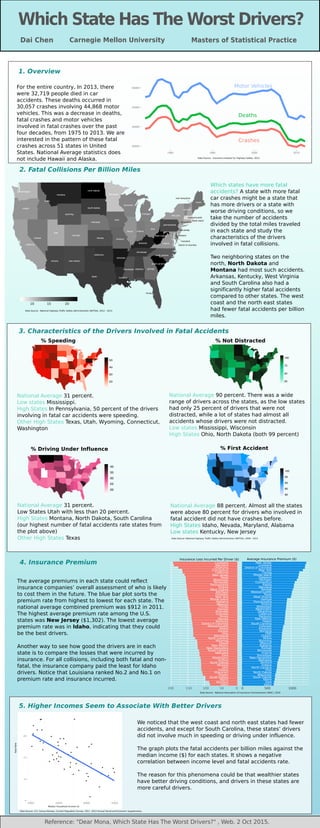
1. Overview
For the entire country, In 2013, there
were 32,719 people died in car
accidents. These deaths occurred in
30,057 crashes involving 44,868 motor
vehicles. This was a decrease in deaths,
fatal crashes and motor vehicles
involved in fatal crashes over the past
four decades, from 1975 to 2013. We are
interested in the pattern of these fatal
crashes across 51 states in United
States. National Average statistics does
not include Hawaii and Alaska.
Which states have more fatal
accidents? A state with more fatal
car crashes might be a state that
has more drivers or a state with
worse driving conditions, so we
take the number of accidents
divided by the total miles traveled
in each state and study the
characteristics of the drivers
involved in fatal collisions.
Two neighboring states on the
north, North Dakota and
Montana had most such accidents.
Arkansas, Kentucky, West Virginia
and South Carolina also had a
significantly higher fatal accidents
compared to other states. The west
coast and the north east states
had fewer fatal accidents per billion
miles.
10 15 20
alabama
arizona
arkansas
california
colorado
connecticut
delaware
district of columbia
florida
georgia
idaho
illinois indiana
iowa
kansas
kentucky
louisiana
maine
maryland
massachusetts
michigan
minnesota
mississippi
missouri
montana
nebraska
nevada
new jersey
new mexico
new york
north carolina
north dakota
ohio
oklahoma
oregon
pennsylvania
rhode island
south carolina
south dakota
tennessee
texas
utah
vermont
virginia
washington
west virginia
wisconsin
wyoming
new hampshire
Idaho
Iowa
Maine
South Dakota
Wisconsin
North Dakota
Ohio
North Carolina
Indiana
Vermont
Nebraska
New Hampshire
Tennessee
Virginia
Minnesota
Kansas
Alabama
Missouri
Wyoming
Illinois
Oregon
Utah
Montana
Arkansas
Colorado
South Carolina
Hawaii
New Mexico
Kentucky
California
Oklahoma
Washington
Mississippi
Arizona
Pennsylvania
Georgia
West Virginia
Texas
Massachusetts
Nevada
Maryland
Alaska
Connecticut
Michigan
Delaware
Rhode Island
Florida
New York
District of Columbia
Louisiana
New Jersey
Idaho
Montana
Maine
South Dakota
Oregon
Wisconsin
Indiana
Utah
Vermont
North Dakota
Arizona
Washington
Iowa
Nebraska
South Carolina
New Hampshire
New Mexico
Hawaii
Wyoming
North Carolina
Minnesota
Ohio
Kansas
Alaska
Massachusetts
District of Columbia
Kentucky
Nevada
Illinois
Colorado
Arkansas
Georgia
Florida
Missouri
Alabama
Rhode Island
New York
Delaware
Michigan
West Virginia
Virginia
Pennsylvania
Tennessee
Mississippi
Texas
New Jersey
California
Connecticut
Oklahoma
Maryland
Louisiana
200 150 100 50 0 0 500 1000
5
10
15
20
40000 50000 60000 70000
5. Higher Incomes Seem to Associate With Better Drivers
4. Insurance Premium
% Speeding % Not Distracted
2. Fatal Collisions Per Billion Miles
3. Characteristics of the Drivers Involved in Fatal Accidents
National Average 31 percent.
Low states Mississippi.
High States In Pennsylvania, 50 percent of the drivers
involving in fatal car accidents were speeding.
Other High States Texas, Utah, Wyoming, Connecticut,
Washington
National Average 31 percent.
Low States Utah with less than 20 percent.
High States Montana, North Dakota, South Carolina
(our highest number of fatal accidents rate states from
the plot above)
Other High States Texas
National Average 88 percent. Almost all the states
were above 80 percent for drivers who involved in
fatal accident did not have crashes before.
High States Idaho, Nevada, Maryland, Alabama
Low states Kentucky, New Jersey
National Average 90 percent. There was a wide
range of drivers across the states, as the low states
had only 25 percent of drivers that were not
distracted, while a lot of states had almost all
accidents whose drivers were not distracted.
Low states Mississippi, Wisconsin
High States Ohio, North Dakota (both 99 percent)
We noticed that the west coast and north east states had fewer
accidents, and except for South Carolina, these states’ drivers
did not involve much in speeding or driving under influence.
The graph plots the fatal accidents per billion miles against the
median income ($) for each states. It shows a negative
correlation between income level and fatal accidents rate.
The reason for this phenomena could be that wealthier states
have better driving conditions, and drivers in these states are
more careful drivers.
The average premiums in each state could reflect
insurance companies’ overall assessment of who is likely
to cost them in the future. The blue bar plot sorts the
premium rate from highest to lowest for each state. The
national average combined premium was $912 in 2011.
The highest average premium rate among the U.S.
states was New Jersey ($1,302). The lowest average
premium rate was in Idaho, indicating that they could
be the best drivers.
Another way to see how good the drivers are in each
state is to compare the losses that were incurred by
insurance. For all collisions, including both fatal and non-
fatal, the insurance company paid the least for Idaho
drivers. Notice that Louisiana ranked No.2 and No.1 on
premium rate and insurance incurred.
Motor Vehicles
Deaths
Crashes
Data Source: U.S. Census Bureau, Current Population Survey, 2011 -2013 Annual Social and Economic Supplements.
Data Source: National Association of Insurance Commissioners (NAIC), 2010
Data Source: National Highway Traffic Safety Administration (NHTSA), 2009 - 2013
Data Source: National Highway Traffic Safety Administration (NHTSA), 2012 - 2013
Data Source: Insurance Institute for Highway Safety, 2013
Insurance Loss Incurred Per Driver ($) Average Insurance Premium ($)
Median Household Income ($)
FatalRate
% Driving Under Influence % First Accident