California Drought Update - Mike Anderson, California State Climatologist, California Department of Water Resources
•Als PPTX, PDF herunterladen•
2 gefällt mir•1,527 views

Thursday - USDroughtForum

Empfohlen
Empfohlen
Weitere ähnliche Inhalte
Was ist angesagt?
Was ist angesagt? (20)
Andere mochten auch
Andere mochten auch (12)
Ähnlich wie California Drought Update - Mike Anderson, California State Climatologist, California Department of Water Resources
Ähnlich wie California Drought Update - Mike Anderson, California State Climatologist, California Department of Water Resources (20)
Mehr von DRIscience
Mehr von DRIscience (9)
Kürzlich hochgeladen
Kürzlich hochgeladen (20)
California Drought Update - Mike Anderson, California State Climatologist, California Department of Water Resources
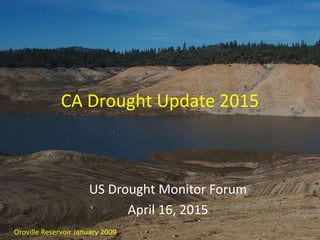
- 1. CA Drought Update 2015 US Drought Monitor Forum April 16, 2015 Oroville Reservoir January 2009
- 2. Presentation Overview • Current Drought Conditions • Variability Folsom Reservoir January 2014
- 3. California’s topography affects our weather and climate
- 4. 0 10 20 30 40 50 60 70 80 50 51 52 53 54 55 56 57 58 AnnualPrecipitation(inches) Annual Average Temperature (deg F) 1895-2000 21st Century POR Average 2 Source: NOAA Climate Division 2 Calendar Year Data 2014 It’s Getting Warmer 2013 2012
- 5. April –July Runoff (million acre-feet) WaterYearRunoff(millionacre-feet) 21st Century Droughts on the Sacramento River 1976 2 0 5 10 15 20 25 30 35 40 0 2 4 6 8 10 12 14 16 20th Century 21st Century POR Average 5 of 20 lowest April-July flows since 2001
- 6. 0 5 10 15 20 25 30 35 40 45 52 53 54 55 56 57 58 59 60 61 AnnualPrecipitation(inches) Annual Average Temperature (deg F) 1895-2000 21st Century POR Average 2 Source: NOAA Climate Division 5 Calendar Year Data 2014 2013 5 It’s Getting Warmer 2012
- 7. April –July Runoff (million acre-feet) WaterYearRunoff(millionacre-feet) 21st Century Droughts on the San Joaquin River 1976 2 5 of 20 lowest April-July flows since 2001 0 2 4 6 8 10 12 14 16 0 2 4 6 8 10 1901-2000 2001-2014 POR Average
- 14. Worst April 1 Snowpacks 2015 5 percent 2014 25 1977 25 1988 29 1976 37 2007 39 2013 42 1963 45 1990 45 1994 52 2012 52
- 15. Year to Year Precipitation Variability Dettinger et al, 2011 Std Dev of Annual Precipitation Mean Annual Precipitation California precipitation is uniquely variable Higher values are higher variability
- 16. 0 10 20 30 40 50 60 70 1900 1910 1920 1930 1940 1950 1960 1970 1980 1990 2000 Los Angeles County Sonoma Mendocino 8 Station Index 5 Station Index Decadal Scale Variability
- 17. Comparison of WSI - Sacramento Water Year Type 1924-1938 21st Century W 2 2 AN 1 2 BN 3 3 D 4 5 C 5 3 Includes forecast of critical for 2015
- 18. Comparison of Runoff – Sacramento 21st Century Oct-Mar Apr-Jul WY Max 18.06 13.09 32.09 Average 8.66 6.08 15.48 Min 4.29 2.6 7.47 1923-1940 Oct-Mar Apr-Jul WY Max 17.96 12.93 31.83 Average 7.63 5.87 14.13 Min 3.27 1.94 5.74 Units are Million Acre-Feet
- 19. * From tree rings 18.6 8.7* 12.0 11.2 9.8 13.1 12.4 6.7 10.0 11.2 10.4 0 5 10 15 20 WY Average 1578-1580 1918-1920 1924-1926 1929-1934 1947-1950 1959-1961 1976-1977 1987-1992 2007-2009 2012-2014 SACRAMENTO FOUR RIVER RUNOFF COMPARISON WITH PREVIOUS DROUGHTS Average Annual Drought Period Runoff in Million Acre-Feet
- 20. Comparison of WSI - San Joaquin Water Year Type 1924-1938 21st Century W 2 3 AN 4 1 BN 2 2 D 2 4 C 5 5 Includes forecast of critical for 2015
- 21. Comparison of Runoff – San Joaquin 21st Century Oct-Mar Apr-Jul WY Max 3.68 7.37 10.99 Average 1.55 3.41 5.08 Min 0.46 1.21 1.72 1924-1938 Oct-Mar Apr-Jul WY Max 3.58 7.33 11.24 Average 1.33 3.38 4.80 Min 0.45 1.03 1.5 Units are Million Acre-Feet
- 22. * From tree rings 6.0 2.3* 4.3 3.5 3.3 4.0 2.7 1.5 2.7 3.7 2.5 0 2 4 6 WY Average 1653-1655 1918-1920 1924-1926 1929-1934 1947-1950 1959-1961 1976-1977 1987-1992 2007-2009 2012-2014 SAN JOAQUIN FOUR RIVER RUNOFF COMPARISON WITH PREVIOUS DROUGHTS Average Annual Drought Period Runoff in Million Acre-Feet
- 23. Storm Track changes Flooding & water supply MJO/Tropical Convection ENSO Polar Processes Key Phenomena Affecting California Water Supply/Flooding: Easterly Wave Cyclogensis L The size of the AR results from the alignment of key processes The absence of AR activity important to drought
- 24. Summarizing Thoughts • 21st century droughts have shown record setting characteristics and are warmer than 20th century counterparts • Atmospheric river events provide significant inputs into annual precipitation totals – fewer such events in drought years
- 25. Conclusions • The expectation of increased variability means new extremes and extreme transitions with past few years serving as an example. • Planning for future droughts can take advantage of information in the historical record including paleo reconstructions. The trick will be to increase our understanding of causal mechanisms and watershed condition/response.