SlideShare ist ein Scribd-Unternehmen logo
1 von 34
Downloaden Sie, um offline zu lesen
Divulgação dos
resultados 2T22
Divulgação dos
resultados 3T22
São Paulo, 09 de novembro de 2022 – A Ultrapar Participações S.A. (“Companhia” ou “Ultrapar”, B3: UGPA3 /
NYSE: UGP), com atuação em energia e infraestrutura por meio da Ipiranga, Ultragaz e Ultracargo, anuncia
hoje seus resultados do terceiro trimestre de 2022.
Operações
continuadas
Receita líquida EBITDA Ajustado recorrente² Investimentos
R$ 39
bilhões
R$ 890
milhões
R$ 524
milhões
Visão
pró-forma¹
EBITDA Ajustado recorrente² Lucro líquido
Fluxo de caixa das
operações
R$ 893
milhões
R$ 83
milhões
R$ 1,3
bilhão
¹ Considera a soma das operações continuadas e descontinuadas
² Ajustes contábeis e itens não recorrentes descritos na tabela de cálculo do EBITDA – página 2
Principais destaques
• Crescimento de EBITDA de todos os principais negócios do Grupo.
• Redução da alavancagem financeira para 1,9x, menor patamar dos últimos 5 anos, reflexo das vendas
da Oxiteno e da Extrafarma neste ano, do crescimento de EBITDA nas operações continuadas e da
liberação de capital de giro no 3T22.
• Revisão da perspectiva de rating da Ultrapar de negativa para estável pela Moody’s, refletindo a melhora
da estrutura de capital com redução da dívida líquida, e perspectivas de recuperação de rentabilidade
com a evolução dos resultados.
• Aprovação, pelo Conselho de Administração, de CAPEX adicional para Ipiranga no valor de R$ 265
milhões em 2022, em função de maiores oportunidades de embandeiramento de postos.
• Aquisição da Stella, plataforma de tecnologia que conecta geradores de energia elétrica distribuída
renovável e clientes, marcando a entrada da Ultragaz no segmento de energia elétrica, em linha com a
estratégia de ampliar a oferta de soluções energéticas para os clientes, potencializando a captura de
valor por meio de sua capilaridade, força comercial, marca e vasta base de clientes empresariais e
residenciais.
2
3° TRIMESTRE DE 2022
2
Considerações sobre as informações financeiras e operacionais
Em maio e agosto de 2021 foram assinados os contratos de venda da Extrafarma e da Oxiteno, respectivamente,
conforme Fatos Relevantes divulgados na época. Em 31 de dezembro de 2021, a Ultrapar classificou estes negócios
como ativos e passivos mantidos para venda e operações descontinuadas. A Oxiteno teve sua venda concluída em
01 de abril de 2022, e por essa razão deixou de compor as operações descontinuadas e os resultados da Ultrapar a
partir do 2T22. Já a Extrafarma teve sua venda concluída em 01 de agosto de 2022, e seu resultado até esta data é
demonstrado dentro de operações descontinuadas. Neste relatório as informações financeiras referentes à Ultrapar
correspondem às informações consolidadas (pró-forma) da Companhia, isto é, os dados consideram a soma das
operações continuadas e descontinuadas, exceto quando indicado de outra forma.
As informações financeiras apresentadas neste documento foram extraídas das informações contábeis intermediárias
(“Informações Trimestrais”) para o período de três meses findo em 30 de setembro de 2022, e preparadas de acordo
com o pronunciamento técnico CPC 21 (R1) - Demonstração Intermediária e com a norma internacional IAS 34 -
“Interim Financial Reporting”, emitida pelo “International Accounting Standards Board - IASB”, e apresentadas de
forma condizente com as normas expedidas pela CVM, aplicáveis à elaboração das Informações Trimestrais. As
informações da Ultragaz, Ultracargo, Oxiteno, Ipiranga e Extrafarma são apresentadas sem eliminação de transações
realizadas entre segmentos. Portanto, a soma de tais informações pode não corresponder às informações
consolidadas (pró-forma) da Ultrapar. Adicionalmente, as informações financeiras e operacionais incluídas nesta
discussão de resultados são sujeitas a arredondamentos e, como consequência, os valores totais apresentados nas
tabelas e gráficos podem diferir da agregação numérica direta dos valores que os precedem. As informações
denominadas EBITDA (Lucro Antes dos Juros, Impostos sobre a Renda e Contribuição Social sobre o Lucro Líquido,
Depreciação e Amortização – LAJIDA); EBITDA Ajustado – ajustado pela amortização de ativos de contratos com
clientes – direitos de exclusividade e pelo resultado de cash flow hedge dos bonds; EBITDA Ajustado recorrente –
ajustado por efeitos não recorrentes; e EBIT (Lucro Antes dos Juros e Impostos sobre a Renda e Contribuição Social
sobre o Lucro Líquido – LAJIR) estão apresentadas de acordo com a Instrução 527 emitida pela CVM em 04 de
outubro de 2012. Segue o cálculo do EBITDA a partir do lucro líquido:
R$ milhões 3T22 3T21 2T22 9M22 9M21
Lucro líquido 82,6 374,3 459,9 1.003,7 493,4
(+) IR e contribuição social 27,1 (108,0) 133,2 219,2 47,9
(+) Despesa (receita) financeira líquida 328,1 296,0 509,6 1.195,7 632,4
(+) Depreciação e amortização 272,3 346,1 288,9 924,3 1.014,5
(+) Efeito líquido da cessação de depreciação - - (13,5) (78,5) -
EBITDA 710,2 908,4 1.378,1 3.264,4 2.188,3
Ajustes contábeis
(+) Amortização de ativos de contratos com clientes - direitos de exclusividade (Ipiranga) 127,9 70,5 115,9 332,2 198,6
(+) Amortização de ativos de contratos com clientes - direitos de exclusividade (Ultragaz) 0,4 0,4 0,4 1,1 1,2
(+) Resultado de cash flow hedge dos bonds (Oxiteno) - 38,0 - 48,1 129,0
EBITDA Ajustado 838,4 1.017,3 1.494,4 3.645,8 2.517,1
EBITDA Ajustado das operações continuadas 939,3 651,0 1.189,0 3.027,2 2.017,0
Ultragaz 332,4 220,5 261,0 806,6 507,2
Ultracargo 136,3 102,1 129,6 379,8 294,8
Ipiranga 532,7 398,1 840,0 1.992,2 1.382,9
Holding, abastece aí e demais empresas (62,5) (71,8) (42,4) (155,4) (175,6)
Eliminações 0,3 2,2 0,9 3,9 7,6
EBITDA Ajustado das operações descontinuadas (100,9) 366,3 305,4 618,6 500,1
Oxiteno - 351,5 - 396,2 852,2
Extrafarma (64,2) 17,0 17,0 (26,6) (344,5)
Ganho de capital com a venda da Oxiteno - - 289,2 289,2 -
Ajustes da venda da Oxiteno (31,6) - - (31,6) -
Ajustes da venda da Extrafarma (4,7) - - (4,7) -
Eliminações (0,3) (2,2) (0,9) (3,9) (7,6)
Efeitos não recorrentes que afetaram EBITDA
(-) Resultado na venda de bens (Ipiranga) (49,3) (17,9) (53,0) (128,2) (55,4)
(-) Créditos tributários extemporâneos (Ipiranga) - (37,9) (32,7) (32,7) (134,8)
(-) Créditos tributários extemporâneos (Oxiteno) - - - (62,4) -
(-) Ganho de capital com a venda da Oxiteno - - (289,2) (289,2) -
(+) Ajustes da venda da Oxiteno 31,6 - - 31,6 -
(+) Impairment (Extrafarma) - - - - 394,7
(+) Provisões de despesas pré-fechamento (Extrafarma) 67,4 - - 67,4 -
(+) Ajustes da venda da Extrafarma 4,7 - - 4,7 -
EBITDA Ajustado recorrente 892,8 961,5 1.119,5 3.236,9 2.721,5
EBITDA Ajustado recorrente das operações continuadas 890,0 595,2 1.103,3 2.866,3 1.826,7
Ultragaz 332,4 220,5 261,0 806,6 507,2
Ultracargo 136,3 102,1 129,6 379,8 294,8
Ipiranga 483,4 342,3 754,3 1.831,3 1.192,6
Holding, abastece aí e demais empresas (62,5) (71,8) (42,4) (155,4) (175,6)
Eliminações 0,3 2,2 0,9 3,9 7,6
EBITDA Ajustado recorrente das operações descontinuadas 2,8 366,3 16,1 370,7 894,8
Oxiteno - 351,5 - 333,9 852,2
Extrafarma 3,1 17,0 17,0 40,7 50,2
Eliminações (0,3) (2,2) (0,9) (3,9) (7,6)
Trimestre Acumulado
3
3° TRIMESTRE DE 2022
3
Ultrapar
¹ Itens não recorrentes descritos na tabela de cálculo do EBITDA – página 2
² Inclui amortização de ativos de contratos com clientes – direitos de exclusividade
³ Inclui resultado do cash flow hedge dos bonds até o 1T22
4 Inclui R$ 32 milhões e R$ 29 milhões da outorga do terminal de Vila do Conde da Ultracargo no 1T22 e 1T21, respectivamente, R$ 16 milhões da
outorga do terminal de Belém da Ipiranga no 2T22 e R$ 12 milhões da outorga da base de Vitória na Ipiranga no 3T22
Receita líquida – Total de R$ 39.484 milhões (+24% vs 3T21 e +6% vs 2T22), em função do aumento na receita líquida
em todos os negócios, principalmente na Ipiranga, parcialmente compensado pelos desinvestimentos da Oxiteno e
da Extrafarma e subsequentes desconsolidações dos seus resultados em abril e agosto de 2022, respectivamente.
EBITDA Ajustado recorrente - Op. continuadas – Total de R$ 890 milhões (+50% vs 3T21), devido aos maiores EBITDAs da
Ultragaz, Ipiranga e Ultracargo. Em relação ao 2T22, o EBITDA Ajustado recorrente das operações continuadas reduziu
19%, em função do menor EBITDA da Ipiranga, atenuado pelos maiores EBITDAs da Ultragaz e Ultracargo.
EBITDA Ajustado recorrente - Op. descontinuadas – Total de R$ 3 milhões (-99% vs 3T21 e -83% vs 2T22), fruto
principalmente da desconsolidação dos resultados da Oxiteno e da Extrafarma.
Depreciação e amortização – Total de R$ 401 milhões (-4% vs 3T21 e -1% vs 2T22), em função da desconsolidação dos
resultados da Oxiteno e da Extrafarma, parcialmente compensada por maiores investimentos realizados ao longo
dos últimos 12 meses e por maiores amortizações de bonificações na Ipiranga.
Resultado da Holding, abastece aí e demais empresas – A Ultrapar registrou um resultado negativo de R$ 62 milhões
em Holding, abastece aí e demais empresas, composto de (i) R$ 45 milhões de EBITDA negativo com a Holding, (ii) R$
15 milhões de EBITDA negativo com o abastece aí, devido a despesas com pessoal e tecnologia, e (iii) R$ 2 milhões
de EBITDA negativo com as demais empresas.
Resultado financeiro – A Ultrapar apresentou despesa financeira líquida de R$ 328 milhões no 3T22, melhora de R$ 6
milhões quando comparado ao 3T21, reflexo do resultado negativo de R$ 40 milhões de marcação a mercado dos
hedges neste 3T22 comparado ao resultado negativo de R$ 146 milhões no 3T21, atenuado (i) pelo efeito no 3T21 da
apropriação de juros sobre créditos tributários extraordinários referentes à exclusão do ICMS da base de cálculo do
PIS/Cofins no valor de R$ 60 milhões; e (ii) pelo maior CDI, apesar do menor saldo médio e menor custo da dívida
líquida. Em relação ao 2T22, período cuja despesa financeira líquida foi de R$ 510 milhões, a diferença é explicada
principalmente pelo menor efeito negativo de marcação a mercado dos hedges dos bonds.
Lucro líquido – Total de R$ 83 milhões (-78% vs 3T21), explicado pelo efeito no 3T21 da reversão de IR sobre a correção
SELIC de créditos tributários de R$ 196 milhões e por ajustes de fechamento dos desinvestimentos da Oxiteno e da
Extrafarma no 3T22, atenuados pelo maior EBITDA das operações continuadas. Em relação ao 2T22, o lucro líquido
apresentou redução de 82%, decorrente principalmente do ganho de capital com a venda da Oxiteno registrado
no 2T22 e do menor EBITDA da Ipiranga no 3T22.
Fluxo de caixa gerado pelas atividades operacionais – Geração de R$ 1,3 bilhão no 3T22, comparada a uma geração
de R$ 604 milhões no 3T21, devido à liberação de caixa em capital de giro, em função das reduções de preços de
combustíveis ao longo do 3T22 e da gestão de estoque, apesar do menor EBITDA.
Valores em R$ milhões 3T22 3T21 2T22
Δ Δ
9M22 9M21
Δ
3T22 v 3T21 3T22 v 2T22 9M22 v 9M21
Receita líquida 39.484 31.911 37.425 24% 6% 110.945 84.387 31%
EBITDA Ajustado 838 1.017 1.494 (18%) (44%) 3.646 2.517 45%
EBITDA Ajustado recorrente¹ 893 962 1.119 (7%) (20%) 3.237 2.722 19%
EBITDA Ajustado recorrente - Op.
continuadas
890 595 1.103 50% (19%) 2.866 1.827 57%
EBITDA Ajustado recorrente - Op.
descontinuadas
3 366 16 (99%) (83%) 371 895 (59%)
Depreciação e amortização² 401 417 405 (4%) (1%) 1.258 1.214 4%
Resultado financeiro³ (328) (334) (510) 2% 36% (1.244) (761) (63%)
Lucro líquido 83 374 460 (78%) (82%) 1.004 493 103%
Investimentos4 525 491 412 7% 28% 1.319 1.183 12%
Fluxo de caixa das operações 1.293 604 376 114% 243% 486 1.882 (74%)
4
3° TRIMESTRE DE 2022
4
Ultragaz
Desempenho operacional – O volume vendido da Ultragaz no 3T22 apresentou queda de 1% em relação ao 3T21,
fruto da redução de 3% nas vendas do segmento envasado, em função da menor demanda do mercado. Já o
segmento granel apresentou crescimento de 5%, devido principalmente a maiores vendas de gases especiais e para
comércios e serviços. Em relação ao 2T22, o volume vendido foi 6% maior, reflexo da sazonalidade típica entre os
períodos.
Receita líquida – Total de R$ 3.068 milhões (+14% vs 3T21), em função dos repasses dos aumentos de custo de GLP,
atenuados pelo menor volume de vendas. Em relação ao 2T22, houve aumento de 4%, fruto principalmente do maior
volume de vendas.
Custo dos produtos vendidos – Total de R$ 2.605 milhões (+11% vs 3T21), devido aos reajustes de custo de GLP pela
Petrobras e a maiores gastos com fretes e logística, em função do maior preço do diesel, e pessoal (dissídio). Em
relação ao 2T22, o custo dos produtos vendidos apresentou aumento de 2%, fruto principalmente do maior volume
de vendas e de maiores gastos com fretes e pessoal.
Despesas gerais, administrativas e de vendas – Total de R$ 209 milhões (+20% vs 3T21), reflexo das maiores despesas
com pessoal (principalmente maior remuneração variável, alinhada à progressão de resultados, e dissídio) e maior
comissionamento de vendas. Em relação ao 2T22, as despesas gerais, administrativas e de vendas aumentaram 1%,
devido a maiores despesas com pessoal e comissionamento de vendas, atenuadas por menores provisões para
créditos de liquidação duvidosa.
EBITDA Ajustado – A Ultragaz alcançou patamar recorde de EBITDA de R$ 332 milhões (+51% vs 3T21), decorrente de
melhores margens, fruto de iniciativas de aumento de eficiência e produtividade e de melhor mix de vendas, apesar
de maiores despesas. Em relação ao 2T22, o crescimento foi de 27%, em função do maior volume de vendas e de
melhores margens.
Investimentos – Foram investidos R$ 90 milhões neste trimestre, direcionados principalmente à aquisição e reposição
de vasilhames, às instalações em clientes no segmento granel e à manutenção das operações existentes.
3T22 3T21 2T22
Δ Δ
9M22 9M21
Δ
3T22 v 3T21 3T22 v 2T22 9M22 v 9M21
Volume total (mil tons) 451 453 425 (1%) 6% 1.275 1.298 (2%)
Envasado 294 304 281 (3%) 5% 839 876 (4%)
Granel 157 149 144 5% 9% 436 421 3%
EBITDA Ajustado (R$ milhões) 332 220 261 51% 27% 807 507 59%
Margem EBITDA Ajustado (R$/ton) 738 486 614 52% 20% 633 391 62%
5
3° TRIMESTRE DE 2022
5
Ultracargo
1 Média mensal
Desempenho operacional – A capacidade estática média da Ultracargo aumentou 9% em relação ao 3T21, fruto do
início das operações do terminal em Vila do Conde e da expansão de capacidade em Itaqui. O m³ faturado
apresentou crescimento de 12%, com maior movimentação de combustíveis em Itaqui e início das operações em
Vila do Conde. Em relação ao 2T22, o m³ faturado aumentou 1%, devido à maior movimentação de combustíveis em
Itaqui e ao ramp up das operações em Vila do Conde, atenuados pela menor movimentação em Santos.
Receita líquida – Total de R$ 225 milhões (+26% vs 3T21), em função de reajustes contratuais e do maior m³ faturado
advindo principalmente de Itaqui e Vila do Conde. Em comparação ao 2T22, a receita líquida aumentou 4%, pelos
mesmos motivos citados anteriormente.
Custo dos serviços prestados – Total de R$ 81 milhões (+17% vs 3T21), com cerca de 80% do incremento referente a
custos e depreciação do terminal de Vila do Conde (início das operações em dezembro de 2021), e o restante
decorrente do aumento da depreciação, fruto das expansões de capacidade em Itaqui e dos investimentos
realizados nos últimos 12 meses, além do efeito inflacionário sobre pessoal e insumos. Em relação ao 2T22, o custo dos
serviços prestados apresentou redução de 8%, em função da menor depreciação e de menores gastos com pessoal
e insumos.
Despesas gerais, administrativas e de vendas – Total de R$ 39 milhões (+20% vs 3T21), fruto de maiores despesas com
pessoal (principalmente maior remuneração variável, em linha com a progressão de resultados, e dissídio) e estudos
de engenharia, atenuados por ganhos de produtividade e eficiência. Em relação ao 2T22, as despesas gerais,
administrativas e de vendas aumentaram 13%, decorrente de maiores despesas com pessoal e estudos de
engenharia.
EBITDA Ajustado – A Ultracargo alcançou patamar recorde de EBITDA de R$ 136 milhões (+34% vs 3T21), em função
das expansões de capacidade com ganhos de rentabilidade, de reajustes contratuais e de ganhos de produtividade
e eficiência. Em relação ao 2T22, o crescimento foi de 5%, devido principalmente a reajustes contratuais e menores
custos, atenuados por maiores despesas.
Investimentos – Os investimentos no período foram de R$ 72 milhões, direcionados a projetos para ganho de
eficiência, manutenção e segurança operacional dos terminais.
3T22 3T21 2T22 Δ Δ 9M22 9M21 Δ
3T22 v 3T21 3T22 v 2T22 9M22 v 9M21
Capacidade estática¹ (mil m³) 955 878 955 9% 0% 955 860 11%
m³ faturado (mil m³) 3.445 3.089 3.411 12% 1% 10.076 9.381 7%
EBITDA Ajustado (R$ milhões) 136 102 130 34% 5% 380 295 29%
Margem EBITDA Ajustado (%) 61% 57% 60% 3 p.p. 1 p.p. 59% 56% 3 p.p.
6
3° TRIMESTRE DE 2022
6
Ipiranga
¹ Óleos combustíveis, arla 32, querosene, lubrificantes e graxas
Desempenho operacional – O volume vendido da Ipiranga apresentou crescimento de 3% em relação ao 3T21, com
aumento de 4% no diesel e 2% no ciclo Otto. Em comparação ao 2T22, o volume foi 7% maior, em função do crescimento
de 8% no ciclo Otto e 6% no diesel, fruto principalmente da sazonalidade típica entre os períodos.
Receita líquida – Total de R$ 35.999 milhões (+35% vs 3T21), devido aos repasses dos aumentos de custo dos produtos
derivados de petróleo e etanol, e do maior volume de vendas. Em relação ao 2T22, a receita líquida cresceu 7%, fruto
do maior volume de vendas, apesar das reduções de preços dos combustíveis ao longo do 3T22.
Custo dos produtos vendidos – Total de R$ 35.004 milhões (+35% vs 3T21), em função dos maiores custos dos produtos
derivados de petróleo e do etanol, devido ao crescimento dos preços internacionais nos últimos 12 meses, além do
maior volume de vendas. Em relação ao 2T22, houve aumento de 8%, fruto principalmente do maior volume de
vendas, atenuado pelas reduções de preços dos combustíveis ao longo do 3T22.
Despesas gerais, administrativas e de vendas – Total de R$ 590 milhões (+8% vs 3T21), devido a maiores despesas com
fretes (aumento do preço do diesel e maior volume de vendas), pessoal (principalmente maior remuneração variável,
alinhada à progressão de resultados e dissídio), e operação própria da AmPm, parcialmente compensadas por
maiores reversões de créditos de liquidação duvidosa. Em relação ao 2T22, as despesas gerais, administrativas e de
vendas apresentaram redução de 9%, em função de maiores reversões de créditos de liquidação duvidosa e
menores contingências.
Outros resultados operacionais – Total de R$ 176 milhões negativos, piora de R$ 181 milhões em relação ao 3T21, fruto
de gastos com CBios no valor de R$ 191 milhões no 3T22 (R$ 144 milhões superior ao do 3T21) e da constituição de R$
38 milhões de créditos fiscais extemporâneos no 3T21. Em relação ao 2T22, a piora foi de R$ 46 milhões, reflexo da
constituição de R$ 33 milhões de créditos fiscais extemporâneos no 2T22 e de maiores gastos com CBios.
Resultado na venda de bens – Total de R$ 49 milhões, aumento de R$ 31 milhões em relação ao 3T21, decorrente
principalmente da maior venda de terrenos. Em relação ao 2T22, a redução foi de R$ 4 milhões.
Equivalência patrimonial – Total de R$ 12 milhões negativos, principalmente em função de lançamentos retroativos
de IFRS 16 nas SPEs constituídas em conjunto com outras distribuidoras para operação nos portos de Vitória, Belém e
Cabedelo.
EBITDA Ajustado recorrente – Total de R$ 483 milhões (+41% vs 3T21), fruto de melhores margens e do maior volume de
vendas, atenuados por maiores despesas e maiores gastos com CBios. Em relação ao 2T22, houve diminuição de
36%, devido a margens mais pressionadas, decorrentes das reduções de preços de combustíveis ao longo do 3T22 e
da maior oferta de produtos no mercado, apesar do maior volume de vendas e das menores despesas.
Investimentos – Foram investidos R$ 352 milhões, direcionados à ampliação e manutenção das redes de postos e
franquias e à infraestrutura logística da Ipiranga. Do total investido, R$ 144 milhões referem-se a imobilizações e
adições ao intangível, R$ 201 milhões a ativos de contratos com clientes (direitos de exclusividade) e R$ 7 milhões a
liberações de financiamento a clientes e antecipação de aluguel, líquidos de recebimento.
3T22 3T21 2T22
Δ Δ
9M22 9M21
Δ
3T22 v 3T21 3T22 v 2T22 9M22 v 9M21
Volume total (mil m³) 6.020 5.855 5.629 3% 7% 17.024 16.807 1%
Diesel 3.243 3.121 3.047 4% 6% 9.094 8.896 2%
Ciclo Otto 2.675 2.623 2.472 2% 8% 7.610 7.577 0%
Outros¹ 103 110 111 (7%) (8%) 321 334 (4%)
EBITDA Ajustado (R$ milhões) 533 398 840 34% (37%) 1.992 1.383 44%
Margem EBITDA Ajustado
(R$/m³)
88 68 149 30% (41%) 117 82 42%
Resultado na venda de bens 49 18 53 175% (7%) 128 55 131%
Créditos tributários
extemporâneos
- 38 33 n/a n/a 33 135 (76%)
EBITDA Ajustado recorrente
(R$ milhões)
483 342 754 41% (36%) 1.831 1.193 54%
Margem EBITDA Ajustado
recorrente (R$/m³)
80 58 134 37% (40%) 108 71 52%
7
3° TRIMESTRE DE 2022
7
Endividamento (R$ milhões)
Ultrapar consolidado 3T22 3T21 2T22
Dívida bruta (12.236) (16.409) (13.107)
Caixa e aplicações financeiras 6.318 6.588 6.739
Dívida líquida (ex-IFRS 16) (5.917) (9.821) (6.368)
Arrendamentos a pagar (1.529) (1.816) (1.804)
Dívida líquida (7.446) (11.636) (8.172)
Dívida líquida/EBITDA Ajustado LTM¹ 1,9x 3,0x 2,2x
Custo médio da dívida
106% DI 105% DI 96% DI
DI + 0,7% DI + 0,2% DI - 0,5%
Rendimento médio do caixa (% DI) 96% 61% 79%
Prazo médio de amortização da dívida (anos) 4,3 4,9 4,2
¹ EBITDA Ajustado LTM não inclui impairments da Extrafarma, ganho de capital e ajustes de fechamento com as vendas da ConectCar, Oxiteno e
Extrafarma; além disso, para o 2T22, não inclui o resultado LTM da Oxiteno e, para o 3T22, não inclui o resultado LTM da Oxiteno e da Extrafarma
A Ultrapar encerrou o 3T22 com dívida financeira líquida de R$ 5,9 bilhões, composta de endividamento bruto de R$
12,2 bilhões e posição de caixa de R$ 6,3 bilhões. Considerando os arrendamentos a pagar (IFRS 16) de R$ 1,5 bilhão,
a dívida líquida total foi de R$ 7,4 bilhões (1,9x EBITDA Ajustado LTM), em comparação a R$ 8,2 bilhões em 30 de junho
de 2022 (2,2x EBITDA Ajustado LTM). A redução do endividamento líquido em comparação à posição ao final do 2T22
se deve principalmente ao fechamento da venda da Extrafarma em agosto de 2022 (pagamento inicial e saída dos
respectivos arrendamentos a pagar) e à liberação de caixa em capital de giro, decorrente das reduções de preços
dos combustíveis ao longo do 3T22 e da gestão de estoque. Esses efeitos foram atenuados pelo pagamento de juros
sobre capital próprio em agosto de 2022. A redução da alavancagem financeira é reflexo da redução da dívida
líquida e do crescimento de EBITDA das operações continuadas. Cabe destacar que existem recebíveis ainda não
incluídos no endividamento líquido da Ultrapar relacionados às vendas (i) da Oxiteno (US$ 150 milhões a serem
recebidos em abril de 2024) e (ii) da Extrafarma (R$ 365 milhões, corrigidos por CDI + 0,5% a.a., a serem recebidos em
duas parcelas, a primeira em agosto de 2023 e a segunda em agosto de 2024).
Perfil de amortização e composição por moeda:
6.318
3.463
1.096
347 276
2.344
4.710
Caixa e
aplicações
financeiras
Até 1 ano 1 a 2 anos 2 a 3 anos 3 a 4 anos 4 a 5 anos Após 5 anos
41%
55%
3%
0,1%
99,9%
Moeda nacional
Moeda estrangeira
Com hedge
Sem hedge
Resultado de instrumentos de
proteção cambial e de juros
8
3° TRIMESTRE DE 2022
8
Atualizações sobre temas ESG
Em setembro, a Ultrapar participou da Rio Oil & Gas 2022, evento organizado pelo Instituto Brasileiro de Petróleo e
Gás (IBP), que reuniu as principais empresas do setor para discutir diversos temas, incluindo transição energética e
ESG. A Ipiranga e a Ultracargo foram patrocinadoras do evento, e lideranças da Holding, Ipiranga, Ultragaz e
Ultracargo participaram de painéis de discussão e de eventos paralelos, como o Arena ESG e Young Summit. Além
disso, ao longo do trimestre, a Ultrapar realizou encontros imersivos de seu Programa de Aceleração Social, que
contou com a participação de mais de 100 voluntários e apoio a 13 ONGs em seus desafios de gestão, maximizando
seu impacto social. Ao todo, foram propostas mais de 400 soluções que poderão impactar positivamente mais de 9
mil pessoas atendidas pelas instituições. A Ultrapar firmou parceria, em julho, com o Instituto Amazônia+21,
organização criada pela CNI (Confederação Nacional da Indústria), que busca promover negócios sustentáveis e
inovadores na Amazônia, além de contribuir para o desenvolvimento econômico sustentável da região.
Em julho, a Ultragaz doou cestas básicas, kits de higiene, fraldas e água para 1,8 mil famílias em situação de
vulnerabilidade, vítimas das fortes chuvas em Jaboatão dos Guararapes (PE). Em agosto, a Ultragaz iniciou o projeto
Teatro em Ação, que apresentará a peça “Missão Natureza” em 15 cidades e 11 Estados brasileiros, promovendo a
conscientização de crianças sobre a importância de reduzir a geração de resíduos. Além disso, a Ultragaz aderiu ao
programa Compromisso com o Clima, promovido pelo Instituto Ekos em parceria com outras empresas, que tem
como objetivo incentivar a economia de baixo carbono e facilitar a seleção e apoio a projetos socioambientais para
a compensação das emissões de GEEs.
A Ultracargo iniciou, em setembro, mais uma edição do curso Formação de Operadores Portuários, disponibilizando
25 vagas para moradores do entorno do Terminal de Aratu (BA). O programa é ofertado gratuitamente e busca
contribuir com o desenvolvimento profissional dos moradores e atrair talentos para as operações, fomentando a
diversidade. Durante o 3T22, foram abertas as inscrições para o Prêmio Comunidade em Ação, promovido pelo Grupo
Tribuna (Santos-SP) com patrocínio da Ultracargo. A iniciativa, que está em sua 20ª edição, valoriza ações
voluntárias de grupos, instituições ou indivíduos em benefício de causas sociais na região.
Em julho, a Ipiranga lançou a 15ª edição do Programa Saúde na Estrada, que oferece atendimento e serviços médicos
gratuitos aos motoristas, caminhoneiros e comunidades próximos aos postos de rodovia Ipiranga, com expectativa
de atender 70 cidades de 15 Estados até o final do ano. Além disso, lançou o Programa Construa, ação afirmativa
para a contratação e desenvolvimento de pessoas com necessidades especiais na área comercial. Em setembro, a
Ipiranga concluiu o Projeto Ajudôu, projeto social relacionado à lei de incentivo ao esporte, 100% financiado pela
companhia, que promoveu a inclusão de 320 crianças e jovens em situação de vulnerabilidade social em Minas
Gerais através da prática de judô.
9
3° TRIMESTRE DE 2022
9
Fonte: Broadcast
Mercado de capitais
O volume financeiro médio negociado da Ultrapar, considerando as negociações ocorridas na B3 e na NYSE, foi de
R$ 89 milhões/dia no 3T22 (-42% vs 3T21). As ações da Ultrapar encerraram o 3T22 cotadas a R$ 11,73 na B3, queda
de 5% no trimestre, enquanto o índice Ibovespa apreciou 12%. Na NYSE, as ações da Ultrapar e o índice Dow Jones
depreciaram 7% no trimestre. A Ultrapar encerrou o 3T22 com valor de mercado de R$ 13 bilhões.
Mercado de capitais 3T22 3T21 2T22 9M22 9M21
Quantidade final de ações (mil) 1.115.173 1.115.108 1.115.152 1.115.173 1.115.108
Valor de mercado¹ (R$ milhões) 13.081 16.437 13.728 13.081 16.437
B3
Volume médio/dia (mil ações) 5.741 8.210 7.891 6.748 6.934
Volume financeiro médio/dia (R$ mil) 74.580 133.350 105.168 90.850 131.489
Cotação média (R$/ação) 12,99 16,24 13,33 13,46 18,96
NYSE
Quantidade de ADRs² (mil ADRs) 54.163 50.374 50.438 54.163 50.374
Volume médio/dia (mil ADRs) 1.122 1.205 1.480 1.298 1.669
Volume financeiro médio/dia (US$ mil) 2.771 3.744 3.938 3.405 6.118
Cotação média (US$/ADRs) 2,47 3,11 2,66 2,62 3,67
Total
Volume médio/dia (mil ações) 6.863 9.415 9.371 8.046 8.602
Volume financeiro médio/dia (R$ mil) 89.150 152.939 124.690 108.284 164.371
¹ Calculado a partir do preço de fechamento da ação no período
² 1 ADR = 1 ação ordinária
Evolução UGPA3 x Ibovespa – 3T22
(Base 100)
10
3° TRIMESTRE DE 2022
10
Teleconferência 3T22
A Ultrapar realizará a teleconferência com analistas e investidores no dia 10 de novembro de 2022 para
comentários sobre o desempenho da Companhia no terceiro trimestre de 2022 e perspectivas. A apresentação
estará disponível para download no website da Companhia 30 minutos antes de seu início.
A teleconferência será transmitida via webcast e realizada em português com tradução simultânea para inglês.
O link de acesso estará disponível no site ri.ultra.com.br. Favor conectar-se com 10 minutos de antecedência.
Teleconferência em português com tradução simultânea para inglês
Horário: 11h00 (BRT) / 09h00 (EST)
Participantes do Brasil: +55 (11) 3181-8565 ou +55 (11) 4090-1621
Código: Ultrapar – em português
Replay: +55 (11) 3193-1012 (disponível por sete dias)
Código: 3167603#
Participantes Internacionais: +1 (844) 204-8942 ou +1 (412) 717-9627
Código: Ultrapar – em inglês
Replay: +55 (11) 3193-1012 (disponível por sete dias)
Código: 9792937#
11
3° TRIMESTRE DE 2022
11
Em milhões de Reais SET 22¹ SET 21 JUN 22
Operações
continuadas²
Operações
descontinuadas²
ATIVO
Caixa e equivalentes de caixa 4.626,7 2.826,3 4.745,1 4.707,3 37,8
Aplicações financeiras e instrumentos financeiros derivativos de proteção 1.264,0 2.914,9 1.372,8 1.372,8 (0,0)
Contas a receber de clientes e financiamentos a clientes 4.557,2 4.624,4 4.547,1 4.423,9 123,2
Contas a receber - venda de controladas 186,1 - - - -
Estoques 4.333,7 5.574,2 6.573,3 6.010,5 562,8
Tributos a recuperar 1.358,7 1.540,7 1.488,9 1.422,1 66,8
Despesas antecipadas 123,8 141,2 152,3 143,1 9,1
Ativos de contratos com clientes - direitos de exclusividade 599,6 533,7 579,4 579,4 -
Outros 88,1 106,4 119,1 101,5 17,6
Total Ativo Circulante 17.137,8 18.261,8 19.578,0 18.760,6 817,3
Aplicações financeiras e instrumentos financeiros derivativos de proteção 427,6 847,3 621,3 621,3 -
Contas a receber de clientes e financiamentos a clientes 549,3 481,4 513,9 513,9 -
Contas a receber - venda de controladas 928,0 - 707,6 707,6 -
Imposto de renda e contribuição social diferidos 1.021,4 1.245,5 1.016,6 812,1 204,5
Tributos a recuperar 1.622,6 1.815,2 1.352,2 1.330,6 21,7
Depósitos judiciais 880,1 868,4 875,1 871,4 3,7
Despesas antecipadas 79,8 84,3 64,9 64,9 0,0
Ativos de contratos com clientes - direitos de exclusividade 1.691,6 1.385,2 1.646,2 1.646,2 -
Outros 155,1 175,1 154,3 154,3 -
Investimentos 119,1 172,4 117,2 117,2 -
Ativos de direito de uso 1.804,7 2.093,0 2.049,9 1.723,2 326,8
Imobilizado 5.775,2 8.235,0 5.768,7 5.624,6 144,1
Intangível 1.875,0 1.707,7 1.828,4 1.751,1 77,3
Total Ativo Não Circulante 16.929,3 19.110,5 16.716,2 15.938,1 778,1
TOTAL ATIVO 34.067,2 37.372,3 36.294,2 34.698,8 1.595,4
PASSIVO
Empréstimos, financiamentos e instrumentos financeiros derivativos de proteção 889,5 945,6 324,3 324,3 -
Debêntures 2.573,5 1.475,4 3.382,8 3.382,8 -
Fornecedores 6.097,8 6.364,1 6.889,7 6.680,8 208,9
Salários e encargos sociais 416,2 549,0 376,3 321,4 54,8
Impostos a pagar 316,1 396,5 534,2 515,7 18,5
Arrendamentos a pagar 218,4 269,5 278,8 206,6 72,2
Outros 683,7 345,1 889,2 886,4 2,8
Total Passivo Circulante 11.195,2 10.345,2 12.675,3 12.318,1 357,3
Empréstimos, financiamentos e instrumentos financeiros derivativos de proteção 4.572,6 8.458,9 5.178,4 5.178,4 0,0
Debêntures 4.200,2 5.529,2 4.221,4 4.221,4 -
Provisões para riscos tributários, cíveis e trabalhistas 1.011,5 797,2 989,7 987,7 2,0
Benefícios pós-emprego 199,8 262,8 197,3 197,0 0,3
Arrendamentos a pagar 1.310,6 1.546,3 1.525,1 1.215,3 309,8
Outros 206,0 247,8 214,7 212,4 2,2
Total Passivo Não Circulante 11.500,6 16.842,1 12.326,5 12.012,2 314,3
TOTAL PASSIVO 22.695,8 27.187,4 25.001,8 24.330,2 671,6
PATRIMÔNIO LÍQUIDO
Capital social 5.171,8 5.171,8 5.171,8 5.171,8 -
Reservas 5.467,4 5.008,3 5.467,6 5.467,6 -
Ações em tesouraria (489,0) (489,1) (488,4) (488,4) -
Outros 761,3 104,9 690,3 690,3 -
Participação dos não-controladores 460,0 389,1 451,2 451,2 -
Total Patrimônio Líquido 11.371,4 10.185,0 11.292,4 11.292,4 -
TOTAL PASSIVO E PATRIMÔNIO LÍQUIDO 34.067,2 37.372,3 36.294,2 35.622,6 671,6
Caixa e aplicações financeiras 6.318,3 6.588,4 6.739,2 n/a n/a
Empréstimos e debêntures (12.235,8) (16.409,1) (13.106,8) n/a n/a
Arrendamentos a pagar (1.528,9) (1.815,8) (1.803,9) n/a n/a
Caixa (endividamento) líquido (7.446,4) (11.636,4) (8.171,5) n/a n/a
Caixa (endividamento) líquido ex-IFRS 16 (5.917,5) (9.820,7) (6.367,6) n/a n/a
¹ Balanço do 3T22 corresponde somente às operações continuadas
² Dada a gestão financeira unificada na Holding, a v isão indiv idual de balanço das operações continuadas e descontinuadas não reflete a realidade das companhias (ativ o e passiv o diferem)
ULTRAPAR
BALANÇO PATRIMONIAL CONSOLIDADO
12
3° TRIMESTRE DE 2022
12
Em milhões de Reais 3T22¹
Operações
continuadas
Operações
descontinuadas¹
3T21
Operações
continuadas
Operações
descontinuadas
2T22
Operações
continuadas
Operações
descontinuadas
9M22 9M21
Receita líquida de vendas e serviços 39.483,8 39.294,7 189,0 31.911,1 29.452,5 2.458,7 37.425,1 36.879,4 545,8 110.944,9 84.387,5
Custos dos produtos vendidos e dos serviços prestados (37.900,5) (37.708,7) (191,8) (30.112,2) (28.270,2) (1.842,0) (35.401,7) (35.027,5) (374,1) (105.254,8) (79.376,8)
Lucro bruto 1.583,3 1.586,1 (2,8) 1.798,9 1.182,3 616,7 2.023,5 1.851,9 171,6 5.690,1 5.010,6
Receitas (despesas) operacionais
Com vendas e comerciais (563,0) (508,8) (54,2) (781,5) (504,8) (276,7) (699,0) (546,6) (152,4) (2.017,3) (2.140,2)
Gerais e administrativas (409,7) (388,6) (21,1) (497,7) (344,0) (153,8) (448,8) (408,2) (40,6) (1.315,9) (1.439,6)
Outros resultados operacionais, líquidos (174,9) (174,9) (0,0) 35,6 10,9 24,7 (137,7) (136,9) (0,8) (405,9) 101,5
Resultado na venda de bens 13,3 49,2 (35,9) 18,0 17,5 0,6 343,5 55,6 287,9 379,4 58,2
Redução ao valor recuperável de ativos (impairment ) - - - - - - - - - - (394,7)
Lucro (prejuízo) operacional 449,0 562,9 (114,0) 573,4 361,9 211,5 1.081,5 815,8 265,8 2.330,3 1.195,8
Resultado financeiro
Receitas financeiras 176,6 176,4 0,2 127,0 114,7 12,3 210,2 209,7 0,5 498,5 339,1
Despesas financeiras (504,8) (501,1) (3,6) (423,0) (368,4) (54,5) (719,7) (708,3) (11,4) (1.694,2) (971,6)
Equivalência patrimonial (11,1) (11,1) - (11,1) (11,3) 0,2 7,7 7,7 - 9,9 (22,0)
Lucro antes do imposto de renda e contribuição social 109,7 227,0 (117,4) 266,3 96,8 169,5 579,7 324,8 254,8 1.144,5 541,3
Imposto de renda e contribuição social
Corrente (126,3) (271,0) 144,7 (20,2) (44,8) 24,6 (357,1) (100,9) (256,2) (773,6) (383,9)
Diferido 78,7 203,8 (125,1) 95,9 91,6 4,3 208,2 157,4 50,8 474,6 269,8
Incentivos fiscais 20,4 20,4 - 32,3 17,9 14,4 15,7 15,7 - 79,7 66,3
Efeito líquido da cessação de depreciação² - - - - - - 13,5 - 13,5 78,5 -
Lucro (prejuízo) líquido 82,6 180,3 (97,7) 374,3 161,5 212,8 459,9 397,0 62,9 1.003,7 493,4
Lucro atribuível a:
Acionistas da Ultrapar 73,1 170,8 (97,7) 369,2 156,4 212,8 452,9 390,0 62,9 978,2 470,3
Acionistas não controladores de controladas 9,5 9,5 - 5,1 5,1 - 7,1 7,1 - 25,5 23,2
EBITDA Ajustado 838,4 939,3 (100,9) 1.017,3 651,0 366,3 1.494,4 1.189,0 305,4 3.645,8 2.517,1
Itens não recorrentes
Resultado na venda de bens (Ipiranga) (49,3) (49,3) - (17,9) (17,9) - (53,0) (53,0) - (128,2) (55,4)
Créditos tributários extemporâneos (Ipiranga) - - - (37,9) (37,9) - (32,7) (32,7) - (32,7) (134,8)
Créditos tributários extemporâneos (Oxiteno) - - - - - - - - - (62,4) -
Ganho de capital com a venda da Oxiteno - - - - - - (289,2) - (289,2) (289,2) -
Ajustes da venda da Oxiteno 31,6 - 31,6 - - - - - - 31,6 -
Impairment (Extrafarma) - - - - - - - - - - 394,7
Provisões de despesas pré-fechamento (Extrafarma) 67,4 - 67,4 - - - - - - 67,4 -
Ajustes da venda da Extrafarma 4,7 - 4,7 - - - - - - 4,7 -
EBITDA Ajustado recorrente 892,8 890,0 2,8 961,5 595,2 366,3 1.119,5 1.103,3 16,1 3.236,9 2.721,5
Depreciação e amortização³ 400,6 387,5 13,1 417,0 300,4 116,6 405,2 365,6 39,6 1.257,6 1.214,3
Cash flow hedge dos bonds - - - 38,0 - 38,0 - - - 48,1 129,0
Investimentos totais4
525,2 523,6 1,7 491,4 427,1 64,3 411,6 406,8 4,7 1.319,3 1.182,8
Índices
Lucro por ação (R$) 0,07 0,16 (0,09) 0,34 0,14 0,20 0,42 0,36 0,06 0,90 0,43
Dívida líquida / EBITDA Ajustado LTM5
1,9x n/a n/a 3,0x n/a n/a 2,2x n/a n/a 1,9x 3,0x
Margem bruta (%) 4,0% 4,0% (1,5%) 5,6% 4,0% 25,1% 5,4% 5,0% 31,4% 5,1% 5,9%
Margem operacional (%) 1,1% 1,4% (60,3%) 1,8% 1,2% 8,6% 2,9% 2,2% 48,7% 2,1% 1,4%
Margem EBITDA Ajustado (%) 2,1% 2,4% (53,4%) 3,2% 2,2% 14,9% 4,0% 3,2% 56,0% 3,3% 3,0%
Margem EBITDA Ajustado recorrente (%) 2,3% 2,3% 1,5% 3,0% 2,0% 14,9% 3,0% 3,0% 3,0% 2,9% 3,2%
-
Número de funcionários 9.644 9.644 - 16.218 8.507 7.711 14.958 9.350 5.608 9.644 16.218
¹ Considera somente o resultado de julho da Extrafarma, em v irtude da conclusão da sua v enda em 01 de agosto de 2022
² A partir de 01/01/2022 foi cessada a depreciação e amortização das operações descontinuadas, após reclassificação para o ativ o circulante, na linha de ativ os classificados como mantidos para v enda, conforme item 25 do CPC 31 / IFRS 5
³ Inclui amortização de ativ os de contratos com clientes – direitos de exclusiv idade
5
EBITDA Ajustado LTM não inclui impairments da Extrafarma, ganho de capital e ajustes de fechamento com as v endas da ConectCar, Oxiteno e Extrafarma; além disso, para o 2T22, não inclui o resultado LTM da Oxiteno e, para o 3T22, não inclui o resultado LTM da Oxiteno e da Extrafarma
DEMONSTRAÇÃO DO RESULTADO
ULTRAPAR
4
Inclui imobilizações e adições ao intangív el (líquidas de desinv estimentos), ativ os de contratos com clientes (direito de exclusiv idade), custos diretos iniciais de ativ os de direito de uso, aportes realizados nas SPEs (Sociedade de Propósito Específico), pagamentos de outorga, liberações de financiamentos a clientes,
antecipações de aluguel (líquidos de repagamentos) e aquisições de participações acionárias
13
3° TRIMESTRE DE 2022
13
JAN - SET
2022
JAN - SET
2021
Reapresentado
Fluxos de caixa das atividades operacionais continuadas
Lucro líquido do período - operações continuadas 694,2 476,9
Ajustes para reconciliar o lucro líquido ao caixa gerado pelas atividades operacionais
Equivalência patrimonial (10,1) 22,2
Amortização de ativos de contratos com clientes - direitos de exclusividade e direito de uso 543,8 392,5
Depreciações e amortizações 550,4 488,8
Juros, variações monetárias e cambiais 1.208,4 861,8
Imposto de renda e contribuição social correntes e diferidos (2,2) 117,2
Resultado na venda de bens (129,8) (57,9)
Instrumento patrimonial outorgado 16,8 6,9
Provisão de descarbonização - CBios 497,1 111,2
Demais provisões e outros 12,2 (79,5)
3.380,7 2.340,1
(Aumento) diminuição nos ativos
Contas a receber e financiamentos a clientes (637,7) (621,6)
Estoques (420,3) (1.329,1)
Tributos a recuperar (736,2) (571,9)
Dividendos recebidos de controladas e empreendimentos controlados em conjunto e coligadas 0,1 0,1
Outros ativos (176,1) (11,3)
Aumento (diminuição) nos passivos
Fornecedores e fornecedores convênio 270,8 1.680,1
Salários e encargos sociais 86,1 59,6
Obrigações tributárias (41,7) (12,2)
Outros passivos 67,9 (79,9)
Aquisição de CBios (542,5) (121,9)
Pagamentos de ativos de contratos com clientes - direitos de exclusividade (512,3) (222,6)
Imposto de renda e contribuição social pagos (283,3) (164,8)
455,6 944,5
30,6 937,9
Caixa líquido gerado (consumido) pelas atividades operacionais 486,1 1.882,4
Fluxos de caixa das atividades de investimentos
Aplicações financeiras, líquidas de resgates 902,1 2.151,6
Aquisição de imobilizado e intangível (851,0) (844,6)
Recebimento do empréstimo intercompany devido pela Oxiteno S.A à Ultrapar International 3.980,7 -
Caixa gerado com a venda de investimentos e bens 2.734,4 97,1
Aporte de capital em controladas, coligadas e empreendimentos controlados em conjunto (28,0) (25,7)
Transações com operações descontinuadas 987,9 -
Redução de capital em coligadas - 1,5
Custos diretos iniciais de ativos de direito de uso - (14,9)
Sociedades relacionadas - (21,6)
7.726,2 1.343,3
(220,2) (129,2)
7.506,0 1.214,0
Fluxos de caixa das atividades de financiamentos
Financiamentos e debêntures
Captação 1.019,6 1.379,0
Amortização (4.966,7) (2.426,1)
Juros e derivativos pagos (961,9) (451,1)
Pagamentos de arrendamentos¹ (272,9) (251,1)
Dividendos pagos (634,7) (705,6)
Aumento de capital realizado por acionistas não controladores e resgate de cotas 21,7 -
Sociedades relacionadas (18,9) (0,2)
(5.813,8) (2.455,1)
(179,0) (514,8)
(5.992,8) (2.969,9)
(21,3) (10,7)
(19,3) 48,9
(40,7) 38,2
2.346,6 164,8
(388,0) -
1.958,6 164,8
2.280,1 2.661,5
388,0 -
2.668,1 2.661,5
4.626,6 2.826,3
- -
4.626,6 2.826,3
Transações sem efeito caixa:
Adições em ativos de direito de uso e arrendamentos a pagar 420,8 204,5
Adições em ativos de contratos com clientes - direitos de exclusividade 38,8 197,9
Fundo de reversão - previdência privada 3,1 3,7
Emissão de ações referente ao bônus de subscrição - indenização - aquisição Extrafarma 0,9 1,8
¹ Inclui R$ 32 milhões e R$ 29 milhões da outorga do terminal de Vila do Conde da Ultracargo no 1T22 e 1T21, respectiv amente, R$ 16 milhões da outorga do terminal de Belém da Ipiranga
no 2T22 e R$ 12 milhões da outorga da base de Vitória na Ipiranga no 3T22
Caixa líquido gerado (consumido) nas atividades de investimentos - operações descontinuadas
Caixa líquido gerado (consumido) nas atividades de investimentos
Caixa líquido gerado (consumido) nas atividades de investimentos - operações continuadas
ULTRAPAR
DEMONSTRAÇÃO DOS FLUXOS DE CAIXA
Em milhões de Reais
Caixa líquido gerado (consumido) pelas atividades operacionais - operações continuadas
Caixa líquido gerado (consumido) pelas atividades operacionais - operações descontinuadas
Caixa e equivalentes de caixa no fim do período
Caixa e equivalentes de caixa no início do período
Caixa líquido consumido pelas atividades de financiamentos - operações continuadas
Caixa líquido consumido pelas atividades de financiamentos - operações descontinuadas
Caixa líquido consumido pelas atividades de financiamentos
Caixa e equivalentes de caixa no fim do período - operações continuadas
Caixa e equivalentes de caixa no fim do período - operações descontinuadas
Aumento (diminuição) de caixa e equivalentes de caixa
Caixa e equivalentes de caixa no início do período - operações continuadas
Caixa e equivalentes de caixa no início do período - operações descontinuadas
Variação cambial de caixa e equivalentes de caixa em moeda estrangeira - operações continuadas
Variação cambial de caixa e equivalentes de caixa em moeda estrangeira - operações descontinuadas
Variação cambial de caixa e equivalentes de caixa em moeda estrangeira
Aumento (diminuição) de caixa e equivalentes de caixa - operações continuadas
Aumento (diminuição) de caixa e equivalentes de caixa - operações descontinuadas
14
3° TRIMESTRE DE 2022
14
Em milhões de Reais SET 22 SET 21 JUN 22
ATIVO OPERACIONAL
Clientes 591,8 472,4 569,6
Clientes a receber LP 17,1 29,9 18,8
Estoques 196,9 177,3 199,2
Impostos 103,8 86,0 100,8
Depósitos judiciais 200,6 220,0 207,6
Outros 89,6 79,1 84,5
Ativos de direito de uso 151,8 89,4 124,6
Imobilizado / Intangível 1.274,8 1.181,2 1.245,4
TOTAL ATIVO OPERACIONAL 2.626,3 2.335,2 2.550,4
PASSIVO OPERACIONAL
Fornecedores 193,4 119,5 166,0
Salários e encargos 120,8 99,0 89,9
Impostos 13,9 15,8 16,5
Provisões judiciais 126,2 124,2 125,2
Arrendamentos a pagar 189,5 141,4 162,3
Outros 71,4 53,9 83,7
TOTAL PASSIVO OPERACIONAL 715,1 553,8 643,6
Em milhões de Reais 3T22 3T21 2T22 9M22 9M21
Receita líquida 3.067,5 2.679,5 2.944,2 8.651,0 7.063,0
Custo dos produtos vendidos (2.605,2) (2.352,7) (2.550,8) (7.479,0) (6.280,0)
Lucro bruto 462,3 326,8 393,4 1.171,9 783,0
Despesas operacionais
Vendas e comerciais (146,3) (120,8) (144,8) (414,2) (329,2)
Gerais e administrativas (62,4) (53,1) (61,1) (178,2) (150,7)
Outros resultados operacionais 3,6 2,9 0,3 8,2 10,3
Resultado na venda de bens (0,1) (0,4) (0,1) (0,9) 2,5
Lucro (prejuízo) operacional 257,2 155,3 187,6 586,8 315,8
Equivalência patrimonial (0,0) (0,0) 0,0 0,0 0,0
EBITDA Ajustado 332,4 220,5 261,0 806,6 507,2
Depreciação e amortização¹ 75,2 65,1 73,4 219,8 191,4
Índices
Margem bruta (R$/ton) 1.026 721 925 919 603
Margem operacional (R$/ton) 571 343 441 460 243
Margem EBITDA Ajustado (R$/ton) 738 486 614 633 391
Número de funcionários 3.496 3.409 3.420 3.496 3.409
¹ Inclui amortização de ativ os de contratos com clientes – direitos de exclusiv idade
DEMONSTRAÇÃO DO RESULTADO CONSOLIDADA
ULTRAGAZ
CAPITAL OPERACIONAL CONSOLIDADO
15
3° TRIMESTRE DE 2022
15
Em milhões de Reais SET 22 SET 21 JUN 22
ATIVO OPERACIONAL
Clientes 17,2 25,3 19,5
Estoques 10,4 8,7 9,7
Impostos 7,7 24,1 13,6
Outros 37,8 23,8 39,2
Ativos de direito de uso 655,6 536,8 580,1
Imobilizado / Intangível / Investimentos 1.759,5 1.659,9 1.710,5
TOTAL ATIVO OPERACIONAL 2.488,3 2.278,7 2.372,7
PASSIVO OPERACIONAL
Fornecedores 61,8 44,9 48,2
Salários e encargos 46,9 44,6 37,6
Impostos 4,8 5,2 8,8
Provisões judiciais 9,7 10,1 9,5
Arrendamentos a pagar 598,4 481,4 514,4
Outros¹ 63,2 61,0 72,1
TOTAL PASSIVO OPERACIONAL 784,8 647,3 690,5
Em milhões de Reais 3T22 3T21 2T22 9M22 9M21
Receita líquida 224,5 177,8 216,8 638,8 525,7
Custo dos serviços prestados (80,9) (69,2) (87,7) (252,3) (207,8)
Lucro bruto 143,6 108,7 129,1 386,4 317,9
Despesas operacionais
Vendas e comerciais (2,4) (2,2) (2,8) (9,1) (6,2)
Gerais e administrativas (36,8) (30,5) (31,8) (95,2) (93,9)
Outros resultados operacionais (0,4) 0,8 (0,1) (1,7) 4,0
Resultado na venda de bens 0,0 (0,0) (0,1) (0,2) 0,0
Lucro (prejuízo) operacional 104,1 76,7 94,3 280,3 221,8
Equivalência patrimonial (0,5) 0,1 (0,3) (1,4) 0,7
EBITDA Ajustado 136,3 102,1 129,6 379,8 294,8
Depreciação e amortização 32,8 25,2 35,6 100,9 72,3
Índices
Margem bruta (%) 64,0% 61,1% 59,6% 60,5% 60,5%
Margem operacional (%) 46,4% 43,2% 43,5% 43,9% 42,2%
Margem EBITDA Ajustado (%) 60,7% 57,4% 59,8% 59,5% 56,1%
Número de funcionários 869 736 864 869 736
ULTRACARGO
CAPITAL OPERACIONAL CONSOLIDADO
¹ Inclui saldo da conta obrigações com clientes de longo prazo
DEMONSTRAÇÃO DO RESULTADO CONSOLIDADA
16
3° TRIMESTRE DE 2022
16
Em milhões de Reais SET 22 SET 21 JUN 22
ATIVO OPERACIONAL
Clientes 3.940,6 3.119,6 3.855,9
Clientes a receber LP 532,2 451,4 495,1
Estoques 4.125,4 3.436,6 5.800,0
Impostos 2.485,7 1.820,3 2.214,2
Ativos de contratos com clientes - direitos de exclusividade 2.288,1 1.914,4 2.222,1
Outros 501,8 481,2 491,6
Ativos de direito de uso 990,3 1.043,8 1.011,6
Imobilizado / Intangível / Investimentos 4.310,4 3.669,5 4.114,7
TOTAL ATIVO OPERACIONAL 19.174,5 15.936,6 20.205,2
PASSIVO OPERACIONAL
Fornecedores 5.768,5 4.773,3 6.401,7
Salários e encargos 177,3 130,9 138,2
Benefícios pós-emprego 213,0 269,0 210,5
Impostos 164,6 178,2 176,2
Provisões judiciais 287,0 212,9 305,0
Arrendamentos a pagar 733,1 730,4 737,5
Outros 654,2 370,3 483,3
TOTAL PASSIVO OPERACIONAL 7.997,8 6.665,0 8.452,4
Em milhões de Reais 3T22 3T21 2T22 9M22 9M21
Receita líquida 35.999,1 26.613,8 33.706,0 98.375,1 70.322,6
Custos dos produtos vendidos e dos serviços prestados (35.004,4) (25.891,8) (32.391,5) (95.025,8) (68.106,8)
Lucro bruto 994,7 722,0 1.314,5 3.349,4 2.215,7
Despesas operacionais
Vendas e comerciais (359,5) (361,2) (398,2) (1.131,7) (981,5)
Gerais e administrativas (230,5) (184,9) (247,7) (657,1) (544,7)
Outros resultados operacionais (176,1) 5,2 (129,9) (416,3) 59,1
Resultado na venda de bens 49,3 17,9 53,0 128,2 55,4
Lucro (prejuízo) operacional 277,9 199,0 591,7 1.272,4 804,1
Equivalência patrimonial (12,4) 0,6 0,8 (10,4) (1,3)
EBITDA Ajustado 532,7 398,1 840,0 1.992,2 1.382,9
Itens não recorrentes
Resultado na venda de bens (49,3) (17,9) (53,0) (128,2) (55,4)
Créditos tributários extemporâneos - (37,9) (32,7) (32,7) (134,8)
EBITDA Ajustado recorrente 483,4 342,3 754,3 1.831,3 1.192,6
Depreciação e amortização¹ 267,2 198,5 247,5 730,3 580,1
Índices
Margem bruta (R$/m³) 165 123 234 197 132
Margem operacional (R$/m³) 46 34 105 75 48
Margem EBITDA Ajustado (R$/m³) 88 68 149 117 82
Margem EBITDA Ajustado recorrente (R$/m³) 80 58 134 108 71
Número de postos 6.940 7.088 7.010 6.940 7.088
Número de funcionários 4.587 3.778 4.363 4.587 3.778
¹ Inclui amortização de ativ os de contratos com clientes – direitos de exclusiv idade
IPIRANGA
CAPITAL OPERACIONAL CONSOLIDADO
DEMONSTRAÇÃO DO RESULTADO CONSOLIDADA
17
3° TRIMESTRE DE 2022
17
Em milhões de Reais SET 22 SET 21 JUN 22
ATIVO OPERACIONAL
Clientes - 35,0 123,2
Estoques - 527,0 562,8
Impostos - 74,8 86,5
Outros - 33,3 35,1
Ativos de direito de uso - 352,8 313,2
Imobilizado / Intangível - 247,4 207,9
TOTAL ATIVO OPERACIONAL - 1.270,4 1.328,6
PASSIVO OPERACIONAL
Fornecedores - 194,2 208,9
Salários e encargos - 62,4 54,8
Impostos - 14,9 18,5
Provisões judiciais - 10,2 2,5
Arrendamentos a pagar - 383,9 382,0
Outros - 19,2 10,6
TOTAL PASSIVO OPERACIONAL - 684,8 677,3
Em milhões de Reais 3T22¹ 3T21 2T22 9M22 9M21
Receita bruta 199,9 509,6 575,8 1.304,7 1.568,6
Devoluções, abatimentos e impostos faturados (10,9) (26,2) (30,0) (69,2) (81,5)
Receita líquida 189,0 483,4 545,8 1.235,5 1.487,1
Custos dos produtos vendidos e dos serviços prestados (191,8) (333,7) (374,1) (912,3) (1.032,1)
Lucro bruto (2,8) 149,7 171,6 323,2 455,0
Despesas operacionais (75,0) (175,3) (192,1) (436,2) (520,0)
Outros resultados operacionais (0,0) 2,7 (0,8) (2,2) 0,0
Resultado na venda de bens 0,5 0,8 (1,3) (3,8) 0,2
Redução ao valor recuperável de ativos (impairment ) - - - - (394,7)
Lucro (prejuízo) operacional (77,3) (22,1) (22,6) (119,0) (459,5)
EBITDA Ajustado (64,2) 17,0 17,0 (26,6) (344,5)
Itens não recorrentes
Impairment - - - - 394,7
Provisões de despesas pré-fechamento 67,4 - - 67,4 -
EBITDA Ajustado recorrente 3,1 17,0 17,0 40,7 50,2
Depreciação e amortização 13,1 39,1 39,7 92,4 115,0
Índices²
Margem bruta (%) (1,4%) 29,4% 29,8% 24,8% 29,0%
Margem operacional (%) (38,7%) (4,3%) (3,9%) (9,1%) (29,3%)
Margem EBITDA Ajustado (%) (32,1%) 3,3% 3,0% (2,0%) (22,0%)
Margem EBITDA Ajustado recorrente (%) 1,6% 3,3% 3,0% 3,1% 3,2%
Número de lojas - 399 399 - 399
Número de funcionários - 5.838 5.608 - 5.838
¹ Considera somente o resultado de julho da Extrafarma, em v irtude da conclusão da sua v enda em 01 de agosto de 2022
² Calculado sobre a receita bruta
EXTRAFARMA
CAPITAL OPERACIONAL
DEMONSTRAÇÃO DO RESULTADO
Divulgação dos
resultados 2T22
3Q22 Earnings
Release
São Paulo, November 9, 2022 – Ultrapar Participações S.A. (“Company” or “Ultrapar”, B3: UGPA3 / NYSE: UGP),
a company engaged in energy and infrastructure through Ipiranga, Ultragaz and Ultracargo, today announces
its results for the third quarter of 2022.
Continuing
operations
Net revenues Recurring Adjusted EBITDA² Investments
R$ 39
billion
R$ 890
million
R$ 524
million
Pro
forma
view¹
Recurring Adjusted EBITDA² Net income
Cash flow from
operations
R$ 893
million
R$ 83
million
R$ 1.3
billion
¹ Considers the sum of continuing and discontinued operations
² Accounting adjustments and non-recurring items described in the EBITDA calculation table – page 2
Highlights
• EBTIDA growth in all of the main businesses of the Group.
• Reduction of the financial leverage to 1.9x, the lowest level of the last 5 years, reflecting the sales of Oxiteno
and Extrafarma this year, the EBITDA growth from continuing operations and the working capital release in
3Q22.
• Review of Ultrapar’s rating perspective from negative to stable by Moody’s, reflecting the improvement of
the capital structure with the reduction of net debt, and prospects of profitability recovery with the
evolution of results.
• Approval of additional investments in Ipiranga by the Board of Directors, in the amount of R$ 265 million for
2022, due to greater opportunities for branding new service stations.
• Acquisition of Stella, a technology platform that connects renewable distributed electricity generators and
customers, marking Ultragaz's entry into the electricity segment, in line with its strategy of expanding its
offering of energy solutions to customers, leveraging the value generation through its capillarity,
commercial strength, brand and extensive base of industrial and residential customers.
2
3rd
QUARTER OF 2022
2
Considerations on the financial and operational information
In May and August 2021, the sale agreements of Extrafarma and Oxiteno were signed, respectively, according to the
Material Notices disclosed at the time. On December 31, 2021, Ultrapar classified these businesses as assets and
liabilities held for sale and discontinued operations. The sale of Oxiteno was concluded on April 1st, 2022, and thus
ceased to be part of discontinued operations and Ultrapar's results as of 2Q22. The sale of Extrafarma was concluded
on August 1st, 2022, and its results are shown within discontinued operations until this date. In this report the financial
information related to Ultrapar corresponds to the consolidated information (pro forma) of the Company, that is, the
data considers the sum of continuing and discontinued operations unless otherwise indicated.
The financial information presented on this document were extracted from the individual and consolidated interim
financial information ("Quarterly Information") for the three months period ended on September 30, 2022, and
prepared in accordance with the pronouncement CPC 21 (R1) - Interim Financial Reporting and the International
Accounting Standard IAS 34 - Interim Financial Reporting issued by the International Accounting Standards Board
("IASB"), and presented in accordance with the applicable rules for Quarterly Information, issued by the Brazilian
Securities and Exchange Commission (“CVM”). The information on Ultragaz, Ultracargo, Oxiteno, Ipiranga and
Extrafarma are presented without the elimination of intersegment transactions. Therefore, the sum of such information
may not correspond to Ultrapar’s consolidated information (pro forma). Additionally, the financial and operational
information presented in this discussion is subject to rounding and, consequently, the total amounts presented in the
tables and charts may differ from the direct numerical sum of the amounts that precede them. Information
denominated EBITDA (Earnings Before Interests, Taxes on Income and Social Contribution on Net Income, Depreciation
and Amortization); Adjusted EBITDA – adjusted by the amortization of contractual assets with customers – exclusive
rights and by the cash flow hedge from bonds; Recurring Adjusted EBITDA – adjusted by non-recurring items; and EBIT
(Earnings Before Interest and Taxes on Income and Social Contribution on Net Income) are presented in accordance
to Instruction No. 527, issued by CVM on October 4, 2012. The calculation of EBITDA based on net income is shown
below:
R$ million 3Q22 3Q21 2Q22 9M22 9M21
Net income 82.6 374.3 459.9 1,003.7 493.4
(+) Income and social contribution taxes 27.1 (108.0) 133.2 219.2 47.9
(+) Net financial (income) expenses 328.1 296.0 509.6 1,195.7 632.4
(+) Depreciation and amortization 272.3 346.1 288.9 924.3 1,014.5
(+) Net effect of the cessation of depreciation - - (13.5) (78.5) -
EBITDA 710.2 908.4 1,378.1 3,264.4 2,188.3
Accounting adjustments
(+) Amortization of contractual assets with customers - exclusive rights (Ipiranga) 127.9 70.5 115.9 332.2 198.6
(+) Amortization of contractual assets with customers - exclusive rights (Ultragaz) 0.4 0.4 0.4 1.1 1.2
(+) Cash flow hedge from bonds (Oxiteno) - 38.0 - 48.1 129.0
Adjusted EBITDA 838.4 1,017.3 1,494.4 3,645.8 2,517.1
Adjusted EBITDA from continuing operations 939.3 651.0 1,189.0 3,027.2 2,017.0
Ultragaz 332.4 220.5 261.0 806.6 507.2
Ultracargo 136.3 102.1 129.6 379.8 294.8
Ipiranga 532.7 398.1 840.0 1,992.2 1,382.9
Holding, abastece aí and other companies (62.5) (71.8) (42.4) (155.4) (175.6)
Eliminations 0.3 2.2 0.9 3.9 7.6
-
Adjusted EBITDA from discontinued operations (100.9) 366.3 305.4 618.6 500.1
Oxiteno - 351.5 - 396.2 852.2
Extrafarma (64.2) 17.0 17.0 (26.6) (344.5)
Capital gain from the sale of Oxiteno - - 289.2 289.2 -
Adjustments from the sale of Oxiteno (31.6) - - (31.6) -
Adjustments from the sale of Extrafarma (4.7) - - (4.7) -
Eliminations (0.3) (2.2) (0.9) (3.9) (7.6)
Non-recurring items that affected EBITDA
(-) Results from disposal of assets (Ipiranga) (49.3) (17.9) (53.0) (128.2) (55.4)
(-) Extemporaneous tax credits (Ipiranga) - (37.9) (32.7) (32.7) (134.8)
(-) Extemporaneous tax credits (Oxiteno) - - - (62.4) -
(-) Capital gain from the sale of Oxiteno - - (289.2) (289.2) -
(+) Adjustments from the sale of Oxiteno 31.6 - - 31.6 -
(+) Impairment (Extrafarma) - - - - 394.7
(+) Pre-closing expenses provisions (Extrafarma) 67.4 - - 67.4 -
(+) Adjustments from the sale of Extrafarma 4.7 - - 4.7 -
Recurring Adjusted EBITDA 892.8 961.5 1,119.5 3,236.9 2,721.5
Recurring Adjusted EBITDA from continuing operations 890.0 595.2 1,103.3 2,866.3 1,826.7
Ultragaz 332.4 220.5 261.0 806.6 507.2
Ultracargo 136.3 102.1 129.6 379.8 294.8
Ipiranga 483.4 342.3 754.3 1,831.3 1,192.6
Holding, abastece aí and other companies (62.5) (71.8) (42.4) (155.4) (175.6)
Eliminations 0.3 2.2 0.9 3.9 7.6
Recurring Adjusted EBITDA from discontinued operations 2.8 366.3 16.1 370.7 894.8
Oxiteno - 351.5 - 333.9 852.2
Extrafarma 3.1 17.0 17.0 40.7 50.2
Eliminations (0.3) (2.2) (0.9) (3.9) (7.6)
Quarter Accumulated
3
3rd
QUARTER OF 2022
3
Ultrapar
¹ Non-recurring items described in the EBITDA calculation table – page 2
² Includes amortization of contractual assets with customers – exclusive rights
³ Includes the result of the cash flow hedge from bonds until 1Q22
4 Includes R$ 32 million and R$ 29 million related to the grant of Ultracargo’s terminal in Vila do Conde in 1Q22 and 1Q21, respectively, R$ 16 million
related to the grant of Ipiranga’s terminal in Belém in 2Q22 and R$ 12 million related to the grant of Ipiranga’s base in Vitória in 3Q22
Net revenues – Total of R$ 39,484 million (+24% YoY and +6% QoQ), due to the increase in net revenues in all businesses,
especially Ipiranga, partially offset by the divestments of Oxiteno and Extrafarma and subsequent deconsolidation of
their results in April and August 2022, respectively.
Recurring Adjusted EBITDA - Continuing operations – Total of R$ 890 million (+50% YoY), due to higher EBITDAs of Ultragaz,
Ipiranga and Ultracargo. Compared to 2Q22, recurring Adjusted EBITDA from continuing operations decreased 19%,
due to the lower EBITDA of Ipiranga, offset by higher EBITDAs of Ultragaz and Ultracargo.
Recurring Adjusted EBITDA - Discontinued operations – Total of R$ 3 million (-99% YoY and -83% QoQ), mainly due to
the deconsolidation of the results of Oxiteno and Extrafarma.
Depreciation and amortization – Total of R$ 401 million (-4% YoY and -1% QoQ), due to the deconsolidation of the results
of Oxiteno and Extrafarma, partially offset by higher investments made during the last 12 months and higher
amortization of contractual assets at Ipiranga.
Results from the Holding, abastece aí and other companies – Ultrapar recorded a negative result of R$ 62 million in the
Holding, abastece aí and other companies, comprised of (i) R$ 45 million of negative EBITDA from the Holding, (ii) R$ 15
million of negative EBITDA from abastece aí, due to expenses with personnel and technology, and (iii) R$ 2 million of
negative EBITDA from other companies.
Financial result – Ultrapar reported net financial expenses of R$ 328 million in 3Q22, an improvement of R$ 6 million
compared to 3Q21, reflecting the negative result of R$ 40 million of mark-to-market of hedges in 3Q22 compared to
the negative result of R$ 146 million in 3Q21, attenuated by (i) the effect in 3Q21 of the accrued interest from
extraordinary tax credits related to the ICMS exclusion from the PIS/Cofins calculation base in the amount of R$ 60
million; and (ii) the higher CDI rate, despite the lower average balance and lower cost of the net debt. Compared to
2Q22, a period during which Ultrapar recognized net financial expenses of R$ 510 million, the variation is mainly
explained by the lower negative effect of mark-to-market of hedges.
Net income – Total of R$ 83 million (-78% YoY), explained by the effect of the income tax reversion over monetary
adjustment for tax credits of R$ 196 million in 3Q21 and by closing adjustments from the divestments of Oxiteno and
Extrafarma in 3Q22, offset by higher EBITDA from continuing operations. Compared to 2Q22, net income decreased
82%, mainly due to the capital gain from the sale of Oxiteno registered in 2Q22 and lower EBITDA of Ipiranga in 3Q22.
Cash flow from operations – Generation of R$ 1.3 billion in 3Q22, compared to the generation of R$ 604 million in 3Q21,
due to working capital cash release, as a result of fuel prices reductions during the 3Q22 and inventory management,
despite the lower EBITDA.
Amounts in R$ million 3Q22 3Q21 2Q22
Δ Δ
9M22 9M21
Δ
3Q22 v 3Q21 3Q22 v 2Q22 9M22 v 9M21
Net revenues 39,484 31,911 37,425 24% 6% 110,945 84,387 31%
Adjusted EBITDA 838 1,017 1,494 (18%) (44%) 3,646 2,517 45%
Recurring Adjusted EBITDA1 893 962 1,119 (7%) (20%) 3,237 2,722 19%
Recurring Adjusted EBITDA -
Continuing operations
890 595 1,103 50% (19%) 2,866 1,827 57%
Recurring Adjusted EBITDA -
Discontinued operations
3 366 16 (99%) (83%) 371 895 (59%)
Depreciation and amortization² 401 417 405 (4%) (1%) 1,258 1,214 4%
Financial result³ (328) (334) (510) 2% 36% (1,244) (761) (63%)
Net income 83 374 460 (78%) (82%) 1,004 493 103%
Investments4 525 491 412 7% 28% 1,319 1,183 12%
Cash flow from operations 1,293 604 376 114% 243% 486 1,882 (74%)
4
3rd
QUARTER OF 2022
4
Ultragaz
Operational performance – The volume sold by Ultragaz in 3Q22 decreased 1% in relation to 3Q21, resulting from a 3%
reduction in sales in the bottled segment, due to lower market demand. The bulk segment, on the other hand,
increased 5%, mainly due to higher sales of special gases and to the commercial and services segments. Compared
to 2Q22, volume sold increased 6%, due to the typical seasonality between periods.
Net revenues – Total of R$ 3,068 million (+14% YoY), due to the pass throughs of higher LPG costs, attenuated by lower
sales volume. Compared to 2Q22, net revenues increased 4%, mainly due to higher sales volume.
Cost of goods sold – Total of R$ 2,605 million (+11% YoY), due to the readjustments of LPG costs carried out by Petrobras
and higher costs with freight and logistics, reflecting the higher price of diesel, and personnel (collective bargaining
agreement). Compared to 2Q22, cost of goods sold increased 2%, mainly due to higher sales volume and higher costs
with freight and personnel.
Sales, general and administrative expenses – Total of R$ 209 million (+20% YoY), resulting from higher personnel
expenses (mainly higher variable compensation, aligned with the progression of results, and collective bargaining
agreement) and higher sales commissions. Compared to 2Q22, SG&A increased 1%, due to higher personnel and sales
commission expenses, attenuated by lower provisions for doubtful accounts.
Adjusted EBITDA – Ultragaz reached a record level of EBITDA of R$ 332 million (+51% YoY), due to better margins, as a
result of efficiency and productivity initiatives and better sales mix, despite higher expenses. Compared to 2Q22,
Adjusted EBITDA increased 27%, due to higher sales volume and better margins.
Investments – R$ 90 million were invested in this quarter, directed mainly towards the acquisition and replacement of
bottles, equipment installed in customers in the bulk segment and maintenance of existing operations.
3Q22 3Q21 2Q22
Δ Δ
9M22 9M21
Δ
3Q22 v 3Q21 3Q22 v 2Q22 9M22 v 9M21
Total volume (000 tons) 451 453 425 (1%) 6% 1,275 1,298 (2%)
Bottled 294 304 281 (3%) 5% 839 876 (4%)
Bulk 157 149 144 5% 9% 436 421 3%
Adjusted EBITDA (R$ million) 332 220 261 51% 27% 807 507 59%
Adjusted EBITDA margin (R$/ton) 738 486 614 52% 20% 633 391 62%
5
3rd
QUARTER OF 2022
5
Ultracargo
1 Monthly average
Operational performance – Ultracargo's average installed capacity increased 9% YoY, as a result of the start-up of
operations in Vila do Conde terminal and the capacity expansion in Itaqui. The m³ sold increased 12%, with higher
handling of fuels in Itaqui and the start-up of operations in Vila do Conde. Compared to 2Q22, m³ sold increased 1%,
due to higher handling of fuels in Itaqui and the ramp-up of operations in Vila do Conde, offset by lower handling in
Santos.
Net revenues – Total of R$ 225 million (+26% YoY), due to contractual readjustments and higher m³ sold mostly in Itaqui
and Vila do Conde. Compared to 2Q22, net revenues increased 4%, for the same reasons already mentioned.
Cost of services provided – Total of R$ 81 million (+17% YoY), of which about 80% of the increase refers to costs and
depreciation of Vila do Conde terminal (operations started in December 2021), while the remainder comes from higher
depreciation, due to capacity expansions in Itaqui and investments made in the last 12 months, along with the effect
of inflation on personnel and inputs. Compared to 2Q22, cost of services provided decreased 8%, due to lower
depreciation and lower costs with personnel and inputs.
Sales, general and administrative expenses – Total of R$ 39 million (+20% YoY), resulting from higher expenses with
personnel (mainly higher variable compensation, in line with the progression of results, and collective bargaining
agreement) and engineering studies, attenuated by productivity and efficiency gains. Compared to 2Q22, SG&A
increased 13%, due to higher expenses with personnel and engineering studies.
Adjusted EBITDA – Ultracargo reached a record level of EBITDA of R$ 136 million (+34% YoY), as a result of the capacity
expansions with profitability gains, contractual readjustments and productivity and efficiency gains. Compared to
2Q22, there was a 5% growth, mainly due to contractual readjustments and lower costs, attenuated by higher
expenses.
Investments – Investments in the period amounted to R$ 72 million, directed towards efficiency gain projects,
maintenance, and operational safety of the terminals.
3Q22 3Q21 2Q22 Δ Δ 9M22 9M21 Δ
3Q22 v 3Q21 3Q22 v 2Q22 9M22 v 9M21
Installed capacity¹ (000 m³) 955 878 955 9% 0% 955 860 11%
m³ sold (000 m³) 3,445 3,089 3,411 12% 1% 10,076 9,381 7%
Adjusted EBITDA (R$ million) 136 102 130 34% 5% 380 295 29%
Adjusted EBITDA margin (%) 61% 57% 60% 3 p.p. 1 p.p. 59% 56% 3 p.p.
6
3rd
QUARTER OF 2022
6
Ipiranga
¹ Fuel oils, arla 32, kerosene, lubricants and greases
Operational performance – The volume sold by Ipiranga grew 3% YoY, with an increase of 4% in diesel and 2% in the
Otto cycle. Compared to 2Q22, volume was 7% higher, due to the 8% growth in the Otto cycle and 6% in diesel,
resulting mainly from the typical seasonality between the periods.
Net revenues – Total of R$ 35,999 million (+35% YoY), due to the pass throughs of higher oil derivatives and ethanol
costs, and higher sales volume. Compared to 2Q22, net revenues increased 7%, as a result of higher sales volume,
despite the reductions of fuel prices during 3Q22.
Cost of goods sold – Total of R$ 35,004 million (+35% YoY), due to increased costs of oil derivatives and ethanol arising
from the increase in international prices in the last 12 months, in addition to higher sales volume. Compared to 2Q22,
cost of goods sold increased 8%, mainly due to higher sales volume, offset by the reduction of fuel prices during 3Q22.
Sales, general and administrative expenses – Total of R$ 590 million (+8% YoY), resulting from higher expenses with
freight (diesel prices increase and higher sales volume), personnel (mainly higher variable compensation, in line with
the progression of results and collective bargaining agreement), and AmPm’s company-operated stores, partially
offset by higher reversals of provisions for doubtful accounts. Compared to 2Q22, SG&A decreased 9%, due to higher
reversals of provisions for doubtful accounts and lower contingencies.
Other operating results – Total of negative R$ 176 million, a worsening of R$ 181 million in relation to 3Q21, due to costs
with CBios in the amount of R$ 191 million in 3Q22 (R$ 144 million higher than in 3Q21) and the constitution of
extemporaneous tax credits of R$ 38 million in 3Q21. Compared to 2Q22, the worsening was of R$ 46 million, due to
the constitution of extemporaneous tax credits of R$ 33 million in 2Q22 and higher costs with CBios.
Results from disposal of assets – Total of R$ 49 million, an increase of R$ 31 million compared to 3Q21, due to higher
sales of real estate assets. Compared to 2Q22, there was a decrease of R$ 4 million.
Share or profit (loss) of subsidiaries, joint ventures and associates – Total of negative R$ 12 million, mainly due to
retroactive entries of IFRS 16 in SPEs formed together with other distributors to operate in the ports of Vitória, Belém and
Cabedelo.
Recurring Adjusted EBITDA – Total of R$ 483 million (+41% YoY), due to better margins and higher sales volume,
attenuated by higher expenses and higher costs with CBios. Compared to 2Q22, there was a decrease of 36%, due to
more pressured margins, resulting from fuel prices reductions during 3Q22 and greater product availability, despite of
higher sales volume and lower expenses.
Investments – R$ 352 million were invested, directed to the expansion and maintenance of Ipiranga’s service stations
and franchises network and to logistics infrastructure. Out of the total investments, R$ 144 million refer to additions to
fixed and intangible assets, R$ 201 million to contractual assets with customers (exclusive rights), and R$ 7 million to
drawdowns of financing to clients and advance payments of rentals, net of receipts.
3Q22 3Q21 2Q22
Δ Δ
9M22 9M21
Δ
3Q22 v 3Q21 3Q22 v 2Q22 9M22 v 9M21
Total volume (000 m³) 6,020 5,855 5,629 3% 7% 17,024 16,807 1%
Diesel 3,243 3,121 3,047 4% 6% 9,094 8,896 2%
Otto cycle 2,675 2,623 2,472 2% 8% 7,610 7,577 0%
Others¹ 103 110 111 (7%) (8%) 321 334 (4%)
Adjusted EBITDA (R$ million) 533 398 840 34% (37%) 1,992 1,383 44%
Adjusted EBITDA margin
(R$/m³)
88 68 149 30% (41%) 117 82 42%
Results from disposal of assets 49 18 53 175% (7%) 128 55 131%
Extemporaneous tax credits - 38 33 n/a n/a 33 135 (76%)
Recurring Adjusted EBITDA
(R$ million)
483 342 754 41% (36%) 1,831 1,193 54%
Recurring Adjusted EBITDA
margin (R$/m³)
80 58 134 37% (40%) 108 71 52%
7
3rd
QUARTER OF 2022
7
Indebtedness (R$ million)
Ultrapar consolidated 3Q22 3Q21 2Q22
Gross debt (12,236) (16,409) (13,107)
Cash and cash equivalents 6,318 6,588 6,739
Net debt (ex-IFRS 16) (5,917) (9,821) (6,368)
Leases payable (1,529) (1,816) (1,804)
Net debt (7,446) (11,636) (8,172)
Net debt/LTM Adjusted EBITDA¹ 1.9x 3.0x 2.2x
Average cost of debt
106% DI 105% DI 96% DI
DI + 0.7% DI + 0.2% DI - 0.5%
Average cash yield (% DI) 96% 61% 79%
Average debt duration (years) 4.3 4.9 4.2
¹ LTM Adjusted EBITDA does not include Extrafarma’s impairments, capital gain and closing adjustments from the sales of ConectCar, Oxiteno and
Extrafarma; furthermore, for 2Q22 does not include LTM result from Oxiteno and, for 3Q22, does not include LTM result from Oxiteno and Extrafarma
Ultrapar ended 3Q22 with net financial debt of R$ 5.9 billion, composed of a gross indebtedness of R$ 12.2 billion, and
cash position of R$ 6.3 billion. Considering the leases payable (IFRS 16) of R$ 1.5 billion, the total net debt was R$ 7.4
billion (1.9x LTM Adjusted EBITDA) compared to R$ 8.2 billion on June 30, 2022 (2.2x LTM Adjusted EBITDA). The reduction
in the net debt in comparison to the position at the end of 2Q22 is mainly due to the conclusion of the sale of Extrafarma
in August 2022 (upfront payment and outflows of the respective leases payable) and the release of cash in working
capital, resulting from the reductions of fuel prices in 3Q22 and from inventory management. These effects were
attenuated by the payment of interest on equity in August 2022. The financial leverage reduction reflects the reduction
of the net debt and the growth in EBITDA from continuing operations. It is worth mentioning that there are receivables
not yet included in Ultrapar's net debt related to the sales (i) of Oxiteno (US$ 150 million to be received in April 2024),
and (ii) of Extrafarma (R$ 365 million, monetarily adjusted by CDI + 0.5% p.a., to be received in two installments, the first
in August 2023 and the second in August 2024).
Maturity profile and debt breakdown:
6,318
3,463
1,096
347 276
2,344
4,710
Cash and
cash
equivalents
Up to 1 year From 1 to 2
years
From 2 to 3
years
From 3 to 4
years
From 4 to 5
years
> 5 years
Local currency
Foreign currency
Hedged
Non hedged
Result from currency and
interest hedging instruments
8
3rd
QUARTER OF 2022
8
Updates on ESG themes
In September, Ultrapar participated in Rio Oil & Gas 2022, an event organized by the Brazilian Institute of Oil and Gas
(IBP), which brought together the main companies in the sector to discuss several topics, including energy transition
and ESG. Ipiranga and Ultracargo were sponsors of the event, and leaders from the Holding, Ipiranga, Ultragaz and
Ultracargo participated in discussion panels and parallel events, such as the Arena ESG and Young Summit. In addition,
during the quarter, Ultrapar held immersive meetings of its Social Acceleration Program, which had the participation
of more than 100 volunteers and supported 13 NGOs in their management challenges, maximizing their social impact.
In all, more than 400 solutions were proposed that could positively impact more than 9 thousand people served by the
institutions. Ultrapar entered into a partnership, in July, with Amazônia+21 Institute, an organization created by the CNI
(National Confederation of Industry), which seeks to promote sustainable and innovative businesses in Amazon, in
addition to contributing to the region's sustainable economic development.
In July, Ultragaz donated food baskets, hygiene kits, diapers and water to 1.8 thousand vulnerable families, victims of
heavy rains in Jaboatão dos Guararapes (state of Pernambuco). In August, Ultragaz started the Theater in Action
project, which will present the play “Missão Natureza” in 15 cities and 11 Brazilian states, promoting children's awareness
about the importance of reducing waste generation. In addition, Ultragaz joined the Commitment to the Climate
program promoted by the Ekos Institute in partnership with other companies, which aims to encourage the low-carbon
economy and facilitate the selection and support of socio-environmental projects to offset GHG emissions.
Ultracargo started, in September, another edition of the Training of Port Operators course, providing 25 positions for
residents around the Aratu Terminal (state of Bahia). The program is offered free of charge and seeks to contribute to
the professional development of residents and attract talent to operations, fostering diversity. During 3Q22, registrations
were opened for the Community in Action Award, promoted by Grupo Tribuna (Santos-SP) sponsored by Ultracargo.
The initiative, which is in its 20th edition, values voluntary actions by groups, institutions, or individuals for the benefit of
social causes in the region.
In July, Ipiranga launched the 15th edition of the Health on the Road Program, which offers free medical care and
services to drivers, truck drivers and communities close to Ipiranga highway service stations, with the expectation of
serving 70 cities in 15 states by the end of the year. Furthermore, it launched Programa Construa, an affirmative action
for the hiring and development of people with special needs in the commercial area. In September, Ipiranga
concluded Projeto Ajudôu, a social project related to the sports incentive law, 100% financed by the company, which
promoted the inclusion of 320 children and young people in situations of social vulnerability in Minas Gerais through
the practice of judo.
9
3rd
QUARTER OF 2022
9
Source: Broadcast
Capital markets
Ultrapar’s combined average daily financial volume on B3 and NYSE totaled R$ 89 million/day in 3Q22 (-42% YoY).
Ultrapar’s shares ended the quarter quoted at R$ 11.73 on B3, a depreciation of 5% in the quarter, while the Ibovespa
stock index appreciated 12%. In NYSE, Ultrapar’s shares and Dow Jones stock index depreciated 7% in the quarter.
Ultrapar ended 3Q22 with a market cap of R$ 13 billion.
Capital markets 3Q22 3Q21 2Q22 9M22 9M21
Final number of shares (000) 1,115,173 1,115,108 1,115,152 1,115,173 1,115,108
Market capitalization¹ (R$ million) 13,081 16,437 13,728 13,081 16,437
B3
Average daily trading volume (000 shares) 5,741 8,210 7,891 6,748 6,934
Average daily financial volume (R$ 000) 74,580 133,350 105,168 90,850 131,489
Average share price (R$/share) 12.99 16.24 13.33 13.46 18.96
NYSE
Quantity of ADRs² (000 ADRs) 54,163 50,374 50,438 54,163 50,374
Average daily trading volume (000 ADRs) 1,122 1,205 1,480 1,298 1,669
Average daily financial volume (US$ 000) 2,771 3,744 3,938 3,405 6,118
Average share (US$/ADRs) 2.47 3.11 2.66 2.62 3.67
Total
Average daily trading volume (000 shares) 6,863 9,415 9,371 8,046 8,602
Average daily financial volume (R$ 000) 89,150 152,939 124,690 108,284 164,371
¹ Calculated on the closing share price for the period
² 1 ADR = 1 common share
UGPA3 x Ibovespa performance – 3Q22
(Jun 30, 2022 = 100)
10
3rd
QUARTER OF 2022
10
3Q22 Conference call
Ultrapar will host a conference call for analysts and investors on November 10, 2022, to comment on the
Company’s performance in the third quarter of 2022 and outlook. The presentation will be available for
download in the Company’s website 30 minutes prior to the conference call.
The conference call will be transmitted via webcast and held in Portuguese with simultaneous translation into
English. The access link is available at ri.ultra.com.br. Please connect 10 minutes in advance.
Conference call in Portuguese with simultaneous translation to English
Time: 11:00 a.m. (BRT) / 09:00 a.m. (EST)
Participants in Brazil: +55 (11) 3181-8565 or +55 (11) 4090-1621
Code: Ultrapar – in Portuguese
Replay: +55 (11) 3193-1012 (available for seven days)
Code: 3167603#
International participants: +1 (844) 204-8942 or +1 (412) 717-9627
Code: Ultrapar – in English
Replay: +55 (11) 3193-1012 (available for seven days)
Code: 9792937#
11
3rd
QUARTER OF 2022
11
In million of Reais SEP 22¹ SEP 21 JUN 22
Continuing
operations²
Discontinued
operations²
ASSETS
Cash and cash equivalents 4,626.7 2,826.3 4,745.1 4,707.3 37.8
Financial investments and hedge derivative financial instruments 1,264.0 2,914.9 1,372.8 1,372.8 (0.0)
Trade receivables and reseller financing 4,557.2 4,624.4 4,547.1 4,423.9 123.2
Trade receivables - sale of subsidiaries 186.1 - - - -
Inventories 4,333.7 5,574.2 6,573.3 6,010.5 562.8
Recoverable taxes 1,358.7 1,540.7 1,488.9 1,422.1 66.8
Prepaid expenses 123.8 141.2 152.3 143.1 9.1
Contractual assets with customers - exclusive rights 599.6 533.7 579.4 579.4 -
Other receivables 88.1 106.4 119.1 101.5 17.6
Total Current Assets 17,137.8 18,261.8 19,578.0 18,760.6 817.3
Financial investments and hedge derivative financial instruments 427.6 847.3 621.3 621.3 -
Trade receivables and reseller financing 549.3 481.4 513.9 513.9 -
Trade receivables - sale of subsidiaries 928.0 - 707.6 707.6 -
Deferred income and social contribution taxes 1,021.4 1,245.5 1,016.6 812.1 204.5
Recoverable taxes 1,622.6 1,815.2 1,352.2 1,330.6 21.7
Escrow deposits 880.1 868.4 875.1 871.4 3.7
Prepaid expenses 79.8 84.3 64.9 64.9 0.0
Contractual assets with customers - exclusive rights 1,691.6 1,385.2 1,646.2 1,646.2 -
Other receivables 155.1 175.1 154.3 154.3 -
Investments 119.1 172.4 117.2 117.2 -
Right of use assets 1,804.7 2,093.0 2,049.9 1,723.2 326.8
Property, plant and equipment 5,775.2 8,235.0 5,768.7 5,624.6 144.1
Intangible assets 1,875.0 1,707.7 1,828.4 1,751.1 77.3
Total Non-Current Assets 16,929.3 19,110.5 16,716.2 15,938.1 778.1
TOTAL ASSETS 34,067.2 37,372.3 36,294.2 34,698.8 1,595.4
LIABILITIES
- - - - -
Loans, financing and hedge derivative financial instruments 889.5 945.6 324.3 324.3 -
Debentures 2,573.5 1,475.4 3,382.8 3,382.8 -
Trade payables 6,097.8 6,364.1 6,889.7 6,680.8 208.9
Salaries and related charges 416.2 549.0 376.3 321.4 54.8
Taxes payable 316.1 396.5 534.2 515.7 18.5
Leases payable 218.4 269.5 278.8 206.6 72.2
Other payables 683.7 345.1 889.2 886.4 2.8
Total Current Liabilities 11,195.2 10,345.2 12,675.3 12,318.1 357.3
Loans, financing and hedge derivative financial instruments 4,572.6 8,458.9 5,178.4 5,178.4 0.0
Debentures 4,200.2 5,529.2 4,221.4 4,221.4 -
Provisions for tax, civil and labor risks 1,011.5 797.2 989.7 987.7 2.0
Post-employment benefits 199.8 262.8 197.3 197.0 0.3
Leases payable 1,310.6 1,546.3 1,525.1 1,215.3 309.8
Other payables 206.0 247.8 214.7 212.4 2.2
Total Non-Current Liabilities 11,500.6 16,842.1 12,326.5 12,012.2 314.3
TOTAL LIABILITIES 22,695.8 27,187.4 25,001.8 24,330.2 671.6
EQUITY
- - - - -
Share capital 5,171.8 5,171.8 5,171.8 5,171.8 -
Reserves 5,467.4 5,008.3 5,467.6 5,467.6 -
Treasury shares (489.0) (489.1) (488.4) (488.4) -
Other 761.3 104.9 690.3 690.3 -
Non-controlling interests in subsidiaries 460.0 389.1 451.2 451.2 -
Total Equity 11,371.4 10,185.0 11,292.4 11,292.4 -
TOTAL LIABILITIES AND EQUITY 34,067.2 37,372.3 36,294.2 35,622.6 671.6
Cash and financial investments 6,318.3 6,588.4 6,739.2 n/a n/a
Loans and debentures (12,235.8) (16,409.1) (13,106.8) n/a n/a
Leases payable (1,528.9) (1,815.8) (1,803.9) n/a n/a
Net cash (debt) (7,446.4) (11,636.4) (8,171.5) n/a n/a
Net cash (debt) ex-IFRS 16 (5,917.5) (9,820.7) (6,367.6) n/a n/a
¹ Balance sheet of 3Q22 corresponds to continuing operations only
² Since the financial management is unified in the Holding, the indiv idual v iew of the balance sheet of continuing and discontinued operations does not reflect the reality of the companies (assets and liabilities differ)
ULTRAPAR
CONSOLIDATED BALANCE SHEET
12
3rd
QUARTER OF 2022
12
In million of Reais 3Q22¹
Continuing
operations
Discontinued
operations¹
3Q21
Continuing
operations
Discontinued
operations
2Q22
Continuing
operations
Discontinued
operations
9M22 9M21
Net revenues from sales and services 39,483.8 39,294.7 189.0 31,911.1 29,452.5 2,458.7 37,425.1 36,879.4 545.8 110,944.9 84,387.5
Cost of products and services sold (37,900.5) (37,708.7) (191.8) (30,112.2) (28,270.2) (1,842.0) (35,401.7) (35,027.5) (374.1) (105,254.8) (79,376.8)
Gross profit 1,583.3 1,586.1 (2.8) 1,798.9 1,182.3 616.7 2,023.5 1,851.9 171.6 5,690.1 5,010.6
Operating expenses
Selling and marketing (563.0) (508.8) (54.2) (781.5) (504.8) (276.7) (699.0) (546.6) (152.4) (2,017.3) (2,140.2)
General and administrative (409.7) (388.6) (21.1) (497.7) (344.0) (153.8) (448.8) (408.2) (40.6) (1,315.9) (1,439.6)
- - -
Other operating income, net (174.9) (174.9) (0.0) 35.6 10.9 24.7 (137.7) (136.9) (0.8) (405.9) 101.5
Results from disposal of assets 13.3 49.2 (35.9) 18.0 17.5 0.6 343.5 55.6 287.9 379.4 58.2
Impairment - - - - - - - - - - (394.7)
Operating income (loss) 449.0 562.9 (114.0) 573.4 361.9 211.5 1,081.5 815.8 265.8 2,330.3 1,195.8
Financial result
Financial income 176.6 176.4 0.2 127.0 114.7 12.3 210.2 209.7 0.5 498.5 339.1
Financial expenses (504.8) (501.1) (3.6) (423.0) (368.4) (54.5) (719.7) (708.3) (11.4) (1,694.2) (971.6)
Share of profit (loss) of subsidiaries, joint ventures and associates (11.1) (11.1) - (11.1) (11.3) 0.2 7.7 7.7 - 9.9 (22.0)
Income before income and social contribution taxes 109.7 227.0 (117.4) 266.3 96.8 169.5 579.7 324.8 254.8 1,144.5 541.3
Income and social contribution taxes
Current (126.3) (271.0) 144.7 (20.2) (44.8) 24.6 (357.1) (100.9) (256.2) (773.6) (383.9)
Deferred 78.7 203.8 (125.1) 95.9 91.6 4.3 208.2 157.4 50.8 474.6 269.8
Tax incentives 20.4 20.4 - 32.3 17.9 14.4 15.7 15.7 - 79.7 66.3
- - -
Net effect of the cessation of depreciation² - - - - - - 13.5 - 13.5 78.5 -
Net income (loss) 82.6 180.3 (97.7) 374.3 161.5 212.8 459.9 397.0 62.9 1,003.7 493.4
Net income attributable to:
Shareholders of the Company 73.1 170.8 (97.7) 369.2 156.4 212.8 452.9 390.0 62.9 978.2 470.3
Non-controlling interests in subsidiaries 9.5 9.5 - 5.1 5.1 - 7.1 7.1 - 25.5 23.2
Adjusted EBITDA 838.4 939.3 (100.9) 1,017.3 651.0 366.3 1,494.4 1,189.0 305.4 3,645.8 2,517.1
Non-recurring items
Results from disposal of assets (Ipiranga) (49.3) (49.3) - (17.9) (17.9) - (53.0) (53.0) - (128.2) (55.4)
Extemporaneous tax credits (Ipiranga) - - - (37.9) (37.9) - (32.7) (32.7) - (32.7) (134.8)
Extemporaneous tax credits (Oxiteno) - - - - - - - - - (62.4) -
Capital gain from the sale of Oxiteno - - - - - - (289.2) - (289.2) (289.2) -
Adjustments from the sale of Oxiteno 31.6 - 31.6 - - - - - - 31.6 -
Impairment (Extrafarma) - - - - - - - - - - 394.7
Pre-closing expenses provisions (Extrafarma) 67.4 - 67.4 - - - - - - 67.4 -
Adjustments from the sale of Extrafarma 4.7 - 4.7 - - - - - - 4.7 -
Recurring Adjusted EBITDA 892.8 890.0 2.8 961.5 595.2 366.3 1,119.5 1,103.3 16.1 3,236.9 2,721.5
Depreciation and amortization³ 400.6 387.5 13.1 417.0 300.4 116.6 405.2 365.6 39.6 1,257.6 1,214.3
- - - - - -
Cash flow hedge from bonds - - - 38.0 - 38.0 - - - 48.1 129.0
- - - - - -
Total investments4
525.2 523.6 1.7 491.4 427.1 64.3 411.6 406.8 4.7 1,319.3 1,182.8
- - - - - -
Ratios - - - - - -
Earnings per share (R$) 0.07 0.16 (0.09) 0.34 0.14 0.20 0.42 0.36 0.06 0.90 0.43
Net debt / LTM Adjusted EBITDA5
1.9x n/a n/a 3.0x n/a n/a 2.2x n/a n/a 1.9x 3.0x
Gross margin (%) 4.0% 4.0% (1.5%) 5.6% 4.0% 25.1% 5.4% 5.0% 31.4% 5.1% 5.9%
Operating margin (%) 1.1% 1.4% (60.3%) 1.8% 1.2% 8.6% 2.9% 2.2% 48.7% 2.1% 1.4%
Adjusted EBITDA margin (%) 2.1% 2.4% (53.4%) 3.2% 2.2% 14.9% 4.0% 3.2% 56.0% 3.3% 3.0%
Recurring Adjusted EBITDA margin (%) 2.3% 2.3% 1.5% 3.0% 2.0% 14.9% 3.0% 3.0% 3.0% 2.9% 3.2%
- - -
Number of employees 9,644 9,644 - 16,218 8,507 7,711 14,958 9,350 5,608 9,644 16,218
¹ Considers Extrafarma's result for July only, due to the conclusion of its sale on August 1st
, 2022
² As of 01/01/2022, the depreciation and amortization of discontinued operations was ceased, after the reclassification to current assets, in the line of assets held for sale, according to item 25 of CPC 31 / IFRS 5
³ Includes amortization with contractual assets with customers – exclusiv e rights
INCOME STATEMENT
ULTRAPAR
4
Includes property, plant and equipment and additions to intangible assets (net of div estitures), contractual assets with customers (exclusiv e rights), initial direct costs of assets with right of use, contributions made to SPEs (Specific Purpose Companies), payment of grants, financing of clients, rental adv ances (net of repayments) and
acquisition of shareholdings
5
LTM Adjusted EBITDA does not include Extrafarma’s impairments, capital gain and closing adjustments from the sales of ConectCar, Oxiteno and Extrafarma; furthermore, for 2Q22 does not include LTM result from Oxiteno and, for 3Q22, does not include LTM result from Oxiteno and Extrafarma
13
3rd
QUARTER OF 2022
13
JAN -SEP
2022
JAN - SEP
2021
Re-presented
Cash flows from operating continuing activities
Net income - continuing operations 694.2 476.9
Adjustments to reconcile net income to cash provided by operating activities
Share of loss (profit) of subsidiaries, joint ventures and associates (10.1) 22.2
Amortization of contractual assets with customers - exclusive rights and right-of-use assets 543.8 392.5
Depreciation and amortization 550.4 488.8
Interest and foreign exchange rate variations 1,208.4 861.8
Current and deferred income and social contribution taxes (2.2) 117.2
Results from disposal of assets (129.8) (57.9)
Equity instrument granted 16.8 6.9
Provision for decarbonization - CBios 497.1 111.2
Other provisions and adjustments 12.2 (79.5)
3,380.7 2,340.1
(Increase) decrease in assets
Trade receivables and reseller financing (637.7) (621.6)
Inventories (420.3) (1,329.1)
Recoverable taxes (736.2) (571.9)
Dividends received from subsidiaries, joint ventures and associates 0.1 0.1
Other assets (176.1) (11.3)
Increase (decrease) in liabilities
Trade payables and trade payables - reverse factoring 270.8 1,680.1
Salaries and related charges 86.1 59.6
Tax obligations (41.7) (12.2)
Other liabilities 67.9 (79.9)
CBios acquisition (542.5) (121.9)
Payments of contractual assets with customers - exclusive rights (512.3) (222.6)
Income and social contribution taxes paid (283.3) (164.8)
Net cash provided by (used in) operating activities - continuing operations 455.6 944.5
Net cash provided by (used in) operating activities - discontinued operations 30.6 937.9
Net cash provided by (used in) operating activities 486.1 1,882.4
Cash flows from investing activities
Financial investments, net of redemptions 902.1 2,151.6
Acquisition of property, plant and equipment and intangible assets (851.0) (844.6)
Receipt of the intercompany loan due by Oxiteno S.A to Ultrapar International 3,980.7 -
Proceeds from disposal of investments and assets 2,734.4 97.1
Capital increase in subsidiary and joint ventures (28.0) (25.7)
Transactions with discontinued operations 987.9 -
Capital decrease in associates - 1.5
Initial upfront costs of entitlement assets - (14.9)
Related parties - (21.6)
Net cash provided by (used in) investing activities - continuing operations 7,726.2 1,343.3
Net cash provided by (used in) investing activities - discontinued operations (220.2) (129.2)
Net cash provided by (used in) investing activities 7,506.0 1,214.0
Cash flows from financing activities
Loans and debentures
Proceeds 1,019.6 1,379.0
Amortization (4,966.7) (2,426.1)
Interest paid (961.9) (451.1)
Payments of leases¹ (272.9) (251.1)
Dividends paid (634.7) (705.6)
Capital increase made by non-controlling interests and redemption of shares 21.7 -
Related parties (18.9) (0.2)
Net cash provided by (used in) financing activities - continuing operations (5,813.8) (2,455.1)
Net cash provided by (used in) financing activities - discontinued operations (179.0) (514.8)
Net cash provided by (used in) financing activities (5,992.8) (2,969.9)
Effect of exchange rate changes on cash and cash equivalents in foreign currency - continuing operations (21.3) (10.7)
Effect of exchange rate changes on cash and cash equivalents in foreign currency - discontinued operations (19.3) 48.9
Effect of exchange rate changes on cash and cash equivalents in foreign currency (40.7) 38.2
Increase (decrease) in cash and cash equivalents - continuing operations 2,346.6 164.8
Increase (decrease) in cash and cash equivalents - descontinued operations (388.0) -
Increase (decrease) in cash and cash equivalents 1,958.6 164.8
Cash and cash equivalents at the beginning of the period - continuing operations 2,280.1 2,661.5
Cash and cash equivalents at the beginning of the period - descontinued operations 388.0 -
Cash and cash equivalents at the beginning of the period 2,668.1 2,661.5
Cash and cash equivalents at the end of the period - continuing operations 4,626.6 2,826.3
Cash and cash equivalents at the end of the period - descontinued operations - -
Cash and cash equivalents at the end of the period 4,626.6 2,826.3
Transactions without cash effect:
Addition on right to use assets and leases payable 420.8 204.5
Addition on contractual assets with customers - exclusive rights 38.8 197.9
Reversal fund - private pension 3.1 3.7
Issuance of shares related to the subscription warrants - indemnification - Extrafarma acquisition 0.9 1.8
ULTRAPAR
CASH FLOWS
In million of Reais
¹ Includes R$ 32 million and R$ 29 million related to the grant of Ultracargo’s terminal in Vila do Conde in 1Q22 and 1Q21, respectiv ely, R$ 16 million related to the grant of Ipiranga's
terminal in Belém in 2Q22 and R$ 12 million related to the grant of Ipiranga's terminal in Vitória in 3Q22
14
3rd
QUARTER OF 2022
14
In million of Reais SEP 22 SEP 21 JUN 22
OPERATING ASSETS
Trade receivables 591.8 472.4 569.6
Non-current trade receivables 17.1 29.9 18.8
Inventories 196.9 177.3 199.2
Taxes 103.8 86.0 100.8
Escrow deposits 200.6 220.0 207.6
Other 89.6 79.1 84.5
Right of use assets 151.8 89.4 124.6
Property, plant and equipment / Intangibles 1,274.8 1,181.2 1,245.4
TOTAL OPERATING ASSETS 2,626.3 2,335.2 2,550.4
OPERATING LIABILITIES
Trade payables 193.4 119.5 166.0
Salaries and related charges 120.8 99.0 89.9
Taxes 13.9 15.8 16.5
Judicial provisions 126.2 124.2 125.2
Leases payable 189.5 141.4 162.3
Other 71.4 53.9 83.7
TOTAL OPERATING LIABILITIES 715.1 553.8 643.6
In million of Reais 3Q22 3Q21 2Q22 9M22 9M21
Net revenues 3,067.5 2,679.5 2,944.2 8,651.0 7,063.0
- - - - -
Cost of products sold (2,605.2) (2,352.7) (2,550.8) (7,479.0) (6,280.0)
Gross profit 462.3 326.8 393.4 1,171.9 783.0
Operating expenses
Selling and marketing (146.3) (120.8) (144.8) (414.2) (329.2)
General and administrative (62.4) (53.1) (61.1) (178.2) (150.7)
Other operating income 3.6 2.9 0.3 8.2 10.3
Results from disposal of assets (0.1) (0.4) (0.1) (0.9) 2.5
Operating income (loss) 257.2 155.3 187.6 586.8 315.8
Share of profit (loss) of subsidiaries, joint ventures and associates (0.0) (0.0) 0.0 0.0 0.0
Adjusted EBITDA 332.4 220.5 261.0 806.6 507.2
Depreciation and amortization¹ 75.2 65.1 73.4 219.8 191.4
Ratios - - - - -
Gross margin (R$/ton) 1,026 721 925 919 603
Operating margin (R$/ton) 571 343 441 460 243
Adjusted EBITDA margin (R$/ton) 738 486 614 633 391
Number of employees 3,496 3,409 3,420 3,496 3,409
¹ Includes amortization with contractual assets with customers - exclusiv e rights
CONSOLIDATED BALANCE SHEET
ULTRAGAZ
CONSOLIDATED INCOME STATEMENT
15
3rd
QUARTER OF 2022
15
In million of Reais SEP 22 SEP 21 JUN 22
OPERATING ASSETS
Trade receivables 17.2 25.3 19.5
Inventories 10.4 8.7 9.7
Taxes 7.7 24.1 13.6
Other 37.8 23.8 39.2
Right of use assets 655.6 536.8 580.1
Property, plant and equipment / Intangibles / Investments 1,759.5 1,659.9 1,710.5
TOTAL OPERATING ASSETS 2,488.3 2,278.7 2,372.7
OPERATING LIABILITIES
Trade payables 61.8 44.9 48.2
Salaries and related charges 46.9 44.6 37.6
Taxes 4.8 5.2 8.8
Judicial provisions 9.7 10.1 9.5
Leases payable 598.4 481.4 514.4
Other¹ 63.2 61.0 72.1
TOTAL OPERATING LIABILITIES 784.8 647.3 690.5
In million of Reais 3Q22 3Q21 2Q22 9M22 9M21
Net revenues 224.5 177.8 216.8 638.8 525.7
Cost of services provided (80.9) (69.2) (87.7) (252.3) (207.8)
Gross profit 143.6 108.7 129.1 386.4 317.9
Operating expenses
Selling and marketing (2.4) (2.2) (2.8) (9.1) (6.2)
General and administrative (36.8) (30.5) (31.8) (95.2) (93.9)
- - - - -
Other operating income (0.4) 0.8 (0.1) (1.7) 4.0
Results from disposal of assets 0.0 (0.0) (0.1) (0.2) 0.0
Operating income (loss) 104.1 76.7 94.3 280.3 221.8
Share of profit (loss) of subsidiaries, joint ventures and associates (0.5) 0.1 (0.3) (1.4) 0.7
Adjusted EBITDA 136.3 102.1 129.6 379.8 294.8
Depreciation and amortization 32.8 25.2 35.6 100.9 72.3
Ratios
Gross margin (%) 64.0% 61.1% 59.6% 60.5% 60.5%
Operating margin (%) 46.4% 43.2% 43.5% 43.9% 42.2%
Adjusted EBITDA margin (%) 60.7% 57.4% 59.8% 59.5% 56.1%
Number of employees 869 736 864 869 736
¹ Includes the long term obligations with clients account
CONSOLIDATED BALANCE SHEET
ULTRACARGO
CONSOLIDATED INCOME STATEMENT
16
3rd
QUARTER OF 2022
16
In million of Reais SEP 22 SEP 21 JUN 22
OPERATING ASSETS
Trade receivables 3,940.6 3,119.6 3,855.9
Non-current trade receivables 532.2 451.4 495.1
Inventories 4,125.4 3,436.6 5,800.0
Taxes 2,485.7 1,820.3 2,214.2
Contractual assets with customers - exclusive rights 2,288.1 1,914.4 2,222.1
Other 501.8 481.2 491.6
Right of use assets 990.3 1,043.8 1,011.6
Property, plant and equipment / Intangibles / Investments 4,310.4 3,669.5 4,114.7
TOTAL OPERATING ASSETS 19,174.5 15,936.6 20,205.2
OPERATING LIABILITIES
Trade payables 5,768.5 4,773.3 6,401.7
Salaries and related charges 177.3 130.9 138.2
Post-employment benefits 213.0 269.0 210.5
Taxes 164.6 178.2 176.2
Judicial provisions 287.0 212.9 305.0
Leases payable 733.1 730.4 737.5
Other 654.2 370.3 483.3
TOTAL OPERATING LIABILITIES 7,997.8 6,665.0 8,452.4
In million of Reais 3Q22 3Q21 2Q22 9M22 9M21
Net revenues 35,999.1 26,613.8 33,706.0 98,375.1 70,322.6
Cost of products and services sold (35,004.4) (25,891.8) (32,391.5) (95,025.8) (68,106.8)
Gross profit 994.7 722.0 1,314.5 3,349.4 2,215.7
Operating expenses
Selling and marketing (359.5) (361.2) (398.2) (1,131.7) (981.5)
General and administrative (230.5) (184.9) (247.7) (657.1) (544.7)
Other operating income (176.1) 5.2 (129.9) (416.3) 59.1
Results from disposal of assets 49.3 17.9 53.0 128.2 55.4
Operating income (loss) 277.9 199.0 591.7 1,272.4 804.1
Share of profit (loss) of subsidiaries, joint ventures and associates (12.4) 0.6 0.8 (10.4) (1.3)
Adjusted EBITDA 532.7 398.1 840.0 1,992.2 1,382.9
Non-recurring items
Results from disposal of assets (49.3) (17.9) (53.0) (128.2) (55.4)
Extemporaneous tax credits - (37.9) (32.7) (32.7) (134.8)
Recurring Adjusted EBITDA 483.4 342.3 754.3 1,831.3 1,192.6
Depreciation and amortization¹ 267.2 198.5 247.5 730.3 580.1
Ratios
Gross margin (R$/m³) 165 123 234 197 132
Operating margin (R$/m³) 46 34 105 75 48
Adjusted EBITDA margin (R$/m³) 88 68 149 117 82
Recurring Adjusted EBITDA margin (R$/m³) 80 58 134 108 71
Number of service stations 6,940 7,088 7,010 6,940 7,088
Number of employees 4,587 3,778 4,363 4,587 3,778
¹ Includes amortization with contractual assets with customers - exclusiv e rights
CONSOLIDATED BALANCE SHEET
IPIRANGA
CONSOLIDATED INCOME STATEMENT
17
3rd
QUARTER OF 2022
17
In million of Reais SEP 22 SEP 21 JUN 22
OPERATING ASSETS
Trade receivables - 35.0 123.2
Inventories - 527.0 562.8
Taxes - 74.8 86.5
Other - 33.3 35.1
Right of use assets - 352.8 313.2
Property, plant and equipment / Intangibles - 247.4 207.9
TOTAL OPERATING ASSETS - 1,270.4 1,328.6
OPERATING LIABILITIES
Trade payables - 194.2 208.9
Salaries and related charges - 62.4 54.8
Taxes - 14.9 18.5
Judicial provisions - 10.2 2.5
Leases payable - 383.9 382.0
Other - 19.2 10.6
TOTAL OPERATING LIABILITIES - 684.8 677.3
In million of Reais 3Q22¹ 3Q21 2Q22 9M22 9M21
Gross revenues 199.9 509.6 575.8 1,304.7 1,568.6
Sales returns, discounts and taxes (10.9) (26.2) (30.0) (69.2) (81.5)
Net revenues 189.0 483.4 545.8 1,235.5 1,487.1
Cost of products and services sold (191.8) (333.7) (374.1) (912.3) (1,032.1)
Gross profit (2.8) 149.7 171.6 323.2 455.0
Operating expenses (75.0) (175.3) (192.1) (436.2) (520.0)
Other operating income (0.0) 2.7 (0.8) (2.2) 0.0
Results from disposal of assets 0.5 0.8 (1.3) (3.8) 0.2
Impairment - - - - (394.7)
Operating income (loss) (77.3) (22.1) (22.6) (119.0) (459.5)
Adjusted EBITDA (64.2) 17.0 17.0 (26.6) (344.5)
Non-recurring items
Impairment - - - - 394.7
Pre-closing expenses provisions 67.4 - - 67.4 -
Recurring Adjusted EBITDA 3.1 17.0 17.0 40.7 50.2
Depreciation and amortization 13.1 39.1 39.7 92.4 115.0
Ratios²
Gross margin (%) (1.4%) 29.4% 29.8% 24.8% 29.0%
Operating margin (%) (38.7%) (4.3%) (3.9%) (9.1%) (29.3%)
Adjusted EBITDA margin (%) (32.1%) 3.3% 3.0% (2.0%) (22.0%)
Recurring Adjusted EBITDA margin (%) 1.6% 3.3% 3.0% 3.1% 3.2%
Number of stores - 399 399 - 399
Number of employees - 5,838 5,608 - 5,838
¹ Considers Extrafarma's result for July only, due to the conclusion of its sale on August 1st
, 2022
² Calculated based on gross rev enues
BALANCE SHEET
EXTRAFARMA
INCOME STATEMENT

Weitere ähnliche Inhalte

Ähnlich wie Ultrapar - 3T22

019348000101011 (4).pdf
019348000101011 (4).pdf019348000101011 (4).pdf
019348000101011 (4).pdfRenandantas16
 
018376000101011 (5).pdf
018376000101011 (5).pdf018376000101011 (5).pdf
018376000101011 (5).pdfRenandantas16
 
Apresentação dos resultados 2 t12
Apresentação dos resultados 2 t12Apresentação dos resultados 2 t12
Apresentação dos resultados 2 t12comgasri
 
009512000101011 (34).pdf
009512000101011 (34).pdf009512000101011 (34).pdf
009512000101011 (34).pdfRenandantas16
 
004030000101011 (2).pdf
004030000101011 (2).pdf004030000101011 (2).pdf
004030000101011 (2).pdfRenandantas16
 
Apresentação Webcast CPFL Energia_ 2T13_final
Apresentação Webcast CPFL Energia_ 2T13_finalApresentação Webcast CPFL Energia_ 2T13_final
Apresentação Webcast CPFL Energia_ 2T13_finalCPFL RI
 
Apresentação call 1 t 2012 (portugues)
Apresentação call 1 t 2012 (portugues)Apresentação call 1 t 2012 (portugues)
Apresentação call 1 t 2012 (portugues)ideiasnet
 
Apresentação call 1 t 2012 (portugues)
Apresentação call 1 t 2012 (portugues)Apresentação call 1 t 2012 (portugues)
Apresentação call 1 t 2012 (portugues)ideiasnet
 
Apresentação de Resultados 2T17 - CPFL Energia
Apresentação de Resultados 2T17 - CPFL EnergiaApresentação de Resultados 2T17 - CPFL Energia
Apresentação de Resultados 2T17 - CPFL EnergiaCPFL RI
 
Brph apresentação call 4 t13 (pt) v2 (4)
Brph apresentação call 4 t13 (pt) v2 (4)Brph apresentação call 4 t13 (pt) v2 (4)
Brph apresentação call 4 t13 (pt) v2 (4)brpharma
 
Brph apresentação call 4 t13 (pt) v2
Brph apresentação call 4 t13 (pt) v2Brph apresentação call 4 t13 (pt) v2
Brph apresentação call 4 t13 (pt) v2brpharma
 
Apresentação 1 t12
Apresentação 1 t12Apresentação 1 t12
Apresentação 1 t12TriunfoRi
 
Apresentação dos resultados 1 t12
Apresentação dos resultados 1 t12Apresentação dos resultados 1 t12
Apresentação dos resultados 1 t12TriunfoRi
 
Apresentação de Resultados 2T18 - CPFL Energia
Apresentação de Resultados 2T18 - CPFL EnergiaApresentação de Resultados 2T18 - CPFL Energia
Apresentação de Resultados 2T18 - CPFL EnergiaCPFL RI
 
Apresentacao aes eletropaulo_3_t13_final
Apresentacao aes eletropaulo_3_t13_finalApresentacao aes eletropaulo_3_t13_final
Apresentacao aes eletropaulo_3_t13_finalAES Eletropaulo
 
Apresentação dos Resultados do 2T13
Apresentação dos Resultados do 2T13Apresentação dos Resultados do 2T13
Apresentação dos Resultados do 2T13TegmaRI
 
018376000101011 (15).pdf
018376000101011 (15).pdf018376000101011 (15).pdf
018376000101011 (15).pdfRenandantas16
 

Ähnlich wie Ultrapar - 3T22 (20)

019348000101011 (4).pdf
019348000101011 (4).pdf019348000101011 (4).pdf
019348000101011 (4).pdf
 
018376000101011 (5).pdf
018376000101011 (5).pdf018376000101011 (5).pdf
018376000101011 (5).pdf
 
021636000101011
021636000101011021636000101011
021636000101011
 
Apresentação dos resultados 2 t12
Apresentação dos resultados 2 t12Apresentação dos resultados 2 t12
Apresentação dos resultados 2 t12
 
009512000101011 (34).pdf
009512000101011 (34).pdf009512000101011 (34).pdf
009512000101011 (34).pdf
 
004030000101011 (2).pdf
004030000101011 (2).pdf004030000101011 (2).pdf
004030000101011 (2).pdf
 
Apresentação Webcast CPFL Energia_ 2T13_final
Apresentação Webcast CPFL Energia_ 2T13_finalApresentação Webcast CPFL Energia_ 2T13_final
Apresentação Webcast CPFL Energia_ 2T13_final
 
009393000101011
009393000101011009393000101011
009393000101011
 
Apresentação call 1 t 2012 (portugues)
Apresentação call 1 t 2012 (portugues)Apresentação call 1 t 2012 (portugues)
Apresentação call 1 t 2012 (portugues)
 
Apresentação call 1 t 2012 (portugues)
Apresentação call 1 t 2012 (portugues)Apresentação call 1 t 2012 (portugues)
Apresentação call 1 t 2012 (portugues)
 
Apresentação de Resultados 3 Trimestre 2013
Apresentação de Resultados 3 Trimestre 2013Apresentação de Resultados 3 Trimestre 2013
Apresentação de Resultados 3 Trimestre 2013
 
Apresentação de Resultados 2T17 - CPFL Energia
Apresentação de Resultados 2T17 - CPFL EnergiaApresentação de Resultados 2T17 - CPFL Energia
Apresentação de Resultados 2T17 - CPFL Energia
 
Brph apresentação call 4 t13 (pt) v2 (4)
Brph apresentação call 4 t13 (pt) v2 (4)Brph apresentação call 4 t13 (pt) v2 (4)
Brph apresentação call 4 t13 (pt) v2 (4)
 
Brph apresentação call 4 t13 (pt) v2
Brph apresentação call 4 t13 (pt) v2Brph apresentação call 4 t13 (pt) v2
Brph apresentação call 4 t13 (pt) v2
 
Apresentação 1 t12
Apresentação 1 t12Apresentação 1 t12
Apresentação 1 t12
 
Apresentação dos resultados 1 t12
Apresentação dos resultados 1 t12Apresentação dos resultados 1 t12
Apresentação dos resultados 1 t12
 
Apresentação de Resultados 2T18 - CPFL Energia
Apresentação de Resultados 2T18 - CPFL EnergiaApresentação de Resultados 2T18 - CPFL Energia
Apresentação de Resultados 2T18 - CPFL Energia
 
Apresentacao aes eletropaulo_3_t13_final
Apresentacao aes eletropaulo_3_t13_finalApresentacao aes eletropaulo_3_t13_final
Apresentacao aes eletropaulo_3_t13_final
 
Apresentação dos Resultados do 2T13
Apresentação dos Resultados do 2T13Apresentação dos Resultados do 2T13
Apresentação dos Resultados do 2T13
 
018376000101011 (15).pdf
018376000101011 (15).pdf018376000101011 (15).pdf
018376000101011 (15).pdf
 

Mehr von DIana776890

MAGAZINE LUIZA - RESULTADOS 4T23 E 2023 - LUCRO
MAGAZINE LUIZA - RESULTADOS 4T23 E 2023 - LUCROMAGAZINE LUIZA - RESULTADOS 4T23 E 2023 - LUCRO
MAGAZINE LUIZA - RESULTADOS 4T23 E 2023 - LUCRODIana776890
 
vale-vale3-relatório-produção-vendas-4t23
vale-vale3-relatório-produção-vendas-4t23vale-vale3-relatório-produção-vendas-4t23
vale-vale3-relatório-produção-vendas-4t23DIana776890
 
energisa-engi11-oferta-de-ações-2-bilhões-reais
energisa-engi11-oferta-de-ações-2-bilhões-reaisenergisa-engi11-oferta-de-ações-2-bilhões-reais
energisa-engi11-oferta-de-ações-2-bilhões-reaisDIana776890
 
mitre 4t23 prévia operacional construção
mitre 4t23 prévia operacional construçãomitre 4t23 prévia operacional construção
mitre 4t23 prévia operacional construçãoDIana776890
 
Petrobras PE 2024-2028
Petrobras PE 2024-2028Petrobras PE 2024-2028
Petrobras PE 2024-2028DIana776890
 
casas bahia grupamento de ações
casas bahia grupamento de açõescasas bahia grupamento de ações
casas bahia grupamento de açõesDIana776890
 
localiza aumento de capital
localiza aumento de capitallocaliza aumento de capital
localiza aumento de capitalDIana776890
 
SABESP_Ebook_v9.pdf
SABESP_Ebook_v9.pdfSABESP_Ebook_v9.pdf
SABESP_Ebook_v9.pdfDIana776890
 
prio goldman sachs
prio goldman sachsprio goldman sachs
prio goldman sachsDIana776890
 
banco do brasil 2t23
banco do brasil 2t23banco do brasil 2t23
banco do brasil 2t23DIana776890
 

Mehr von DIana776890 (20)

MAGAZINE LUIZA - RESULTADOS 4T23 E 2023 - LUCRO
MAGAZINE LUIZA - RESULTADOS 4T23 E 2023 - LUCROMAGAZINE LUIZA - RESULTADOS 4T23 E 2023 - LUCRO
MAGAZINE LUIZA - RESULTADOS 4T23 E 2023 - LUCRO
 
vale-vale3-relatório-produção-vendas-4t23
vale-vale3-relatório-produção-vendas-4t23vale-vale3-relatório-produção-vendas-4t23
vale-vale3-relatório-produção-vendas-4t23
 
energisa-engi11-oferta-de-ações-2-bilhões-reais
energisa-engi11-oferta-de-ações-2-bilhões-reaisenergisa-engi11-oferta-de-ações-2-bilhões-reais
energisa-engi11-oferta-de-ações-2-bilhões-reais
 
mitre 4t23 prévia operacional construção
mitre 4t23 prévia operacional construçãomitre 4t23 prévia operacional construção
mitre 4t23 prévia operacional construção
 
Petrobras PE 2024-2028
Petrobras PE 2024-2028Petrobras PE 2024-2028
Petrobras PE 2024-2028
 
bradesco 3t23
bradesco 3t23bradesco 3t23
bradesco 3t23
 
casas bahia grupamento de ações
casas bahia grupamento de açõescasas bahia grupamento de ações
casas bahia grupamento de ações
 
IRB.pdf
IRB.pdfIRB.pdf
IRB.pdf
 
localiza aumento de capital
localiza aumento de capitallocaliza aumento de capital
localiza aumento de capital
 
2w ecobank ipo
2w ecobank ipo2w ecobank ipo
2w ecobank ipo
 
SABESP_Ebook_v9.pdf
SABESP_Ebook_v9.pdfSABESP_Ebook_v9.pdf
SABESP_Ebook_v9.pdf
 
prio goldman sachs
prio goldman sachsprio goldman sachs
prio goldman sachs
 
nubank 2t23
nubank 2t23nubank 2t23
nubank 2t23
 
natura 2t23
natura 2t23natura 2t23
natura 2t23
 
JBS 2t23
JBS 2t23JBS 2t23
JBS 2t23
 
via 2t23
via 2t23via 2t23
via 2t23
 
oi 2t23
oi 2t23oi 2t23
oi 2t23
 
banco do brasil 2t23
banco do brasil 2t23banco do brasil 2t23
banco do brasil 2t23
 
bradesco 2t23
bradesco 2t23bradesco 2t23
bradesco 2t23
 
prio 2t23
prio 2t23prio 2t23
prio 2t23
 

Ultrapar - 3T22

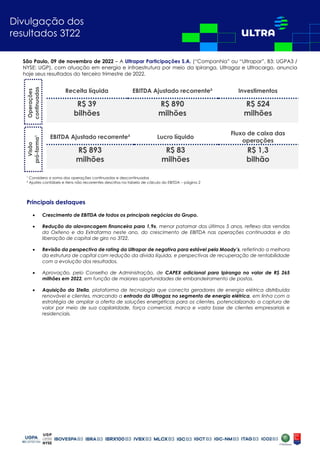
  • 1. Divulgação dos resultados 2T22 Divulgação dos resultados 3T22 São Paulo, 09 de novembro de 2022 – A Ultrapar Participações S.A. (“Companhia” ou “Ultrapar”, B3: UGPA3 / NYSE: UGP), com atuação em energia e infraestrutura por meio da Ipiranga, Ultragaz e Ultracargo, anuncia hoje seus resultados do terceiro trimestre de 2022. Operações continuadas Receita líquida EBITDA Ajustado recorrente² Investimentos R$ 39 bilhões R$ 890 milhões R$ 524 milhões Visão pró-forma¹ EBITDA Ajustado recorrente² Lucro líquido Fluxo de caixa das operações R$ 893 milhões R$ 83 milhões R$ 1,3 bilhão ¹ Considera a soma das operações continuadas e descontinuadas ² Ajustes contábeis e itens não recorrentes descritos na tabela de cálculo do EBITDA – página 2 Principais destaques • Crescimento de EBITDA de todos os principais negócios do Grupo. • Redução da alavancagem financeira para 1,9x, menor patamar dos últimos 5 anos, reflexo das vendas da Oxiteno e da Extrafarma neste ano, do crescimento de EBITDA nas operações continuadas e da liberação de capital de giro no 3T22. • Revisão da perspectiva de rating da Ultrapar de negativa para estável pela Moody’s, refletindo a melhora da estrutura de capital com redução da dívida líquida, e perspectivas de recuperação de rentabilidade com a evolução dos resultados. • Aprovação, pelo Conselho de Administração, de CAPEX adicional para Ipiranga no valor de R$ 265 milhões em 2022, em função de maiores oportunidades de embandeiramento de postos. • Aquisição da Stella, plataforma de tecnologia que conecta geradores de energia elétrica distribuída renovável e clientes, marcando a entrada da Ultragaz no segmento de energia elétrica, em linha com a estratégia de ampliar a oferta de soluções energéticas para os clientes, potencializando a captura de valor por meio de sua capilaridade, força comercial, marca e vasta base de clientes empresariais e residenciais.
  • 2. 2 3° TRIMESTRE DE 2022 2 Considerações sobre as informações financeiras e operacionais Em maio e agosto de 2021 foram assinados os contratos de venda da Extrafarma e da Oxiteno, respectivamente, conforme Fatos Relevantes divulgados na época. Em 31 de dezembro de 2021, a Ultrapar classificou estes negócios como ativos e passivos mantidos para venda e operações descontinuadas. A Oxiteno teve sua venda concluída em 01 de abril de 2022, e por essa razão deixou de compor as operações descontinuadas e os resultados da Ultrapar a partir do 2T22. Já a Extrafarma teve sua venda concluída em 01 de agosto de 2022, e seu resultado até esta data é demonstrado dentro de operações descontinuadas. Neste relatório as informações financeiras referentes à Ultrapar correspondem às informações consolidadas (pró-forma) da Companhia, isto é, os dados consideram a soma das operações continuadas e descontinuadas, exceto quando indicado de outra forma. As informações financeiras apresentadas neste documento foram extraídas das informações contábeis intermediárias (“Informações Trimestrais”) para o período de três meses findo em 30 de setembro de 2022, e preparadas de acordo com o pronunciamento técnico CPC 21 (R1) - Demonstração Intermediária e com a norma internacional IAS 34 - “Interim Financial Reporting”, emitida pelo “International Accounting Standards Board - IASB”, e apresentadas de forma condizente com as normas expedidas pela CVM, aplicáveis à elaboração das Informações Trimestrais. As informações da Ultragaz, Ultracargo, Oxiteno, Ipiranga e Extrafarma são apresentadas sem eliminação de transações realizadas entre segmentos. Portanto, a soma de tais informações pode não corresponder às informações consolidadas (pró-forma) da Ultrapar. Adicionalmente, as informações financeiras e operacionais incluídas nesta discussão de resultados são sujeitas a arredondamentos e, como consequência, os valores totais apresentados nas tabelas e gráficos podem diferir da agregação numérica direta dos valores que os precedem. As informações denominadas EBITDA (Lucro Antes dos Juros, Impostos sobre a Renda e Contribuição Social sobre o Lucro Líquido, Depreciação e Amortização – LAJIDA); EBITDA Ajustado – ajustado pela amortização de ativos de contratos com clientes – direitos de exclusividade e pelo resultado de cash flow hedge dos bonds; EBITDA Ajustado recorrente – ajustado por efeitos não recorrentes; e EBIT (Lucro Antes dos Juros e Impostos sobre a Renda e Contribuição Social sobre o Lucro Líquido – LAJIR) estão apresentadas de acordo com a Instrução 527 emitida pela CVM em 04 de outubro de 2012. Segue o cálculo do EBITDA a partir do lucro líquido: R$ milhões 3T22 3T21 2T22 9M22 9M21 Lucro líquido 82,6 374,3 459,9 1.003,7 493,4 (+) IR e contribuição social 27,1 (108,0) 133,2 219,2 47,9 (+) Despesa (receita) financeira líquida 328,1 296,0 509,6 1.195,7 632,4 (+) Depreciação e amortização 272,3 346,1 288,9 924,3 1.014,5 (+) Efeito líquido da cessação de depreciação - - (13,5) (78,5) - EBITDA 710,2 908,4 1.378,1 3.264,4 2.188,3 Ajustes contábeis (+) Amortização de ativos de contratos com clientes - direitos de exclusividade (Ipiranga) 127,9 70,5 115,9 332,2 198,6 (+) Amortização de ativos de contratos com clientes - direitos de exclusividade (Ultragaz) 0,4 0,4 0,4 1,1 1,2 (+) Resultado de cash flow hedge dos bonds (Oxiteno) - 38,0 - 48,1 129,0 EBITDA Ajustado 838,4 1.017,3 1.494,4 3.645,8 2.517,1 EBITDA Ajustado das operações continuadas 939,3 651,0 1.189,0 3.027,2 2.017,0 Ultragaz 332,4 220,5 261,0 806,6 507,2 Ultracargo 136,3 102,1 129,6 379,8 294,8 Ipiranga 532,7 398,1 840,0 1.992,2 1.382,9 Holding, abastece aí e demais empresas (62,5) (71,8) (42,4) (155,4) (175,6) Eliminações 0,3 2,2 0,9 3,9 7,6 EBITDA Ajustado das operações descontinuadas (100,9) 366,3 305,4 618,6 500,1 Oxiteno - 351,5 - 396,2 852,2 Extrafarma (64,2) 17,0 17,0 (26,6) (344,5) Ganho de capital com a venda da Oxiteno - - 289,2 289,2 - Ajustes da venda da Oxiteno (31,6) - - (31,6) - Ajustes da venda da Extrafarma (4,7) - - (4,7) - Eliminações (0,3) (2,2) (0,9) (3,9) (7,6) Efeitos não recorrentes que afetaram EBITDA (-) Resultado na venda de bens (Ipiranga) (49,3) (17,9) (53,0) (128,2) (55,4) (-) Créditos tributários extemporâneos (Ipiranga) - (37,9) (32,7) (32,7) (134,8) (-) Créditos tributários extemporâneos (Oxiteno) - - - (62,4) - (-) Ganho de capital com a venda da Oxiteno - - (289,2) (289,2) - (+) Ajustes da venda da Oxiteno 31,6 - - 31,6 - (+) Impairment (Extrafarma) - - - - 394,7 (+) Provisões de despesas pré-fechamento (Extrafarma) 67,4 - - 67,4 - (+) Ajustes da venda da Extrafarma 4,7 - - 4,7 - EBITDA Ajustado recorrente 892,8 961,5 1.119,5 3.236,9 2.721,5 EBITDA Ajustado recorrente das operações continuadas 890,0 595,2 1.103,3 2.866,3 1.826,7 Ultragaz 332,4 220,5 261,0 806,6 507,2 Ultracargo 136,3 102,1 129,6 379,8 294,8 Ipiranga 483,4 342,3 754,3 1.831,3 1.192,6 Holding, abastece aí e demais empresas (62,5) (71,8) (42,4) (155,4) (175,6) Eliminações 0,3 2,2 0,9 3,9 7,6 EBITDA Ajustado recorrente das operações descontinuadas 2,8 366,3 16,1 370,7 894,8 Oxiteno - 351,5 - 333,9 852,2 Extrafarma 3,1 17,0 17,0 40,7 50,2 Eliminações (0,3) (2,2) (0,9) (3,9) (7,6) Trimestre Acumulado
  • 3. 3 3° TRIMESTRE DE 2022 3 Ultrapar ¹ Itens não recorrentes descritos na tabela de cálculo do EBITDA – página 2 ² Inclui amortização de ativos de contratos com clientes – direitos de exclusividade ³ Inclui resultado do cash flow hedge dos bonds até o 1T22 4 Inclui R$ 32 milhões e R$ 29 milhões da outorga do terminal de Vila do Conde da Ultracargo no 1T22 e 1T21, respectivamente, R$ 16 milhões da outorga do terminal de Belém da Ipiranga no 2T22 e R$ 12 milhões da outorga da base de Vitória na Ipiranga no 3T22 Receita líquida – Total de R$ 39.484 milhões (+24% vs 3T21 e +6% vs 2T22), em função do aumento na receita líquida em todos os negócios, principalmente na Ipiranga, parcialmente compensado pelos desinvestimentos da Oxiteno e da Extrafarma e subsequentes desconsolidações dos seus resultados em abril e agosto de 2022, respectivamente. EBITDA Ajustado recorrente - Op. continuadas – Total de R$ 890 milhões (+50% vs 3T21), devido aos maiores EBITDAs da Ultragaz, Ipiranga e Ultracargo. Em relação ao 2T22, o EBITDA Ajustado recorrente das operações continuadas reduziu 19%, em função do menor EBITDA da Ipiranga, atenuado pelos maiores EBITDAs da Ultragaz e Ultracargo. EBITDA Ajustado recorrente - Op. descontinuadas – Total de R$ 3 milhões (-99% vs 3T21 e -83% vs 2T22), fruto principalmente da desconsolidação dos resultados da Oxiteno e da Extrafarma. Depreciação e amortização – Total de R$ 401 milhões (-4% vs 3T21 e -1% vs 2T22), em função da desconsolidação dos resultados da Oxiteno e da Extrafarma, parcialmente compensada por maiores investimentos realizados ao longo dos últimos 12 meses e por maiores amortizações de bonificações na Ipiranga. Resultado da Holding, abastece aí e demais empresas – A Ultrapar registrou um resultado negativo de R$ 62 milhões em Holding, abastece aí e demais empresas, composto de (i) R$ 45 milhões de EBITDA negativo com a Holding, (ii) R$ 15 milhões de EBITDA negativo com o abastece aí, devido a despesas com pessoal e tecnologia, e (iii) R$ 2 milhões de EBITDA negativo com as demais empresas. Resultado financeiro – A Ultrapar apresentou despesa financeira líquida de R$ 328 milhões no 3T22, melhora de R$ 6 milhões quando comparado ao 3T21, reflexo do resultado negativo de R$ 40 milhões de marcação a mercado dos hedges neste 3T22 comparado ao resultado negativo de R$ 146 milhões no 3T21, atenuado (i) pelo efeito no 3T21 da apropriação de juros sobre créditos tributários extraordinários referentes à exclusão do ICMS da base de cálculo do PIS/Cofins no valor de R$ 60 milhões; e (ii) pelo maior CDI, apesar do menor saldo médio e menor custo da dívida líquida. Em relação ao 2T22, período cuja despesa financeira líquida foi de R$ 510 milhões, a diferença é explicada principalmente pelo menor efeito negativo de marcação a mercado dos hedges dos bonds. Lucro líquido – Total de R$ 83 milhões (-78% vs 3T21), explicado pelo efeito no 3T21 da reversão de IR sobre a correção SELIC de créditos tributários de R$ 196 milhões e por ajustes de fechamento dos desinvestimentos da Oxiteno e da Extrafarma no 3T22, atenuados pelo maior EBITDA das operações continuadas. Em relação ao 2T22, o lucro líquido apresentou redução de 82%, decorrente principalmente do ganho de capital com a venda da Oxiteno registrado no 2T22 e do menor EBITDA da Ipiranga no 3T22. Fluxo de caixa gerado pelas atividades operacionais – Geração de R$ 1,3 bilhão no 3T22, comparada a uma geração de R$ 604 milhões no 3T21, devido à liberação de caixa em capital de giro, em função das reduções de preços de combustíveis ao longo do 3T22 e da gestão de estoque, apesar do menor EBITDA. Valores em R$ milhões 3T22 3T21 2T22 Δ Δ 9M22 9M21 Δ 3T22 v 3T21 3T22 v 2T22 9M22 v 9M21 Receita líquida 39.484 31.911 37.425 24% 6% 110.945 84.387 31% EBITDA Ajustado 838 1.017 1.494 (18%) (44%) 3.646 2.517 45% EBITDA Ajustado recorrente¹ 893 962 1.119 (7%) (20%) 3.237 2.722 19% EBITDA Ajustado recorrente - Op. continuadas 890 595 1.103 50% (19%) 2.866 1.827 57% EBITDA Ajustado recorrente - Op. descontinuadas 3 366 16 (99%) (83%) 371 895 (59%) Depreciação e amortização² 401 417 405 (4%) (1%) 1.258 1.214 4% Resultado financeiro³ (328) (334) (510) 2% 36% (1.244) (761) (63%) Lucro líquido 83 374 460 (78%) (82%) 1.004 493 103% Investimentos4 525 491 412 7% 28% 1.319 1.183 12% Fluxo de caixa das operações 1.293 604 376 114% 243% 486 1.882 (74%)
  • 4. 4 3° TRIMESTRE DE 2022 4 Ultragaz Desempenho operacional – O volume vendido da Ultragaz no 3T22 apresentou queda de 1% em relação ao 3T21, fruto da redução de 3% nas vendas do segmento envasado, em função da menor demanda do mercado. Já o segmento granel apresentou crescimento de 5%, devido principalmente a maiores vendas de gases especiais e para comércios e serviços. Em relação ao 2T22, o volume vendido foi 6% maior, reflexo da sazonalidade típica entre os períodos. Receita líquida – Total de R$ 3.068 milhões (+14% vs 3T21), em função dos repasses dos aumentos de custo de GLP, atenuados pelo menor volume de vendas. Em relação ao 2T22, houve aumento de 4%, fruto principalmente do maior volume de vendas. Custo dos produtos vendidos – Total de R$ 2.605 milhões (+11% vs 3T21), devido aos reajustes de custo de GLP pela Petrobras e a maiores gastos com fretes e logística, em função do maior preço do diesel, e pessoal (dissídio). Em relação ao 2T22, o custo dos produtos vendidos apresentou aumento de 2%, fruto principalmente do maior volume de vendas e de maiores gastos com fretes e pessoal. Despesas gerais, administrativas e de vendas – Total de R$ 209 milhões (+20% vs 3T21), reflexo das maiores despesas com pessoal (principalmente maior remuneração variável, alinhada à progressão de resultados, e dissídio) e maior comissionamento de vendas. Em relação ao 2T22, as despesas gerais, administrativas e de vendas aumentaram 1%, devido a maiores despesas com pessoal e comissionamento de vendas, atenuadas por menores provisões para créditos de liquidação duvidosa. EBITDA Ajustado – A Ultragaz alcançou patamar recorde de EBITDA de R$ 332 milhões (+51% vs 3T21), decorrente de melhores margens, fruto de iniciativas de aumento de eficiência e produtividade e de melhor mix de vendas, apesar de maiores despesas. Em relação ao 2T22, o crescimento foi de 27%, em função do maior volume de vendas e de melhores margens. Investimentos – Foram investidos R$ 90 milhões neste trimestre, direcionados principalmente à aquisição e reposição de vasilhames, às instalações em clientes no segmento granel e à manutenção das operações existentes. 3T22 3T21 2T22 Δ Δ 9M22 9M21 Δ 3T22 v 3T21 3T22 v 2T22 9M22 v 9M21 Volume total (mil tons) 451 453 425 (1%) 6% 1.275 1.298 (2%) Envasado 294 304 281 (3%) 5% 839 876 (4%) Granel 157 149 144 5% 9% 436 421 3% EBITDA Ajustado (R$ milhões) 332 220 261 51% 27% 807 507 59% Margem EBITDA Ajustado (R$/ton) 738 486 614 52% 20% 633 391 62%
  • 5. 5 3° TRIMESTRE DE 2022 5 Ultracargo 1 Média mensal Desempenho operacional – A capacidade estática média da Ultracargo aumentou 9% em relação ao 3T21, fruto do início das operações do terminal em Vila do Conde e da expansão de capacidade em Itaqui. O m³ faturado apresentou crescimento de 12%, com maior movimentação de combustíveis em Itaqui e início das operações em Vila do Conde. Em relação ao 2T22, o m³ faturado aumentou 1%, devido à maior movimentação de combustíveis em Itaqui e ao ramp up das operações em Vila do Conde, atenuados pela menor movimentação em Santos. Receita líquida – Total de R$ 225 milhões (+26% vs 3T21), em função de reajustes contratuais e do maior m³ faturado advindo principalmente de Itaqui e Vila do Conde. Em comparação ao 2T22, a receita líquida aumentou 4%, pelos mesmos motivos citados anteriormente. Custo dos serviços prestados – Total de R$ 81 milhões (+17% vs 3T21), com cerca de 80% do incremento referente a custos e depreciação do terminal de Vila do Conde (início das operações em dezembro de 2021), e o restante decorrente do aumento da depreciação, fruto das expansões de capacidade em Itaqui e dos investimentos realizados nos últimos 12 meses, além do efeito inflacionário sobre pessoal e insumos. Em relação ao 2T22, o custo dos serviços prestados apresentou redução de 8%, em função da menor depreciação e de menores gastos com pessoal e insumos. Despesas gerais, administrativas e de vendas – Total de R$ 39 milhões (+20% vs 3T21), fruto de maiores despesas com pessoal (principalmente maior remuneração variável, em linha com a progressão de resultados, e dissídio) e estudos de engenharia, atenuados por ganhos de produtividade e eficiência. Em relação ao 2T22, as despesas gerais, administrativas e de vendas aumentaram 13%, decorrente de maiores despesas com pessoal e estudos de engenharia. EBITDA Ajustado – A Ultracargo alcançou patamar recorde de EBITDA de R$ 136 milhões (+34% vs 3T21), em função das expansões de capacidade com ganhos de rentabilidade, de reajustes contratuais e de ganhos de produtividade e eficiência. Em relação ao 2T22, o crescimento foi de 5%, devido principalmente a reajustes contratuais e menores custos, atenuados por maiores despesas. Investimentos – Os investimentos no período foram de R$ 72 milhões, direcionados a projetos para ganho de eficiência, manutenção e segurança operacional dos terminais. 3T22 3T21 2T22 Δ Δ 9M22 9M21 Δ 3T22 v 3T21 3T22 v 2T22 9M22 v 9M21 Capacidade estática¹ (mil m³) 955 878 955 9% 0% 955 860 11% m³ faturado (mil m³) 3.445 3.089 3.411 12% 1% 10.076 9.381 7% EBITDA Ajustado (R$ milhões) 136 102 130 34% 5% 380 295 29% Margem EBITDA Ajustado (%) 61% 57% 60% 3 p.p. 1 p.p. 59% 56% 3 p.p.
  • 6. 6 3° TRIMESTRE DE 2022 6 Ipiranga ¹ Óleos combustíveis, arla 32, querosene, lubrificantes e graxas Desempenho operacional – O volume vendido da Ipiranga apresentou crescimento de 3% em relação ao 3T21, com aumento de 4% no diesel e 2% no ciclo Otto. Em comparação ao 2T22, o volume foi 7% maior, em função do crescimento de 8% no ciclo Otto e 6% no diesel, fruto principalmente da sazonalidade típica entre os períodos. Receita líquida – Total de R$ 35.999 milhões (+35% vs 3T21), devido aos repasses dos aumentos de custo dos produtos derivados de petróleo e etanol, e do maior volume de vendas. Em relação ao 2T22, a receita líquida cresceu 7%, fruto do maior volume de vendas, apesar das reduções de preços dos combustíveis ao longo do 3T22. Custo dos produtos vendidos – Total de R$ 35.004 milhões (+35% vs 3T21), em função dos maiores custos dos produtos derivados de petróleo e do etanol, devido ao crescimento dos preços internacionais nos últimos 12 meses, além do maior volume de vendas. Em relação ao 2T22, houve aumento de 8%, fruto principalmente do maior volume de vendas, atenuado pelas reduções de preços dos combustíveis ao longo do 3T22. Despesas gerais, administrativas e de vendas – Total de R$ 590 milhões (+8% vs 3T21), devido a maiores despesas com fretes (aumento do preço do diesel e maior volume de vendas), pessoal (principalmente maior remuneração variável, alinhada à progressão de resultados e dissídio), e operação própria da AmPm, parcialmente compensadas por maiores reversões de créditos de liquidação duvidosa. Em relação ao 2T22, as despesas gerais, administrativas e de vendas apresentaram redução de 9%, em função de maiores reversões de créditos de liquidação duvidosa e menores contingências. Outros resultados operacionais – Total de R$ 176 milhões negativos, piora de R$ 181 milhões em relação ao 3T21, fruto de gastos com CBios no valor de R$ 191 milhões no 3T22 (R$ 144 milhões superior ao do 3T21) e da constituição de R$ 38 milhões de créditos fiscais extemporâneos no 3T21. Em relação ao 2T22, a piora foi de R$ 46 milhões, reflexo da constituição de R$ 33 milhões de créditos fiscais extemporâneos no 2T22 e de maiores gastos com CBios. Resultado na venda de bens – Total de R$ 49 milhões, aumento de R$ 31 milhões em relação ao 3T21, decorrente principalmente da maior venda de terrenos. Em relação ao 2T22, a redução foi de R$ 4 milhões. Equivalência patrimonial – Total de R$ 12 milhões negativos, principalmente em função de lançamentos retroativos de IFRS 16 nas SPEs constituídas em conjunto com outras distribuidoras para operação nos portos de Vitória, Belém e Cabedelo. EBITDA Ajustado recorrente – Total de R$ 483 milhões (+41% vs 3T21), fruto de melhores margens e do maior volume de vendas, atenuados por maiores despesas e maiores gastos com CBios. Em relação ao 2T22, houve diminuição de 36%, devido a margens mais pressionadas, decorrentes das reduções de preços de combustíveis ao longo do 3T22 e da maior oferta de produtos no mercado, apesar do maior volume de vendas e das menores despesas. Investimentos – Foram investidos R$ 352 milhões, direcionados à ampliação e manutenção das redes de postos e franquias e à infraestrutura logística da Ipiranga. Do total investido, R$ 144 milhões referem-se a imobilizações e adições ao intangível, R$ 201 milhões a ativos de contratos com clientes (direitos de exclusividade) e R$ 7 milhões a liberações de financiamento a clientes e antecipação de aluguel, líquidos de recebimento. 3T22 3T21 2T22 Δ Δ 9M22 9M21 Δ 3T22 v 3T21 3T22 v 2T22 9M22 v 9M21 Volume total (mil m³) 6.020 5.855 5.629 3% 7% 17.024 16.807 1% Diesel 3.243 3.121 3.047 4% 6% 9.094 8.896 2% Ciclo Otto 2.675 2.623 2.472 2% 8% 7.610 7.577 0% Outros¹ 103 110 111 (7%) (8%) 321 334 (4%) EBITDA Ajustado (R$ milhões) 533 398 840 34% (37%) 1.992 1.383 44% Margem EBITDA Ajustado (R$/m³) 88 68 149 30% (41%) 117 82 42% Resultado na venda de bens 49 18 53 175% (7%) 128 55 131% Créditos tributários extemporâneos - 38 33 n/a n/a 33 135 (76%) EBITDA Ajustado recorrente (R$ milhões) 483 342 754 41% (36%) 1.831 1.193 54% Margem EBITDA Ajustado recorrente (R$/m³) 80 58 134 37% (40%) 108 71 52%
  • 7. 7 3° TRIMESTRE DE 2022 7 Endividamento (R$ milhões) Ultrapar consolidado 3T22 3T21 2T22 Dívida bruta (12.236) (16.409) (13.107) Caixa e aplicações financeiras 6.318 6.588 6.739 Dívida líquida (ex-IFRS 16) (5.917) (9.821) (6.368) Arrendamentos a pagar (1.529) (1.816) (1.804) Dívida líquida (7.446) (11.636) (8.172) Dívida líquida/EBITDA Ajustado LTM¹ 1,9x 3,0x 2,2x Custo médio da dívida 106% DI 105% DI 96% DI DI + 0,7% DI + 0,2% DI - 0,5% Rendimento médio do caixa (% DI) 96% 61% 79% Prazo médio de amortização da dívida (anos) 4,3 4,9 4,2 ¹ EBITDA Ajustado LTM não inclui impairments da Extrafarma, ganho de capital e ajustes de fechamento com as vendas da ConectCar, Oxiteno e Extrafarma; além disso, para o 2T22, não inclui o resultado LTM da Oxiteno e, para o 3T22, não inclui o resultado LTM da Oxiteno e da Extrafarma A Ultrapar encerrou o 3T22 com dívida financeira líquida de R$ 5,9 bilhões, composta de endividamento bruto de R$ 12,2 bilhões e posição de caixa de R$ 6,3 bilhões. Considerando os arrendamentos a pagar (IFRS 16) de R$ 1,5 bilhão, a dívida líquida total foi de R$ 7,4 bilhões (1,9x EBITDA Ajustado LTM), em comparação a R$ 8,2 bilhões em 30 de junho de 2022 (2,2x EBITDA Ajustado LTM). A redução do endividamento líquido em comparação à posição ao final do 2T22 se deve principalmente ao fechamento da venda da Extrafarma em agosto de 2022 (pagamento inicial e saída dos respectivos arrendamentos a pagar) e à liberação de caixa em capital de giro, decorrente das reduções de preços dos combustíveis ao longo do 3T22 e da gestão de estoque. Esses efeitos foram atenuados pelo pagamento de juros sobre capital próprio em agosto de 2022. A redução da alavancagem financeira é reflexo da redução da dívida líquida e do crescimento de EBITDA das operações continuadas. Cabe destacar que existem recebíveis ainda não incluídos no endividamento líquido da Ultrapar relacionados às vendas (i) da Oxiteno (US$ 150 milhões a serem recebidos em abril de 2024) e (ii) da Extrafarma (R$ 365 milhões, corrigidos por CDI + 0,5% a.a., a serem recebidos em duas parcelas, a primeira em agosto de 2023 e a segunda em agosto de 2024). Perfil de amortização e composição por moeda: 6.318 3.463 1.096 347 276 2.344 4.710 Caixa e aplicações financeiras Até 1 ano 1 a 2 anos 2 a 3 anos 3 a 4 anos 4 a 5 anos Após 5 anos 41% 55% 3% 0,1% 99,9% Moeda nacional Moeda estrangeira Com hedge Sem hedge Resultado de instrumentos de proteção cambial e de juros
  • 8. 8 3° TRIMESTRE DE 2022 8 Atualizações sobre temas ESG Em setembro, a Ultrapar participou da Rio Oil & Gas 2022, evento organizado pelo Instituto Brasileiro de Petróleo e Gás (IBP), que reuniu as principais empresas do setor para discutir diversos temas, incluindo transição energética e ESG. A Ipiranga e a Ultracargo foram patrocinadoras do evento, e lideranças da Holding, Ipiranga, Ultragaz e Ultracargo participaram de painéis de discussão e de eventos paralelos, como o Arena ESG e Young Summit. Além disso, ao longo do trimestre, a Ultrapar realizou encontros imersivos de seu Programa de Aceleração Social, que contou com a participação de mais de 100 voluntários e apoio a 13 ONGs em seus desafios de gestão, maximizando seu impacto social. Ao todo, foram propostas mais de 400 soluções que poderão impactar positivamente mais de 9 mil pessoas atendidas pelas instituições. A Ultrapar firmou parceria, em julho, com o Instituto Amazônia+21, organização criada pela CNI (Confederação Nacional da Indústria), que busca promover negócios sustentáveis e inovadores na Amazônia, além de contribuir para o desenvolvimento econômico sustentável da região. Em julho, a Ultragaz doou cestas básicas, kits de higiene, fraldas e água para 1,8 mil famílias em situação de vulnerabilidade, vítimas das fortes chuvas em Jaboatão dos Guararapes (PE). Em agosto, a Ultragaz iniciou o projeto Teatro em Ação, que apresentará a peça “Missão Natureza” em 15 cidades e 11 Estados brasileiros, promovendo a conscientização de crianças sobre a importância de reduzir a geração de resíduos. Além disso, a Ultragaz aderiu ao programa Compromisso com o Clima, promovido pelo Instituto Ekos em parceria com outras empresas, que tem como objetivo incentivar a economia de baixo carbono e facilitar a seleção e apoio a projetos socioambientais para a compensação das emissões de GEEs. A Ultracargo iniciou, em setembro, mais uma edição do curso Formação de Operadores Portuários, disponibilizando 25 vagas para moradores do entorno do Terminal de Aratu (BA). O programa é ofertado gratuitamente e busca contribuir com o desenvolvimento profissional dos moradores e atrair talentos para as operações, fomentando a diversidade. Durante o 3T22, foram abertas as inscrições para o Prêmio Comunidade em Ação, promovido pelo Grupo Tribuna (Santos-SP) com patrocínio da Ultracargo. A iniciativa, que está em sua 20ª edição, valoriza ações voluntárias de grupos, instituições ou indivíduos em benefício de causas sociais na região. Em julho, a Ipiranga lançou a 15ª edição do Programa Saúde na Estrada, que oferece atendimento e serviços médicos gratuitos aos motoristas, caminhoneiros e comunidades próximos aos postos de rodovia Ipiranga, com expectativa de atender 70 cidades de 15 Estados até o final do ano. Além disso, lançou o Programa Construa, ação afirmativa para a contratação e desenvolvimento de pessoas com necessidades especiais na área comercial. Em setembro, a Ipiranga concluiu o Projeto Ajudôu, projeto social relacionado à lei de incentivo ao esporte, 100% financiado pela companhia, que promoveu a inclusão de 320 crianças e jovens em situação de vulnerabilidade social em Minas Gerais através da prática de judô.
  • 9. 9 3° TRIMESTRE DE 2022 9 Fonte: Broadcast Mercado de capitais O volume financeiro médio negociado da Ultrapar, considerando as negociações ocorridas na B3 e na NYSE, foi de R$ 89 milhões/dia no 3T22 (-42% vs 3T21). As ações da Ultrapar encerraram o 3T22 cotadas a R$ 11,73 na B3, queda de 5% no trimestre, enquanto o índice Ibovespa apreciou 12%. Na NYSE, as ações da Ultrapar e o índice Dow Jones depreciaram 7% no trimestre. A Ultrapar encerrou o 3T22 com valor de mercado de R$ 13 bilhões. Mercado de capitais 3T22 3T21 2T22 9M22 9M21 Quantidade final de ações (mil) 1.115.173 1.115.108 1.115.152 1.115.173 1.115.108 Valor de mercado¹ (R$ milhões) 13.081 16.437 13.728 13.081 16.437 B3 Volume médio/dia (mil ações) 5.741 8.210 7.891 6.748 6.934 Volume financeiro médio/dia (R$ mil) 74.580 133.350 105.168 90.850 131.489 Cotação média (R$/ação) 12,99 16,24 13,33 13,46 18,96 NYSE Quantidade de ADRs² (mil ADRs) 54.163 50.374 50.438 54.163 50.374 Volume médio/dia (mil ADRs) 1.122 1.205 1.480 1.298 1.669 Volume financeiro médio/dia (US$ mil) 2.771 3.744 3.938 3.405 6.118 Cotação média (US$/ADRs) 2,47 3,11 2,66 2,62 3,67 Total Volume médio/dia (mil ações) 6.863 9.415 9.371 8.046 8.602 Volume financeiro médio/dia (R$ mil) 89.150 152.939 124.690 108.284 164.371 ¹ Calculado a partir do preço de fechamento da ação no período ² 1 ADR = 1 ação ordinária Evolução UGPA3 x Ibovespa – 3T22 (Base 100)
  • 10. 10 3° TRIMESTRE DE 2022 10 Teleconferência 3T22 A Ultrapar realizará a teleconferência com analistas e investidores no dia 10 de novembro de 2022 para comentários sobre o desempenho da Companhia no terceiro trimestre de 2022 e perspectivas. A apresentação estará disponível para download no website da Companhia 30 minutos antes de seu início. A teleconferência será transmitida via webcast e realizada em português com tradução simultânea para inglês. O link de acesso estará disponível no site ri.ultra.com.br. Favor conectar-se com 10 minutos de antecedência. Teleconferência em português com tradução simultânea para inglês Horário: 11h00 (BRT) / 09h00 (EST) Participantes do Brasil: +55 (11) 3181-8565 ou +55 (11) 4090-1621 Código: Ultrapar – em português Replay: +55 (11) 3193-1012 (disponível por sete dias) Código: 3167603# Participantes Internacionais: +1 (844) 204-8942 ou +1 (412) 717-9627 Código: Ultrapar – em inglês Replay: +55 (11) 3193-1012 (disponível por sete dias) Código: 9792937#
  • 11. 11 3° TRIMESTRE DE 2022 11 Em milhões de Reais SET 22¹ SET 21 JUN 22 Operações continuadas² Operações descontinuadas² ATIVO Caixa e equivalentes de caixa 4.626,7 2.826,3 4.745,1 4.707,3 37,8 Aplicações financeiras e instrumentos financeiros derivativos de proteção 1.264,0 2.914,9 1.372,8 1.372,8 (0,0) Contas a receber de clientes e financiamentos a clientes 4.557,2 4.624,4 4.547,1 4.423,9 123,2 Contas a receber - venda de controladas 186,1 - - - - Estoques 4.333,7 5.574,2 6.573,3 6.010,5 562,8 Tributos a recuperar 1.358,7 1.540,7 1.488,9 1.422,1 66,8 Despesas antecipadas 123,8 141,2 152,3 143,1 9,1 Ativos de contratos com clientes - direitos de exclusividade 599,6 533,7 579,4 579,4 - Outros 88,1 106,4 119,1 101,5 17,6 Total Ativo Circulante 17.137,8 18.261,8 19.578,0 18.760,6 817,3 Aplicações financeiras e instrumentos financeiros derivativos de proteção 427,6 847,3 621,3 621,3 - Contas a receber de clientes e financiamentos a clientes 549,3 481,4 513,9 513,9 - Contas a receber - venda de controladas 928,0 - 707,6 707,6 - Imposto de renda e contribuição social diferidos 1.021,4 1.245,5 1.016,6 812,1 204,5 Tributos a recuperar 1.622,6 1.815,2 1.352,2 1.330,6 21,7 Depósitos judiciais 880,1 868,4 875,1 871,4 3,7 Despesas antecipadas 79,8 84,3 64,9 64,9 0,0 Ativos de contratos com clientes - direitos de exclusividade 1.691,6 1.385,2 1.646,2 1.646,2 - Outros 155,1 175,1 154,3 154,3 - Investimentos 119,1 172,4 117,2 117,2 - Ativos de direito de uso 1.804,7 2.093,0 2.049,9 1.723,2 326,8 Imobilizado 5.775,2 8.235,0 5.768,7 5.624,6 144,1 Intangível 1.875,0 1.707,7 1.828,4 1.751,1 77,3 Total Ativo Não Circulante 16.929,3 19.110,5 16.716,2 15.938,1 778,1 TOTAL ATIVO 34.067,2 37.372,3 36.294,2 34.698,8 1.595,4 PASSIVO Empréstimos, financiamentos e instrumentos financeiros derivativos de proteção 889,5 945,6 324,3 324,3 - Debêntures 2.573,5 1.475,4 3.382,8 3.382,8 - Fornecedores 6.097,8 6.364,1 6.889,7 6.680,8 208,9 Salários e encargos sociais 416,2 549,0 376,3 321,4 54,8 Impostos a pagar 316,1 396,5 534,2 515,7 18,5 Arrendamentos a pagar 218,4 269,5 278,8 206,6 72,2 Outros 683,7 345,1 889,2 886,4 2,8 Total Passivo Circulante 11.195,2 10.345,2 12.675,3 12.318,1 357,3 Empréstimos, financiamentos e instrumentos financeiros derivativos de proteção 4.572,6 8.458,9 5.178,4 5.178,4 0,0 Debêntures 4.200,2 5.529,2 4.221,4 4.221,4 - Provisões para riscos tributários, cíveis e trabalhistas 1.011,5 797,2 989,7 987,7 2,0 Benefícios pós-emprego 199,8 262,8 197,3 197,0 0,3 Arrendamentos a pagar 1.310,6 1.546,3 1.525,1 1.215,3 309,8 Outros 206,0 247,8 214,7 212,4 2,2 Total Passivo Não Circulante 11.500,6 16.842,1 12.326,5 12.012,2 314,3 TOTAL PASSIVO 22.695,8 27.187,4 25.001,8 24.330,2 671,6 PATRIMÔNIO LÍQUIDO Capital social 5.171,8 5.171,8 5.171,8 5.171,8 - Reservas 5.467,4 5.008,3 5.467,6 5.467,6 - Ações em tesouraria (489,0) (489,1) (488,4) (488,4) - Outros 761,3 104,9 690,3 690,3 - Participação dos não-controladores 460,0 389,1 451,2 451,2 - Total Patrimônio Líquido 11.371,4 10.185,0 11.292,4 11.292,4 - TOTAL PASSIVO E PATRIMÔNIO LÍQUIDO 34.067,2 37.372,3 36.294,2 35.622,6 671,6 Caixa e aplicações financeiras 6.318,3 6.588,4 6.739,2 n/a n/a Empréstimos e debêntures (12.235,8) (16.409,1) (13.106,8) n/a n/a Arrendamentos a pagar (1.528,9) (1.815,8) (1.803,9) n/a n/a Caixa (endividamento) líquido (7.446,4) (11.636,4) (8.171,5) n/a n/a Caixa (endividamento) líquido ex-IFRS 16 (5.917,5) (9.820,7) (6.367,6) n/a n/a ¹ Balanço do 3T22 corresponde somente às operações continuadas ² Dada a gestão financeira unificada na Holding, a v isão indiv idual de balanço das operações continuadas e descontinuadas não reflete a realidade das companhias (ativ o e passiv o diferem) ULTRAPAR BALANÇO PATRIMONIAL CONSOLIDADO
  • 12. 12 3° TRIMESTRE DE 2022 12 Em milhões de Reais 3T22¹ Operações continuadas Operações descontinuadas¹ 3T21 Operações continuadas Operações descontinuadas 2T22 Operações continuadas Operações descontinuadas 9M22 9M21 Receita líquida de vendas e serviços 39.483,8 39.294,7 189,0 31.911,1 29.452,5 2.458,7 37.425,1 36.879,4 545,8 110.944,9 84.387,5 Custos dos produtos vendidos e dos serviços prestados (37.900,5) (37.708,7) (191,8) (30.112,2) (28.270,2) (1.842,0) (35.401,7) (35.027,5) (374,1) (105.254,8) (79.376,8) Lucro bruto 1.583,3 1.586,1 (2,8) 1.798,9 1.182,3 616,7 2.023,5 1.851,9 171,6 5.690,1 5.010,6 Receitas (despesas) operacionais Com vendas e comerciais (563,0) (508,8) (54,2) (781,5) (504,8) (276,7) (699,0) (546,6) (152,4) (2.017,3) (2.140,2) Gerais e administrativas (409,7) (388,6) (21,1) (497,7) (344,0) (153,8) (448,8) (408,2) (40,6) (1.315,9) (1.439,6) Outros resultados operacionais, líquidos (174,9) (174,9) (0,0) 35,6 10,9 24,7 (137,7) (136,9) (0,8) (405,9) 101,5 Resultado na venda de bens 13,3 49,2 (35,9) 18,0 17,5 0,6 343,5 55,6 287,9 379,4 58,2 Redução ao valor recuperável de ativos (impairment ) - - - - - - - - - - (394,7) Lucro (prejuízo) operacional 449,0 562,9 (114,0) 573,4 361,9 211,5 1.081,5 815,8 265,8 2.330,3 1.195,8 Resultado financeiro Receitas financeiras 176,6 176,4 0,2 127,0 114,7 12,3 210,2 209,7 0,5 498,5 339,1 Despesas financeiras (504,8) (501,1) (3,6) (423,0) (368,4) (54,5) (719,7) (708,3) (11,4) (1.694,2) (971,6) Equivalência patrimonial (11,1) (11,1) - (11,1) (11,3) 0,2 7,7 7,7 - 9,9 (22,0) Lucro antes do imposto de renda e contribuição social 109,7 227,0 (117,4) 266,3 96,8 169,5 579,7 324,8 254,8 1.144,5 541,3 Imposto de renda e contribuição social Corrente (126,3) (271,0) 144,7 (20,2) (44,8) 24,6 (357,1) (100,9) (256,2) (773,6) (383,9) Diferido 78,7 203,8 (125,1) 95,9 91,6 4,3 208,2 157,4 50,8 474,6 269,8 Incentivos fiscais 20,4 20,4 - 32,3 17,9 14,4 15,7 15,7 - 79,7 66,3 Efeito líquido da cessação de depreciação² - - - - - - 13,5 - 13,5 78,5 - Lucro (prejuízo) líquido 82,6 180,3 (97,7) 374,3 161,5 212,8 459,9 397,0 62,9 1.003,7 493,4 Lucro atribuível a: Acionistas da Ultrapar 73,1 170,8 (97,7) 369,2 156,4 212,8 452,9 390,0 62,9 978,2 470,3 Acionistas não controladores de controladas 9,5 9,5 - 5,1 5,1 - 7,1 7,1 - 25,5 23,2 EBITDA Ajustado 838,4 939,3 (100,9) 1.017,3 651,0 366,3 1.494,4 1.189,0 305,4 3.645,8 2.517,1 Itens não recorrentes Resultado na venda de bens (Ipiranga) (49,3) (49,3) - (17,9) (17,9) - (53,0) (53,0) - (128,2) (55,4) Créditos tributários extemporâneos (Ipiranga) - - - (37,9) (37,9) - (32,7) (32,7) - (32,7) (134,8) Créditos tributários extemporâneos (Oxiteno) - - - - - - - - - (62,4) - Ganho de capital com a venda da Oxiteno - - - - - - (289,2) - (289,2) (289,2) - Ajustes da venda da Oxiteno 31,6 - 31,6 - - - - - - 31,6 - Impairment (Extrafarma) - - - - - - - - - - 394,7 Provisões de despesas pré-fechamento (Extrafarma) 67,4 - 67,4 - - - - - - 67,4 - Ajustes da venda da Extrafarma 4,7 - 4,7 - - - - - - 4,7 - EBITDA Ajustado recorrente 892,8 890,0 2,8 961,5 595,2 366,3 1.119,5 1.103,3 16,1 3.236,9 2.721,5 Depreciação e amortização³ 400,6 387,5 13,1 417,0 300,4 116,6 405,2 365,6 39,6 1.257,6 1.214,3 Cash flow hedge dos bonds - - - 38,0 - 38,0 - - - 48,1 129,0 Investimentos totais4 525,2 523,6 1,7 491,4 427,1 64,3 411,6 406,8 4,7 1.319,3 1.182,8 Índices Lucro por ação (R$) 0,07 0,16 (0,09) 0,34 0,14 0,20 0,42 0,36 0,06 0,90 0,43 Dívida líquida / EBITDA Ajustado LTM5 1,9x n/a n/a 3,0x n/a n/a 2,2x n/a n/a 1,9x 3,0x Margem bruta (%) 4,0% 4,0% (1,5%) 5,6% 4,0% 25,1% 5,4% 5,0% 31,4% 5,1% 5,9% Margem operacional (%) 1,1% 1,4% (60,3%) 1,8% 1,2% 8,6% 2,9% 2,2% 48,7% 2,1% 1,4% Margem EBITDA Ajustado (%) 2,1% 2,4% (53,4%) 3,2% 2,2% 14,9% 4,0% 3,2% 56,0% 3,3% 3,0% Margem EBITDA Ajustado recorrente (%) 2,3% 2,3% 1,5% 3,0% 2,0% 14,9% 3,0% 3,0% 3,0% 2,9% 3,2% - Número de funcionários 9.644 9.644 - 16.218 8.507 7.711 14.958 9.350 5.608 9.644 16.218 ¹ Considera somente o resultado de julho da Extrafarma, em v irtude da conclusão da sua v enda em 01 de agosto de 2022 ² A partir de 01/01/2022 foi cessada a depreciação e amortização das operações descontinuadas, após reclassificação para o ativ o circulante, na linha de ativ os classificados como mantidos para v enda, conforme item 25 do CPC 31 / IFRS 5 ³ Inclui amortização de ativ os de contratos com clientes – direitos de exclusiv idade 5 EBITDA Ajustado LTM não inclui impairments da Extrafarma, ganho de capital e ajustes de fechamento com as v endas da ConectCar, Oxiteno e Extrafarma; além disso, para o 2T22, não inclui o resultado LTM da Oxiteno e, para o 3T22, não inclui o resultado LTM da Oxiteno e da Extrafarma DEMONSTRAÇÃO DO RESULTADO ULTRAPAR 4 Inclui imobilizações e adições ao intangív el (líquidas de desinv estimentos), ativ os de contratos com clientes (direito de exclusiv idade), custos diretos iniciais de ativ os de direito de uso, aportes realizados nas SPEs (Sociedade de Propósito Específico), pagamentos de outorga, liberações de financiamentos a clientes, antecipações de aluguel (líquidos de repagamentos) e aquisições de participações acionárias
  • 13. 13 3° TRIMESTRE DE 2022 13 JAN - SET 2022 JAN - SET 2021 Reapresentado Fluxos de caixa das atividades operacionais continuadas Lucro líquido do período - operações continuadas 694,2 476,9 Ajustes para reconciliar o lucro líquido ao caixa gerado pelas atividades operacionais Equivalência patrimonial (10,1) 22,2 Amortização de ativos de contratos com clientes - direitos de exclusividade e direito de uso 543,8 392,5 Depreciações e amortizações 550,4 488,8 Juros, variações monetárias e cambiais 1.208,4 861,8 Imposto de renda e contribuição social correntes e diferidos (2,2) 117,2 Resultado na venda de bens (129,8) (57,9) Instrumento patrimonial outorgado 16,8 6,9 Provisão de descarbonização - CBios 497,1 111,2 Demais provisões e outros 12,2 (79,5) 3.380,7 2.340,1 (Aumento) diminuição nos ativos Contas a receber e financiamentos a clientes (637,7) (621,6) Estoques (420,3) (1.329,1) Tributos a recuperar (736,2) (571,9) Dividendos recebidos de controladas e empreendimentos controlados em conjunto e coligadas 0,1 0,1 Outros ativos (176,1) (11,3) Aumento (diminuição) nos passivos Fornecedores e fornecedores convênio 270,8 1.680,1 Salários e encargos sociais 86,1 59,6 Obrigações tributárias (41,7) (12,2) Outros passivos 67,9 (79,9) Aquisição de CBios (542,5) (121,9) Pagamentos de ativos de contratos com clientes - direitos de exclusividade (512,3) (222,6) Imposto de renda e contribuição social pagos (283,3) (164,8) 455,6 944,5 30,6 937,9 Caixa líquido gerado (consumido) pelas atividades operacionais 486,1 1.882,4 Fluxos de caixa das atividades de investimentos Aplicações financeiras, líquidas de resgates 902,1 2.151,6 Aquisição de imobilizado e intangível (851,0) (844,6) Recebimento do empréstimo intercompany devido pela Oxiteno S.A à Ultrapar International 3.980,7 - Caixa gerado com a venda de investimentos e bens 2.734,4 97,1 Aporte de capital em controladas, coligadas e empreendimentos controlados em conjunto (28,0) (25,7) Transações com operações descontinuadas 987,9 - Redução de capital em coligadas - 1,5 Custos diretos iniciais de ativos de direito de uso - (14,9) Sociedades relacionadas - (21,6) 7.726,2 1.343,3 (220,2) (129,2) 7.506,0 1.214,0 Fluxos de caixa das atividades de financiamentos Financiamentos e debêntures Captação 1.019,6 1.379,0 Amortização (4.966,7) (2.426,1) Juros e derivativos pagos (961,9) (451,1) Pagamentos de arrendamentos¹ (272,9) (251,1) Dividendos pagos (634,7) (705,6) Aumento de capital realizado por acionistas não controladores e resgate de cotas 21,7 - Sociedades relacionadas (18,9) (0,2) (5.813,8) (2.455,1) (179,0) (514,8) (5.992,8) (2.969,9) (21,3) (10,7) (19,3) 48,9 (40,7) 38,2 2.346,6 164,8 (388,0) - 1.958,6 164,8 2.280,1 2.661,5 388,0 - 2.668,1 2.661,5 4.626,6 2.826,3 - - 4.626,6 2.826,3 Transações sem efeito caixa: Adições em ativos de direito de uso e arrendamentos a pagar 420,8 204,5 Adições em ativos de contratos com clientes - direitos de exclusividade 38,8 197,9 Fundo de reversão - previdência privada 3,1 3,7 Emissão de ações referente ao bônus de subscrição - indenização - aquisição Extrafarma 0,9 1,8 ¹ Inclui R$ 32 milhões e R$ 29 milhões da outorga do terminal de Vila do Conde da Ultracargo no 1T22 e 1T21, respectiv amente, R$ 16 milhões da outorga do terminal de Belém da Ipiranga no 2T22 e R$ 12 milhões da outorga da base de Vitória na Ipiranga no 3T22 Caixa líquido gerado (consumido) nas atividades de investimentos - operações descontinuadas Caixa líquido gerado (consumido) nas atividades de investimentos Caixa líquido gerado (consumido) nas atividades de investimentos - operações continuadas ULTRAPAR DEMONSTRAÇÃO DOS FLUXOS DE CAIXA Em milhões de Reais Caixa líquido gerado (consumido) pelas atividades operacionais - operações continuadas Caixa líquido gerado (consumido) pelas atividades operacionais - operações descontinuadas Caixa e equivalentes de caixa no fim do período Caixa e equivalentes de caixa no início do período Caixa líquido consumido pelas atividades de financiamentos - operações continuadas Caixa líquido consumido pelas atividades de financiamentos - operações descontinuadas Caixa líquido consumido pelas atividades de financiamentos Caixa e equivalentes de caixa no fim do período - operações continuadas Caixa e equivalentes de caixa no fim do período - operações descontinuadas Aumento (diminuição) de caixa e equivalentes de caixa Caixa e equivalentes de caixa no início do período - operações continuadas Caixa e equivalentes de caixa no início do período - operações descontinuadas Variação cambial de caixa e equivalentes de caixa em moeda estrangeira - operações continuadas Variação cambial de caixa e equivalentes de caixa em moeda estrangeira - operações descontinuadas Variação cambial de caixa e equivalentes de caixa em moeda estrangeira Aumento (diminuição) de caixa e equivalentes de caixa - operações continuadas Aumento (diminuição) de caixa e equivalentes de caixa - operações descontinuadas
  • 14. 14 3° TRIMESTRE DE 2022 14 Em milhões de Reais SET 22 SET 21 JUN 22 ATIVO OPERACIONAL Clientes 591,8 472,4 569,6 Clientes a receber LP 17,1 29,9 18,8 Estoques 196,9 177,3 199,2 Impostos 103,8 86,0 100,8 Depósitos judiciais 200,6 220,0 207,6 Outros 89,6 79,1 84,5 Ativos de direito de uso 151,8 89,4 124,6 Imobilizado / Intangível 1.274,8 1.181,2 1.245,4 TOTAL ATIVO OPERACIONAL 2.626,3 2.335,2 2.550,4 PASSIVO OPERACIONAL Fornecedores 193,4 119,5 166,0 Salários e encargos 120,8 99,0 89,9 Impostos 13,9 15,8 16,5 Provisões judiciais 126,2 124,2 125,2 Arrendamentos a pagar 189,5 141,4 162,3 Outros 71,4 53,9 83,7 TOTAL PASSIVO OPERACIONAL 715,1 553,8 643,6 Em milhões de Reais 3T22 3T21 2T22 9M22 9M21 Receita líquida 3.067,5 2.679,5 2.944,2 8.651,0 7.063,0 Custo dos produtos vendidos (2.605,2) (2.352,7) (2.550,8) (7.479,0) (6.280,0) Lucro bruto 462,3 326,8 393,4 1.171,9 783,0 Despesas operacionais Vendas e comerciais (146,3) (120,8) (144,8) (414,2) (329,2) Gerais e administrativas (62,4) (53,1) (61,1) (178,2) (150,7) Outros resultados operacionais 3,6 2,9 0,3 8,2 10,3 Resultado na venda de bens (0,1) (0,4) (0,1) (0,9) 2,5 Lucro (prejuízo) operacional 257,2 155,3 187,6 586,8 315,8 Equivalência patrimonial (0,0) (0,0) 0,0 0,0 0,0 EBITDA Ajustado 332,4 220,5 261,0 806,6 507,2 Depreciação e amortização¹ 75,2 65,1 73,4 219,8 191,4 Índices Margem bruta (R$/ton) 1.026 721 925 919 603 Margem operacional (R$/ton) 571 343 441 460 243 Margem EBITDA Ajustado (R$/ton) 738 486 614 633 391 Número de funcionários 3.496 3.409 3.420 3.496 3.409 ¹ Inclui amortização de ativ os de contratos com clientes – direitos de exclusiv idade DEMONSTRAÇÃO DO RESULTADO CONSOLIDADA ULTRAGAZ CAPITAL OPERACIONAL CONSOLIDADO
  • 15. 15 3° TRIMESTRE DE 2022 15 Em milhões de Reais SET 22 SET 21 JUN 22 ATIVO OPERACIONAL Clientes 17,2 25,3 19,5 Estoques 10,4 8,7 9,7 Impostos 7,7 24,1 13,6 Outros 37,8 23,8 39,2 Ativos de direito de uso 655,6 536,8 580,1 Imobilizado / Intangível / Investimentos 1.759,5 1.659,9 1.710,5 TOTAL ATIVO OPERACIONAL 2.488,3 2.278,7 2.372,7 PASSIVO OPERACIONAL Fornecedores 61,8 44,9 48,2 Salários e encargos 46,9 44,6 37,6 Impostos 4,8 5,2 8,8 Provisões judiciais 9,7 10,1 9,5 Arrendamentos a pagar 598,4 481,4 514,4 Outros¹ 63,2 61,0 72,1 TOTAL PASSIVO OPERACIONAL 784,8 647,3 690,5 Em milhões de Reais 3T22 3T21 2T22 9M22 9M21 Receita líquida 224,5 177,8 216,8 638,8 525,7 Custo dos serviços prestados (80,9) (69,2) (87,7) (252,3) (207,8) Lucro bruto 143,6 108,7 129,1 386,4 317,9 Despesas operacionais Vendas e comerciais (2,4) (2,2) (2,8) (9,1) (6,2) Gerais e administrativas (36,8) (30,5) (31,8) (95,2) (93,9) Outros resultados operacionais (0,4) 0,8 (0,1) (1,7) 4,0 Resultado na venda de bens 0,0 (0,0) (0,1) (0,2) 0,0 Lucro (prejuízo) operacional 104,1 76,7 94,3 280,3 221,8 Equivalência patrimonial (0,5) 0,1 (0,3) (1,4) 0,7 EBITDA Ajustado 136,3 102,1 129,6 379,8 294,8 Depreciação e amortização 32,8 25,2 35,6 100,9 72,3 Índices Margem bruta (%) 64,0% 61,1% 59,6% 60,5% 60,5% Margem operacional (%) 46,4% 43,2% 43,5% 43,9% 42,2% Margem EBITDA Ajustado (%) 60,7% 57,4% 59,8% 59,5% 56,1% Número de funcionários 869 736 864 869 736 ULTRACARGO CAPITAL OPERACIONAL CONSOLIDADO ¹ Inclui saldo da conta obrigações com clientes de longo prazo DEMONSTRAÇÃO DO RESULTADO CONSOLIDADA
  • 16. 16 3° TRIMESTRE DE 2022 16 Em milhões de Reais SET 22 SET 21 JUN 22 ATIVO OPERACIONAL Clientes 3.940,6 3.119,6 3.855,9 Clientes a receber LP 532,2 451,4 495,1 Estoques 4.125,4 3.436,6 5.800,0 Impostos 2.485,7 1.820,3 2.214,2 Ativos de contratos com clientes - direitos de exclusividade 2.288,1 1.914,4 2.222,1 Outros 501,8 481,2 491,6 Ativos de direito de uso 990,3 1.043,8 1.011,6 Imobilizado / Intangível / Investimentos 4.310,4 3.669,5 4.114,7 TOTAL ATIVO OPERACIONAL 19.174,5 15.936,6 20.205,2 PASSIVO OPERACIONAL Fornecedores 5.768,5 4.773,3 6.401,7 Salários e encargos 177,3 130,9 138,2 Benefícios pós-emprego 213,0 269,0 210,5 Impostos 164,6 178,2 176,2 Provisões judiciais 287,0 212,9 305,0 Arrendamentos a pagar 733,1 730,4 737,5 Outros 654,2 370,3 483,3 TOTAL PASSIVO OPERACIONAL 7.997,8 6.665,0 8.452,4 Em milhões de Reais 3T22 3T21 2T22 9M22 9M21 Receita líquida 35.999,1 26.613,8 33.706,0 98.375,1 70.322,6 Custos dos produtos vendidos e dos serviços prestados (35.004,4) (25.891,8) (32.391,5) (95.025,8) (68.106,8) Lucro bruto 994,7 722,0 1.314,5 3.349,4 2.215,7 Despesas operacionais Vendas e comerciais (359,5) (361,2) (398,2) (1.131,7) (981,5) Gerais e administrativas (230,5) (184,9) (247,7) (657,1) (544,7) Outros resultados operacionais (176,1) 5,2 (129,9) (416,3) 59,1 Resultado na venda de bens 49,3 17,9 53,0 128,2 55,4 Lucro (prejuízo) operacional 277,9 199,0 591,7 1.272,4 804,1 Equivalência patrimonial (12,4) 0,6 0,8 (10,4) (1,3) EBITDA Ajustado 532,7 398,1 840,0 1.992,2 1.382,9 Itens não recorrentes Resultado na venda de bens (49,3) (17,9) (53,0) (128,2) (55,4) Créditos tributários extemporâneos - (37,9) (32,7) (32,7) (134,8) EBITDA Ajustado recorrente 483,4 342,3 754,3 1.831,3 1.192,6 Depreciação e amortização¹ 267,2 198,5 247,5 730,3 580,1 Índices Margem bruta (R$/m³) 165 123 234 197 132 Margem operacional (R$/m³) 46 34 105 75 48 Margem EBITDA Ajustado (R$/m³) 88 68 149 117 82 Margem EBITDA Ajustado recorrente (R$/m³) 80 58 134 108 71 Número de postos 6.940 7.088 7.010 6.940 7.088 Número de funcionários 4.587 3.778 4.363 4.587 3.778 ¹ Inclui amortização de ativ os de contratos com clientes – direitos de exclusiv idade IPIRANGA CAPITAL OPERACIONAL CONSOLIDADO DEMONSTRAÇÃO DO RESULTADO CONSOLIDADA
  • 17. 17 3° TRIMESTRE DE 2022 17 Em milhões de Reais SET 22 SET 21 JUN 22 ATIVO OPERACIONAL Clientes - 35,0 123,2 Estoques - 527,0 562,8 Impostos - 74,8 86,5 Outros - 33,3 35,1 Ativos de direito de uso - 352,8 313,2 Imobilizado / Intangível - 247,4 207,9 TOTAL ATIVO OPERACIONAL - 1.270,4 1.328,6 PASSIVO OPERACIONAL Fornecedores - 194,2 208,9 Salários e encargos - 62,4 54,8 Impostos - 14,9 18,5 Provisões judiciais - 10,2 2,5 Arrendamentos a pagar - 383,9 382,0 Outros - 19,2 10,6 TOTAL PASSIVO OPERACIONAL - 684,8 677,3 Em milhões de Reais 3T22¹ 3T21 2T22 9M22 9M21 Receita bruta 199,9 509,6 575,8 1.304,7 1.568,6 Devoluções, abatimentos e impostos faturados (10,9) (26,2) (30,0) (69,2) (81,5) Receita líquida 189,0 483,4 545,8 1.235,5 1.487,1 Custos dos produtos vendidos e dos serviços prestados (191,8) (333,7) (374,1) (912,3) (1.032,1) Lucro bruto (2,8) 149,7 171,6 323,2 455,0 Despesas operacionais (75,0) (175,3) (192,1) (436,2) (520,0) Outros resultados operacionais (0,0) 2,7 (0,8) (2,2) 0,0 Resultado na venda de bens 0,5 0,8 (1,3) (3,8) 0,2 Redução ao valor recuperável de ativos (impairment ) - - - - (394,7) Lucro (prejuízo) operacional (77,3) (22,1) (22,6) (119,0) (459,5) EBITDA Ajustado (64,2) 17,0 17,0 (26,6) (344,5) Itens não recorrentes Impairment - - - - 394,7 Provisões de despesas pré-fechamento 67,4 - - 67,4 - EBITDA Ajustado recorrente 3,1 17,0 17,0 40,7 50,2 Depreciação e amortização 13,1 39,1 39,7 92,4 115,0 Índices² Margem bruta (%) (1,4%) 29,4% 29,8% 24,8% 29,0% Margem operacional (%) (38,7%) (4,3%) (3,9%) (9,1%) (29,3%) Margem EBITDA Ajustado (%) (32,1%) 3,3% 3,0% (2,0%) (22,0%) Margem EBITDA Ajustado recorrente (%) 1,6% 3,3% 3,0% 3,1% 3,2% Número de lojas - 399 399 - 399 Número de funcionários - 5.838 5.608 - 5.838 ¹ Considera somente o resultado de julho da Extrafarma, em v irtude da conclusão da sua v enda em 01 de agosto de 2022 ² Calculado sobre a receita bruta EXTRAFARMA CAPITAL OPERACIONAL DEMONSTRAÇÃO DO RESULTADO
  • 18. Divulgação dos resultados 2T22 3Q22 Earnings Release São Paulo, November 9, 2022 – Ultrapar Participações S.A. (“Company” or “Ultrapar”, B3: UGPA3 / NYSE: UGP), a company engaged in energy and infrastructure through Ipiranga, Ultragaz and Ultracargo, today announces its results for the third quarter of 2022. Continuing operations Net revenues Recurring Adjusted EBITDA² Investments R$ 39 billion R$ 890 million R$ 524 million Pro forma view¹ Recurring Adjusted EBITDA² Net income Cash flow from operations R$ 893 million R$ 83 million R$ 1.3 billion ¹ Considers the sum of continuing and discontinued operations ² Accounting adjustments and non-recurring items described in the EBITDA calculation table – page 2 Highlights • EBTIDA growth in all of the main businesses of the Group. • Reduction of the financial leverage to 1.9x, the lowest level of the last 5 years, reflecting the sales of Oxiteno and Extrafarma this year, the EBITDA growth from continuing operations and the working capital release in 3Q22. • Review of Ultrapar’s rating perspective from negative to stable by Moody’s, reflecting the improvement of the capital structure with the reduction of net debt, and prospects of profitability recovery with the evolution of results. • Approval of additional investments in Ipiranga by the Board of Directors, in the amount of R$ 265 million for 2022, due to greater opportunities for branding new service stations. • Acquisition of Stella, a technology platform that connects renewable distributed electricity generators and customers, marking Ultragaz's entry into the electricity segment, in line with its strategy of expanding its offering of energy solutions to customers, leveraging the value generation through its capillarity, commercial strength, brand and extensive base of industrial and residential customers.
  • 19. 2 3rd QUARTER OF 2022 2 Considerations on the financial and operational information In May and August 2021, the sale agreements of Extrafarma and Oxiteno were signed, respectively, according to the Material Notices disclosed at the time. On December 31, 2021, Ultrapar classified these businesses as assets and liabilities held for sale and discontinued operations. The sale of Oxiteno was concluded on April 1st, 2022, and thus ceased to be part of discontinued operations and Ultrapar's results as of 2Q22. The sale of Extrafarma was concluded on August 1st, 2022, and its results are shown within discontinued operations until this date. In this report the financial information related to Ultrapar corresponds to the consolidated information (pro forma) of the Company, that is, the data considers the sum of continuing and discontinued operations unless otherwise indicated. The financial information presented on this document were extracted from the individual and consolidated interim financial information ("Quarterly Information") for the three months period ended on September 30, 2022, and prepared in accordance with the pronouncement CPC 21 (R1) - Interim Financial Reporting and the International Accounting Standard IAS 34 - Interim Financial Reporting issued by the International Accounting Standards Board ("IASB"), and presented in accordance with the applicable rules for Quarterly Information, issued by the Brazilian Securities and Exchange Commission (“CVM”). The information on Ultragaz, Ultracargo, Oxiteno, Ipiranga and Extrafarma are presented without the elimination of intersegment transactions. Therefore, the sum of such information may not correspond to Ultrapar’s consolidated information (pro forma). Additionally, the financial and operational information presented in this discussion is subject to rounding and, consequently, the total amounts presented in the tables and charts may differ from the direct numerical sum of the amounts that precede them. Information denominated EBITDA (Earnings Before Interests, Taxes on Income and Social Contribution on Net Income, Depreciation and Amortization); Adjusted EBITDA – adjusted by the amortization of contractual assets with customers – exclusive rights and by the cash flow hedge from bonds; Recurring Adjusted EBITDA – adjusted by non-recurring items; and EBIT (Earnings Before Interest and Taxes on Income and Social Contribution on Net Income) are presented in accordance to Instruction No. 527, issued by CVM on October 4, 2012. The calculation of EBITDA based on net income is shown below: R$ million 3Q22 3Q21 2Q22 9M22 9M21 Net income 82.6 374.3 459.9 1,003.7 493.4 (+) Income and social contribution taxes 27.1 (108.0) 133.2 219.2 47.9 (+) Net financial (income) expenses 328.1 296.0 509.6 1,195.7 632.4 (+) Depreciation and amortization 272.3 346.1 288.9 924.3 1,014.5 (+) Net effect of the cessation of depreciation - - (13.5) (78.5) - EBITDA 710.2 908.4 1,378.1 3,264.4 2,188.3 Accounting adjustments (+) Amortization of contractual assets with customers - exclusive rights (Ipiranga) 127.9 70.5 115.9 332.2 198.6 (+) Amortization of contractual assets with customers - exclusive rights (Ultragaz) 0.4 0.4 0.4 1.1 1.2 (+) Cash flow hedge from bonds (Oxiteno) - 38.0 - 48.1 129.0 Adjusted EBITDA 838.4 1,017.3 1,494.4 3,645.8 2,517.1 Adjusted EBITDA from continuing operations 939.3 651.0 1,189.0 3,027.2 2,017.0 Ultragaz 332.4 220.5 261.0 806.6 507.2 Ultracargo 136.3 102.1 129.6 379.8 294.8 Ipiranga 532.7 398.1 840.0 1,992.2 1,382.9 Holding, abastece aí and other companies (62.5) (71.8) (42.4) (155.4) (175.6) Eliminations 0.3 2.2 0.9 3.9 7.6 - Adjusted EBITDA from discontinued operations (100.9) 366.3 305.4 618.6 500.1 Oxiteno - 351.5 - 396.2 852.2 Extrafarma (64.2) 17.0 17.0 (26.6) (344.5) Capital gain from the sale of Oxiteno - - 289.2 289.2 - Adjustments from the sale of Oxiteno (31.6) - - (31.6) - Adjustments from the sale of Extrafarma (4.7) - - (4.7) - Eliminations (0.3) (2.2) (0.9) (3.9) (7.6) Non-recurring items that affected EBITDA (-) Results from disposal of assets (Ipiranga) (49.3) (17.9) (53.0) (128.2) (55.4) (-) Extemporaneous tax credits (Ipiranga) - (37.9) (32.7) (32.7) (134.8) (-) Extemporaneous tax credits (Oxiteno) - - - (62.4) - (-) Capital gain from the sale of Oxiteno - - (289.2) (289.2) - (+) Adjustments from the sale of Oxiteno 31.6 - - 31.6 - (+) Impairment (Extrafarma) - - - - 394.7 (+) Pre-closing expenses provisions (Extrafarma) 67.4 - - 67.4 - (+) Adjustments from the sale of Extrafarma 4.7 - - 4.7 - Recurring Adjusted EBITDA 892.8 961.5 1,119.5 3,236.9 2,721.5 Recurring Adjusted EBITDA from continuing operations 890.0 595.2 1,103.3 2,866.3 1,826.7 Ultragaz 332.4 220.5 261.0 806.6 507.2 Ultracargo 136.3 102.1 129.6 379.8 294.8 Ipiranga 483.4 342.3 754.3 1,831.3 1,192.6 Holding, abastece aí and other companies (62.5) (71.8) (42.4) (155.4) (175.6) Eliminations 0.3 2.2 0.9 3.9 7.6 Recurring Adjusted EBITDA from discontinued operations 2.8 366.3 16.1 370.7 894.8 Oxiteno - 351.5 - 333.9 852.2 Extrafarma 3.1 17.0 17.0 40.7 50.2 Eliminations (0.3) (2.2) (0.9) (3.9) (7.6) Quarter Accumulated
  • 20. 3 3rd QUARTER OF 2022 3 Ultrapar ¹ Non-recurring items described in the EBITDA calculation table – page 2 ² Includes amortization of contractual assets with customers – exclusive rights ³ Includes the result of the cash flow hedge from bonds until 1Q22 4 Includes R$ 32 million and R$ 29 million related to the grant of Ultracargo’s terminal in Vila do Conde in 1Q22 and 1Q21, respectively, R$ 16 million related to the grant of Ipiranga’s terminal in Belém in 2Q22 and R$ 12 million related to the grant of Ipiranga’s base in Vitória in 3Q22 Net revenues – Total of R$ 39,484 million (+24% YoY and +6% QoQ), due to the increase in net revenues in all businesses, especially Ipiranga, partially offset by the divestments of Oxiteno and Extrafarma and subsequent deconsolidation of their results in April and August 2022, respectively. Recurring Adjusted EBITDA - Continuing operations – Total of R$ 890 million (+50% YoY), due to higher EBITDAs of Ultragaz, Ipiranga and Ultracargo. Compared to 2Q22, recurring Adjusted EBITDA from continuing operations decreased 19%, due to the lower EBITDA of Ipiranga, offset by higher EBITDAs of Ultragaz and Ultracargo. Recurring Adjusted EBITDA - Discontinued operations – Total of R$ 3 million (-99% YoY and -83% QoQ), mainly due to the deconsolidation of the results of Oxiteno and Extrafarma. Depreciation and amortization – Total of R$ 401 million (-4% YoY and -1% QoQ), due to the deconsolidation of the results of Oxiteno and Extrafarma, partially offset by higher investments made during the last 12 months and higher amortization of contractual assets at Ipiranga. Results from the Holding, abastece aí and other companies – Ultrapar recorded a negative result of R$ 62 million in the Holding, abastece aí and other companies, comprised of (i) R$ 45 million of negative EBITDA from the Holding, (ii) R$ 15 million of negative EBITDA from abastece aí, due to expenses with personnel and technology, and (iii) R$ 2 million of negative EBITDA from other companies. Financial result – Ultrapar reported net financial expenses of R$ 328 million in 3Q22, an improvement of R$ 6 million compared to 3Q21, reflecting the negative result of R$ 40 million of mark-to-market of hedges in 3Q22 compared to the negative result of R$ 146 million in 3Q21, attenuated by (i) the effect in 3Q21 of the accrued interest from extraordinary tax credits related to the ICMS exclusion from the PIS/Cofins calculation base in the amount of R$ 60 million; and (ii) the higher CDI rate, despite the lower average balance and lower cost of the net debt. Compared to 2Q22, a period during which Ultrapar recognized net financial expenses of R$ 510 million, the variation is mainly explained by the lower negative effect of mark-to-market of hedges. Net income – Total of R$ 83 million (-78% YoY), explained by the effect of the income tax reversion over monetary adjustment for tax credits of R$ 196 million in 3Q21 and by closing adjustments from the divestments of Oxiteno and Extrafarma in 3Q22, offset by higher EBITDA from continuing operations. Compared to 2Q22, net income decreased 82%, mainly due to the capital gain from the sale of Oxiteno registered in 2Q22 and lower EBITDA of Ipiranga in 3Q22. Cash flow from operations – Generation of R$ 1.3 billion in 3Q22, compared to the generation of R$ 604 million in 3Q21, due to working capital cash release, as a result of fuel prices reductions during the 3Q22 and inventory management, despite the lower EBITDA. Amounts in R$ million 3Q22 3Q21 2Q22 Δ Δ 9M22 9M21 Δ 3Q22 v 3Q21 3Q22 v 2Q22 9M22 v 9M21 Net revenues 39,484 31,911 37,425 24% 6% 110,945 84,387 31% Adjusted EBITDA 838 1,017 1,494 (18%) (44%) 3,646 2,517 45% Recurring Adjusted EBITDA1 893 962 1,119 (7%) (20%) 3,237 2,722 19% Recurring Adjusted EBITDA - Continuing operations 890 595 1,103 50% (19%) 2,866 1,827 57% Recurring Adjusted EBITDA - Discontinued operations 3 366 16 (99%) (83%) 371 895 (59%) Depreciation and amortization² 401 417 405 (4%) (1%) 1,258 1,214 4% Financial result³ (328) (334) (510) 2% 36% (1,244) (761) (63%) Net income 83 374 460 (78%) (82%) 1,004 493 103% Investments4 525 491 412 7% 28% 1,319 1,183 12% Cash flow from operations 1,293 604 376 114% 243% 486 1,882 (74%)
  • 21. 4 3rd QUARTER OF 2022 4 Ultragaz Operational performance – The volume sold by Ultragaz in 3Q22 decreased 1% in relation to 3Q21, resulting from a 3% reduction in sales in the bottled segment, due to lower market demand. The bulk segment, on the other hand, increased 5%, mainly due to higher sales of special gases and to the commercial and services segments. Compared to 2Q22, volume sold increased 6%, due to the typical seasonality between periods. Net revenues – Total of R$ 3,068 million (+14% YoY), due to the pass throughs of higher LPG costs, attenuated by lower sales volume. Compared to 2Q22, net revenues increased 4%, mainly due to higher sales volume. Cost of goods sold – Total of R$ 2,605 million (+11% YoY), due to the readjustments of LPG costs carried out by Petrobras and higher costs with freight and logistics, reflecting the higher price of diesel, and personnel (collective bargaining agreement). Compared to 2Q22, cost of goods sold increased 2%, mainly due to higher sales volume and higher costs with freight and personnel. Sales, general and administrative expenses – Total of R$ 209 million (+20% YoY), resulting from higher personnel expenses (mainly higher variable compensation, aligned with the progression of results, and collective bargaining agreement) and higher sales commissions. Compared to 2Q22, SG&A increased 1%, due to higher personnel and sales commission expenses, attenuated by lower provisions for doubtful accounts. Adjusted EBITDA – Ultragaz reached a record level of EBITDA of R$ 332 million (+51% YoY), due to better margins, as a result of efficiency and productivity initiatives and better sales mix, despite higher expenses. Compared to 2Q22, Adjusted EBITDA increased 27%, due to higher sales volume and better margins. Investments – R$ 90 million were invested in this quarter, directed mainly towards the acquisition and replacement of bottles, equipment installed in customers in the bulk segment and maintenance of existing operations. 3Q22 3Q21 2Q22 Δ Δ 9M22 9M21 Δ 3Q22 v 3Q21 3Q22 v 2Q22 9M22 v 9M21 Total volume (000 tons) 451 453 425 (1%) 6% 1,275 1,298 (2%) Bottled 294 304 281 (3%) 5% 839 876 (4%) Bulk 157 149 144 5% 9% 436 421 3% Adjusted EBITDA (R$ million) 332 220 261 51% 27% 807 507 59% Adjusted EBITDA margin (R$/ton) 738 486 614 52% 20% 633 391 62%
  • 22. 5 3rd QUARTER OF 2022 5 Ultracargo 1 Monthly average Operational performance – Ultracargo's average installed capacity increased 9% YoY, as a result of the start-up of operations in Vila do Conde terminal and the capacity expansion in Itaqui. The m³ sold increased 12%, with higher handling of fuels in Itaqui and the start-up of operations in Vila do Conde. Compared to 2Q22, m³ sold increased 1%, due to higher handling of fuels in Itaqui and the ramp-up of operations in Vila do Conde, offset by lower handling in Santos. Net revenues – Total of R$ 225 million (+26% YoY), due to contractual readjustments and higher m³ sold mostly in Itaqui and Vila do Conde. Compared to 2Q22, net revenues increased 4%, for the same reasons already mentioned. Cost of services provided – Total of R$ 81 million (+17% YoY), of which about 80% of the increase refers to costs and depreciation of Vila do Conde terminal (operations started in December 2021), while the remainder comes from higher depreciation, due to capacity expansions in Itaqui and investments made in the last 12 months, along with the effect of inflation on personnel and inputs. Compared to 2Q22, cost of services provided decreased 8%, due to lower depreciation and lower costs with personnel and inputs. Sales, general and administrative expenses – Total of R$ 39 million (+20% YoY), resulting from higher expenses with personnel (mainly higher variable compensation, in line with the progression of results, and collective bargaining agreement) and engineering studies, attenuated by productivity and efficiency gains. Compared to 2Q22, SG&A increased 13%, due to higher expenses with personnel and engineering studies. Adjusted EBITDA – Ultracargo reached a record level of EBITDA of R$ 136 million (+34% YoY), as a result of the capacity expansions with profitability gains, contractual readjustments and productivity and efficiency gains. Compared to 2Q22, there was a 5% growth, mainly due to contractual readjustments and lower costs, attenuated by higher expenses. Investments – Investments in the period amounted to R$ 72 million, directed towards efficiency gain projects, maintenance, and operational safety of the terminals. 3Q22 3Q21 2Q22 Δ Δ 9M22 9M21 Δ 3Q22 v 3Q21 3Q22 v 2Q22 9M22 v 9M21 Installed capacity¹ (000 m³) 955 878 955 9% 0% 955 860 11% m³ sold (000 m³) 3,445 3,089 3,411 12% 1% 10,076 9,381 7% Adjusted EBITDA (R$ million) 136 102 130 34% 5% 380 295 29% Adjusted EBITDA margin (%) 61% 57% 60% 3 p.p. 1 p.p. 59% 56% 3 p.p.
  • 23. 6 3rd QUARTER OF 2022 6 Ipiranga ¹ Fuel oils, arla 32, kerosene, lubricants and greases Operational performance – The volume sold by Ipiranga grew 3% YoY, with an increase of 4% in diesel and 2% in the Otto cycle. Compared to 2Q22, volume was 7% higher, due to the 8% growth in the Otto cycle and 6% in diesel, resulting mainly from the typical seasonality between the periods. Net revenues – Total of R$ 35,999 million (+35% YoY), due to the pass throughs of higher oil derivatives and ethanol costs, and higher sales volume. Compared to 2Q22, net revenues increased 7%, as a result of higher sales volume, despite the reductions of fuel prices during 3Q22. Cost of goods sold – Total of R$ 35,004 million (+35% YoY), due to increased costs of oil derivatives and ethanol arising from the increase in international prices in the last 12 months, in addition to higher sales volume. Compared to 2Q22, cost of goods sold increased 8%, mainly due to higher sales volume, offset by the reduction of fuel prices during 3Q22. Sales, general and administrative expenses – Total of R$ 590 million (+8% YoY), resulting from higher expenses with freight (diesel prices increase and higher sales volume), personnel (mainly higher variable compensation, in line with the progression of results and collective bargaining agreement), and AmPm’s company-operated stores, partially offset by higher reversals of provisions for doubtful accounts. Compared to 2Q22, SG&A decreased 9%, due to higher reversals of provisions for doubtful accounts and lower contingencies. Other operating results – Total of negative R$ 176 million, a worsening of R$ 181 million in relation to 3Q21, due to costs with CBios in the amount of R$ 191 million in 3Q22 (R$ 144 million higher than in 3Q21) and the constitution of extemporaneous tax credits of R$ 38 million in 3Q21. Compared to 2Q22, the worsening was of R$ 46 million, due to the constitution of extemporaneous tax credits of R$ 33 million in 2Q22 and higher costs with CBios. Results from disposal of assets – Total of R$ 49 million, an increase of R$ 31 million compared to 3Q21, due to higher sales of real estate assets. Compared to 2Q22, there was a decrease of R$ 4 million. Share or profit (loss) of subsidiaries, joint ventures and associates – Total of negative R$ 12 million, mainly due to retroactive entries of IFRS 16 in SPEs formed together with other distributors to operate in the ports of Vitória, Belém and Cabedelo. Recurring Adjusted EBITDA – Total of R$ 483 million (+41% YoY), due to better margins and higher sales volume, attenuated by higher expenses and higher costs with CBios. Compared to 2Q22, there was a decrease of 36%, due to more pressured margins, resulting from fuel prices reductions during 3Q22 and greater product availability, despite of higher sales volume and lower expenses. Investments – R$ 352 million were invested, directed to the expansion and maintenance of Ipiranga’s service stations and franchises network and to logistics infrastructure. Out of the total investments, R$ 144 million refer to additions to fixed and intangible assets, R$ 201 million to contractual assets with customers (exclusive rights), and R$ 7 million to drawdowns of financing to clients and advance payments of rentals, net of receipts. 3Q22 3Q21 2Q22 Δ Δ 9M22 9M21 Δ 3Q22 v 3Q21 3Q22 v 2Q22 9M22 v 9M21 Total volume (000 m³) 6,020 5,855 5,629 3% 7% 17,024 16,807 1% Diesel 3,243 3,121 3,047 4% 6% 9,094 8,896 2% Otto cycle 2,675 2,623 2,472 2% 8% 7,610 7,577 0% Others¹ 103 110 111 (7%) (8%) 321 334 (4%) Adjusted EBITDA (R$ million) 533 398 840 34% (37%) 1,992 1,383 44% Adjusted EBITDA margin (R$/m³) 88 68 149 30% (41%) 117 82 42% Results from disposal of assets 49 18 53 175% (7%) 128 55 131% Extemporaneous tax credits - 38 33 n/a n/a 33 135 (76%) Recurring Adjusted EBITDA (R$ million) 483 342 754 41% (36%) 1,831 1,193 54% Recurring Adjusted EBITDA margin (R$/m³) 80 58 134 37% (40%) 108 71 52%
  • 24. 7 3rd QUARTER OF 2022 7 Indebtedness (R$ million) Ultrapar consolidated 3Q22 3Q21 2Q22 Gross debt (12,236) (16,409) (13,107) Cash and cash equivalents 6,318 6,588 6,739 Net debt (ex-IFRS 16) (5,917) (9,821) (6,368) Leases payable (1,529) (1,816) (1,804) Net debt (7,446) (11,636) (8,172) Net debt/LTM Adjusted EBITDA¹ 1.9x 3.0x 2.2x Average cost of debt 106% DI 105% DI 96% DI DI + 0.7% DI + 0.2% DI - 0.5% Average cash yield (% DI) 96% 61% 79% Average debt duration (years) 4.3 4.9 4.2 ¹ LTM Adjusted EBITDA does not include Extrafarma’s impairments, capital gain and closing adjustments from the sales of ConectCar, Oxiteno and Extrafarma; furthermore, for 2Q22 does not include LTM result from Oxiteno and, for 3Q22, does not include LTM result from Oxiteno and Extrafarma Ultrapar ended 3Q22 with net financial debt of R$ 5.9 billion, composed of a gross indebtedness of R$ 12.2 billion, and cash position of R$ 6.3 billion. Considering the leases payable (IFRS 16) of R$ 1.5 billion, the total net debt was R$ 7.4 billion (1.9x LTM Adjusted EBITDA) compared to R$ 8.2 billion on June 30, 2022 (2.2x LTM Adjusted EBITDA). The reduction in the net debt in comparison to the position at the end of 2Q22 is mainly due to the conclusion of the sale of Extrafarma in August 2022 (upfront payment and outflows of the respective leases payable) and the release of cash in working capital, resulting from the reductions of fuel prices in 3Q22 and from inventory management. These effects were attenuated by the payment of interest on equity in August 2022. The financial leverage reduction reflects the reduction of the net debt and the growth in EBITDA from continuing operations. It is worth mentioning that there are receivables not yet included in Ultrapar's net debt related to the sales (i) of Oxiteno (US$ 150 million to be received in April 2024), and (ii) of Extrafarma (R$ 365 million, monetarily adjusted by CDI + 0.5% p.a., to be received in two installments, the first in August 2023 and the second in August 2024). Maturity profile and debt breakdown: 6,318 3,463 1,096 347 276 2,344 4,710 Cash and cash equivalents Up to 1 year From 1 to 2 years From 2 to 3 years From 3 to 4 years From 4 to 5 years > 5 years Local currency Foreign currency Hedged Non hedged Result from currency and interest hedging instruments
  • 25. 8 3rd QUARTER OF 2022 8 Updates on ESG themes In September, Ultrapar participated in Rio Oil & Gas 2022, an event organized by the Brazilian Institute of Oil and Gas (IBP), which brought together the main companies in the sector to discuss several topics, including energy transition and ESG. Ipiranga and Ultracargo were sponsors of the event, and leaders from the Holding, Ipiranga, Ultragaz and Ultracargo participated in discussion panels and parallel events, such as the Arena ESG and Young Summit. In addition, during the quarter, Ultrapar held immersive meetings of its Social Acceleration Program, which had the participation of more than 100 volunteers and supported 13 NGOs in their management challenges, maximizing their social impact. In all, more than 400 solutions were proposed that could positively impact more than 9 thousand people served by the institutions. Ultrapar entered into a partnership, in July, with Amazônia+21 Institute, an organization created by the CNI (National Confederation of Industry), which seeks to promote sustainable and innovative businesses in Amazon, in addition to contributing to the region's sustainable economic development. In July, Ultragaz donated food baskets, hygiene kits, diapers and water to 1.8 thousand vulnerable families, victims of heavy rains in Jaboatão dos Guararapes (state of Pernambuco). In August, Ultragaz started the Theater in Action project, which will present the play “Missão Natureza” in 15 cities and 11 Brazilian states, promoting children's awareness about the importance of reducing waste generation. In addition, Ultragaz joined the Commitment to the Climate program promoted by the Ekos Institute in partnership with other companies, which aims to encourage the low-carbon economy and facilitate the selection and support of socio-environmental projects to offset GHG emissions. Ultracargo started, in September, another edition of the Training of Port Operators course, providing 25 positions for residents around the Aratu Terminal (state of Bahia). The program is offered free of charge and seeks to contribute to the professional development of residents and attract talent to operations, fostering diversity. During 3Q22, registrations were opened for the Community in Action Award, promoted by Grupo Tribuna (Santos-SP) sponsored by Ultracargo. The initiative, which is in its 20th edition, values voluntary actions by groups, institutions, or individuals for the benefit of social causes in the region. In July, Ipiranga launched the 15th edition of the Health on the Road Program, which offers free medical care and services to drivers, truck drivers and communities close to Ipiranga highway service stations, with the expectation of serving 70 cities in 15 states by the end of the year. Furthermore, it launched Programa Construa, an affirmative action for the hiring and development of people with special needs in the commercial area. In September, Ipiranga concluded Projeto Ajudôu, a social project related to the sports incentive law, 100% financed by the company, which promoted the inclusion of 320 children and young people in situations of social vulnerability in Minas Gerais through the practice of judo.
  • 26. 9 3rd QUARTER OF 2022 9 Source: Broadcast Capital markets Ultrapar’s combined average daily financial volume on B3 and NYSE totaled R$ 89 million/day in 3Q22 (-42% YoY). Ultrapar’s shares ended the quarter quoted at R$ 11.73 on B3, a depreciation of 5% in the quarter, while the Ibovespa stock index appreciated 12%. In NYSE, Ultrapar’s shares and Dow Jones stock index depreciated 7% in the quarter. Ultrapar ended 3Q22 with a market cap of R$ 13 billion. Capital markets 3Q22 3Q21 2Q22 9M22 9M21 Final number of shares (000) 1,115,173 1,115,108 1,115,152 1,115,173 1,115,108 Market capitalization¹ (R$ million) 13,081 16,437 13,728 13,081 16,437 B3 Average daily trading volume (000 shares) 5,741 8,210 7,891 6,748 6,934 Average daily financial volume (R$ 000) 74,580 133,350 105,168 90,850 131,489 Average share price (R$/share) 12.99 16.24 13.33 13.46 18.96 NYSE Quantity of ADRs² (000 ADRs) 54,163 50,374 50,438 54,163 50,374 Average daily trading volume (000 ADRs) 1,122 1,205 1,480 1,298 1,669 Average daily financial volume (US$ 000) 2,771 3,744 3,938 3,405 6,118 Average share (US$/ADRs) 2.47 3.11 2.66 2.62 3.67 Total Average daily trading volume (000 shares) 6,863 9,415 9,371 8,046 8,602 Average daily financial volume (R$ 000) 89,150 152,939 124,690 108,284 164,371 ¹ Calculated on the closing share price for the period ² 1 ADR = 1 common share UGPA3 x Ibovespa performance – 3Q22 (Jun 30, 2022 = 100)
  • 27. 10 3rd QUARTER OF 2022 10 3Q22 Conference call Ultrapar will host a conference call for analysts and investors on November 10, 2022, to comment on the Company’s performance in the third quarter of 2022 and outlook. The presentation will be available for download in the Company’s website 30 minutes prior to the conference call. The conference call will be transmitted via webcast and held in Portuguese with simultaneous translation into English. The access link is available at ri.ultra.com.br. Please connect 10 minutes in advance. Conference call in Portuguese with simultaneous translation to English Time: 11:00 a.m. (BRT) / 09:00 a.m. (EST) Participants in Brazil: +55 (11) 3181-8565 or +55 (11) 4090-1621 Code: Ultrapar – in Portuguese Replay: +55 (11) 3193-1012 (available for seven days) Code: 3167603# International participants: +1 (844) 204-8942 or +1 (412) 717-9627 Code: Ultrapar – in English Replay: +55 (11) 3193-1012 (available for seven days) Code: 9792937#
  • 28. 11 3rd QUARTER OF 2022 11 In million of Reais SEP 22¹ SEP 21 JUN 22 Continuing operations² Discontinued operations² ASSETS Cash and cash equivalents 4,626.7 2,826.3 4,745.1 4,707.3 37.8 Financial investments and hedge derivative financial instruments 1,264.0 2,914.9 1,372.8 1,372.8 (0.0) Trade receivables and reseller financing 4,557.2 4,624.4 4,547.1 4,423.9 123.2 Trade receivables - sale of subsidiaries 186.1 - - - - Inventories 4,333.7 5,574.2 6,573.3 6,010.5 562.8 Recoverable taxes 1,358.7 1,540.7 1,488.9 1,422.1 66.8 Prepaid expenses 123.8 141.2 152.3 143.1 9.1 Contractual assets with customers - exclusive rights 599.6 533.7 579.4 579.4 - Other receivables 88.1 106.4 119.1 101.5 17.6 Total Current Assets 17,137.8 18,261.8 19,578.0 18,760.6 817.3 Financial investments and hedge derivative financial instruments 427.6 847.3 621.3 621.3 - Trade receivables and reseller financing 549.3 481.4 513.9 513.9 - Trade receivables - sale of subsidiaries 928.0 - 707.6 707.6 - Deferred income and social contribution taxes 1,021.4 1,245.5 1,016.6 812.1 204.5 Recoverable taxes 1,622.6 1,815.2 1,352.2 1,330.6 21.7 Escrow deposits 880.1 868.4 875.1 871.4 3.7 Prepaid expenses 79.8 84.3 64.9 64.9 0.0 Contractual assets with customers - exclusive rights 1,691.6 1,385.2 1,646.2 1,646.2 - Other receivables 155.1 175.1 154.3 154.3 - Investments 119.1 172.4 117.2 117.2 - Right of use assets 1,804.7 2,093.0 2,049.9 1,723.2 326.8 Property, plant and equipment 5,775.2 8,235.0 5,768.7 5,624.6 144.1 Intangible assets 1,875.0 1,707.7 1,828.4 1,751.1 77.3 Total Non-Current Assets 16,929.3 19,110.5 16,716.2 15,938.1 778.1 TOTAL ASSETS 34,067.2 37,372.3 36,294.2 34,698.8 1,595.4 LIABILITIES - - - - - Loans, financing and hedge derivative financial instruments 889.5 945.6 324.3 324.3 - Debentures 2,573.5 1,475.4 3,382.8 3,382.8 - Trade payables 6,097.8 6,364.1 6,889.7 6,680.8 208.9 Salaries and related charges 416.2 549.0 376.3 321.4 54.8 Taxes payable 316.1 396.5 534.2 515.7 18.5 Leases payable 218.4 269.5 278.8 206.6 72.2 Other payables 683.7 345.1 889.2 886.4 2.8 Total Current Liabilities 11,195.2 10,345.2 12,675.3 12,318.1 357.3 Loans, financing and hedge derivative financial instruments 4,572.6 8,458.9 5,178.4 5,178.4 0.0 Debentures 4,200.2 5,529.2 4,221.4 4,221.4 - Provisions for tax, civil and labor risks 1,011.5 797.2 989.7 987.7 2.0 Post-employment benefits 199.8 262.8 197.3 197.0 0.3 Leases payable 1,310.6 1,546.3 1,525.1 1,215.3 309.8 Other payables 206.0 247.8 214.7 212.4 2.2 Total Non-Current Liabilities 11,500.6 16,842.1 12,326.5 12,012.2 314.3 TOTAL LIABILITIES 22,695.8 27,187.4 25,001.8 24,330.2 671.6 EQUITY - - - - - Share capital 5,171.8 5,171.8 5,171.8 5,171.8 - Reserves 5,467.4 5,008.3 5,467.6 5,467.6 - Treasury shares (489.0) (489.1) (488.4) (488.4) - Other 761.3 104.9 690.3 690.3 - Non-controlling interests in subsidiaries 460.0 389.1 451.2 451.2 - Total Equity 11,371.4 10,185.0 11,292.4 11,292.4 - TOTAL LIABILITIES AND EQUITY 34,067.2 37,372.3 36,294.2 35,622.6 671.6 Cash and financial investments 6,318.3 6,588.4 6,739.2 n/a n/a Loans and debentures (12,235.8) (16,409.1) (13,106.8) n/a n/a Leases payable (1,528.9) (1,815.8) (1,803.9) n/a n/a Net cash (debt) (7,446.4) (11,636.4) (8,171.5) n/a n/a Net cash (debt) ex-IFRS 16 (5,917.5) (9,820.7) (6,367.6) n/a n/a ¹ Balance sheet of 3Q22 corresponds to continuing operations only ² Since the financial management is unified in the Holding, the indiv idual v iew of the balance sheet of continuing and discontinued operations does not reflect the reality of the companies (assets and liabilities differ) ULTRAPAR CONSOLIDATED BALANCE SHEET
  • 29. 12 3rd QUARTER OF 2022 12 In million of Reais 3Q22¹ Continuing operations Discontinued operations¹ 3Q21 Continuing operations Discontinued operations 2Q22 Continuing operations Discontinued operations 9M22 9M21 Net revenues from sales and services 39,483.8 39,294.7 189.0 31,911.1 29,452.5 2,458.7 37,425.1 36,879.4 545.8 110,944.9 84,387.5 Cost of products and services sold (37,900.5) (37,708.7) (191.8) (30,112.2) (28,270.2) (1,842.0) (35,401.7) (35,027.5) (374.1) (105,254.8) (79,376.8) Gross profit 1,583.3 1,586.1 (2.8) 1,798.9 1,182.3 616.7 2,023.5 1,851.9 171.6 5,690.1 5,010.6 Operating expenses Selling and marketing (563.0) (508.8) (54.2) (781.5) (504.8) (276.7) (699.0) (546.6) (152.4) (2,017.3) (2,140.2) General and administrative (409.7) (388.6) (21.1) (497.7) (344.0) (153.8) (448.8) (408.2) (40.6) (1,315.9) (1,439.6) - - - Other operating income, net (174.9) (174.9) (0.0) 35.6 10.9 24.7 (137.7) (136.9) (0.8) (405.9) 101.5 Results from disposal of assets 13.3 49.2 (35.9) 18.0 17.5 0.6 343.5 55.6 287.9 379.4 58.2 Impairment - - - - - - - - - - (394.7) Operating income (loss) 449.0 562.9 (114.0) 573.4 361.9 211.5 1,081.5 815.8 265.8 2,330.3 1,195.8 Financial result Financial income 176.6 176.4 0.2 127.0 114.7 12.3 210.2 209.7 0.5 498.5 339.1 Financial expenses (504.8) (501.1) (3.6) (423.0) (368.4) (54.5) (719.7) (708.3) (11.4) (1,694.2) (971.6) Share of profit (loss) of subsidiaries, joint ventures and associates (11.1) (11.1) - (11.1) (11.3) 0.2 7.7 7.7 - 9.9 (22.0) Income before income and social contribution taxes 109.7 227.0 (117.4) 266.3 96.8 169.5 579.7 324.8 254.8 1,144.5 541.3 Income and social contribution taxes Current (126.3) (271.0) 144.7 (20.2) (44.8) 24.6 (357.1) (100.9) (256.2) (773.6) (383.9) Deferred 78.7 203.8 (125.1) 95.9 91.6 4.3 208.2 157.4 50.8 474.6 269.8 Tax incentives 20.4 20.4 - 32.3 17.9 14.4 15.7 15.7 - 79.7 66.3 - - - Net effect of the cessation of depreciation² - - - - - - 13.5 - 13.5 78.5 - Net income (loss) 82.6 180.3 (97.7) 374.3 161.5 212.8 459.9 397.0 62.9 1,003.7 493.4 Net income attributable to: Shareholders of the Company 73.1 170.8 (97.7) 369.2 156.4 212.8 452.9 390.0 62.9 978.2 470.3 Non-controlling interests in subsidiaries 9.5 9.5 - 5.1 5.1 - 7.1 7.1 - 25.5 23.2 Adjusted EBITDA 838.4 939.3 (100.9) 1,017.3 651.0 366.3 1,494.4 1,189.0 305.4 3,645.8 2,517.1 Non-recurring items Results from disposal of assets (Ipiranga) (49.3) (49.3) - (17.9) (17.9) - (53.0) (53.0) - (128.2) (55.4) Extemporaneous tax credits (Ipiranga) - - - (37.9) (37.9) - (32.7) (32.7) - (32.7) (134.8) Extemporaneous tax credits (Oxiteno) - - - - - - - - - (62.4) - Capital gain from the sale of Oxiteno - - - - - - (289.2) - (289.2) (289.2) - Adjustments from the sale of Oxiteno 31.6 - 31.6 - - - - - - 31.6 - Impairment (Extrafarma) - - - - - - - - - - 394.7 Pre-closing expenses provisions (Extrafarma) 67.4 - 67.4 - - - - - - 67.4 - Adjustments from the sale of Extrafarma 4.7 - 4.7 - - - - - - 4.7 - Recurring Adjusted EBITDA 892.8 890.0 2.8 961.5 595.2 366.3 1,119.5 1,103.3 16.1 3,236.9 2,721.5 Depreciation and amortization³ 400.6 387.5 13.1 417.0 300.4 116.6 405.2 365.6 39.6 1,257.6 1,214.3 - - - - - - Cash flow hedge from bonds - - - 38.0 - 38.0 - - - 48.1 129.0 - - - - - - Total investments4 525.2 523.6 1.7 491.4 427.1 64.3 411.6 406.8 4.7 1,319.3 1,182.8 - - - - - - Ratios - - - - - - Earnings per share (R$) 0.07 0.16 (0.09) 0.34 0.14 0.20 0.42 0.36 0.06 0.90 0.43 Net debt / LTM Adjusted EBITDA5 1.9x n/a n/a 3.0x n/a n/a 2.2x n/a n/a 1.9x 3.0x Gross margin (%) 4.0% 4.0% (1.5%) 5.6% 4.0% 25.1% 5.4% 5.0% 31.4% 5.1% 5.9% Operating margin (%) 1.1% 1.4% (60.3%) 1.8% 1.2% 8.6% 2.9% 2.2% 48.7% 2.1% 1.4% Adjusted EBITDA margin (%) 2.1% 2.4% (53.4%) 3.2% 2.2% 14.9% 4.0% 3.2% 56.0% 3.3% 3.0% Recurring Adjusted EBITDA margin (%) 2.3% 2.3% 1.5% 3.0% 2.0% 14.9% 3.0% 3.0% 3.0% 2.9% 3.2% - - - Number of employees 9,644 9,644 - 16,218 8,507 7,711 14,958 9,350 5,608 9,644 16,218 ¹ Considers Extrafarma's result for July only, due to the conclusion of its sale on August 1st , 2022 ² As of 01/01/2022, the depreciation and amortization of discontinued operations was ceased, after the reclassification to current assets, in the line of assets held for sale, according to item 25 of CPC 31 / IFRS 5 ³ Includes amortization with contractual assets with customers – exclusiv e rights INCOME STATEMENT ULTRAPAR 4 Includes property, plant and equipment and additions to intangible assets (net of div estitures), contractual assets with customers (exclusiv e rights), initial direct costs of assets with right of use, contributions made to SPEs (Specific Purpose Companies), payment of grants, financing of clients, rental adv ances (net of repayments) and acquisition of shareholdings 5 LTM Adjusted EBITDA does not include Extrafarma’s impairments, capital gain and closing adjustments from the sales of ConectCar, Oxiteno and Extrafarma; furthermore, for 2Q22 does not include LTM result from Oxiteno and, for 3Q22, does not include LTM result from Oxiteno and Extrafarma
  • 30. 13 3rd QUARTER OF 2022 13 JAN -SEP 2022 JAN - SEP 2021 Re-presented Cash flows from operating continuing activities Net income - continuing operations 694.2 476.9 Adjustments to reconcile net income to cash provided by operating activities Share of loss (profit) of subsidiaries, joint ventures and associates (10.1) 22.2 Amortization of contractual assets with customers - exclusive rights and right-of-use assets 543.8 392.5 Depreciation and amortization 550.4 488.8 Interest and foreign exchange rate variations 1,208.4 861.8 Current and deferred income and social contribution taxes (2.2) 117.2 Results from disposal of assets (129.8) (57.9) Equity instrument granted 16.8 6.9 Provision for decarbonization - CBios 497.1 111.2 Other provisions and adjustments 12.2 (79.5) 3,380.7 2,340.1 (Increase) decrease in assets Trade receivables and reseller financing (637.7) (621.6) Inventories (420.3) (1,329.1) Recoverable taxes (736.2) (571.9) Dividends received from subsidiaries, joint ventures and associates 0.1 0.1 Other assets (176.1) (11.3) Increase (decrease) in liabilities Trade payables and trade payables - reverse factoring 270.8 1,680.1 Salaries and related charges 86.1 59.6 Tax obligations (41.7) (12.2) Other liabilities 67.9 (79.9) CBios acquisition (542.5) (121.9) Payments of contractual assets with customers - exclusive rights (512.3) (222.6) Income and social contribution taxes paid (283.3) (164.8) Net cash provided by (used in) operating activities - continuing operations 455.6 944.5 Net cash provided by (used in) operating activities - discontinued operations 30.6 937.9 Net cash provided by (used in) operating activities 486.1 1,882.4 Cash flows from investing activities Financial investments, net of redemptions 902.1 2,151.6 Acquisition of property, plant and equipment and intangible assets (851.0) (844.6) Receipt of the intercompany loan due by Oxiteno S.A to Ultrapar International 3,980.7 - Proceeds from disposal of investments and assets 2,734.4 97.1 Capital increase in subsidiary and joint ventures (28.0) (25.7) Transactions with discontinued operations 987.9 - Capital decrease in associates - 1.5 Initial upfront costs of entitlement assets - (14.9) Related parties - (21.6) Net cash provided by (used in) investing activities - continuing operations 7,726.2 1,343.3 Net cash provided by (used in) investing activities - discontinued operations (220.2) (129.2) Net cash provided by (used in) investing activities 7,506.0 1,214.0 Cash flows from financing activities Loans and debentures Proceeds 1,019.6 1,379.0 Amortization (4,966.7) (2,426.1) Interest paid (961.9) (451.1) Payments of leases¹ (272.9) (251.1) Dividends paid (634.7) (705.6) Capital increase made by non-controlling interests and redemption of shares 21.7 - Related parties (18.9) (0.2) Net cash provided by (used in) financing activities - continuing operations (5,813.8) (2,455.1) Net cash provided by (used in) financing activities - discontinued operations (179.0) (514.8) Net cash provided by (used in) financing activities (5,992.8) (2,969.9) Effect of exchange rate changes on cash and cash equivalents in foreign currency - continuing operations (21.3) (10.7) Effect of exchange rate changes on cash and cash equivalents in foreign currency - discontinued operations (19.3) 48.9 Effect of exchange rate changes on cash and cash equivalents in foreign currency (40.7) 38.2 Increase (decrease) in cash and cash equivalents - continuing operations 2,346.6 164.8 Increase (decrease) in cash and cash equivalents - descontinued operations (388.0) - Increase (decrease) in cash and cash equivalents 1,958.6 164.8 Cash and cash equivalents at the beginning of the period - continuing operations 2,280.1 2,661.5 Cash and cash equivalents at the beginning of the period - descontinued operations 388.0 - Cash and cash equivalents at the beginning of the period 2,668.1 2,661.5 Cash and cash equivalents at the end of the period - continuing operations 4,626.6 2,826.3 Cash and cash equivalents at the end of the period - descontinued operations - - Cash and cash equivalents at the end of the period 4,626.6 2,826.3 Transactions without cash effect: Addition on right to use assets and leases payable 420.8 204.5 Addition on contractual assets with customers - exclusive rights 38.8 197.9 Reversal fund - private pension 3.1 3.7 Issuance of shares related to the subscription warrants - indemnification - Extrafarma acquisition 0.9 1.8 ULTRAPAR CASH FLOWS In million of Reais ¹ Includes R$ 32 million and R$ 29 million related to the grant of Ultracargo’s terminal in Vila do Conde in 1Q22 and 1Q21, respectiv ely, R$ 16 million related to the grant of Ipiranga's terminal in Belém in 2Q22 and R$ 12 million related to the grant of Ipiranga's terminal in Vitória in 3Q22
  • 31. 14 3rd QUARTER OF 2022 14 In million of Reais SEP 22 SEP 21 JUN 22 OPERATING ASSETS Trade receivables 591.8 472.4 569.6 Non-current trade receivables 17.1 29.9 18.8 Inventories 196.9 177.3 199.2 Taxes 103.8 86.0 100.8 Escrow deposits 200.6 220.0 207.6 Other 89.6 79.1 84.5 Right of use assets 151.8 89.4 124.6 Property, plant and equipment / Intangibles 1,274.8 1,181.2 1,245.4 TOTAL OPERATING ASSETS 2,626.3 2,335.2 2,550.4 OPERATING LIABILITIES Trade payables 193.4 119.5 166.0 Salaries and related charges 120.8 99.0 89.9 Taxes 13.9 15.8 16.5 Judicial provisions 126.2 124.2 125.2 Leases payable 189.5 141.4 162.3 Other 71.4 53.9 83.7 TOTAL OPERATING LIABILITIES 715.1 553.8 643.6 In million of Reais 3Q22 3Q21 2Q22 9M22 9M21 Net revenues 3,067.5 2,679.5 2,944.2 8,651.0 7,063.0 - - - - - Cost of products sold (2,605.2) (2,352.7) (2,550.8) (7,479.0) (6,280.0) Gross profit 462.3 326.8 393.4 1,171.9 783.0 Operating expenses Selling and marketing (146.3) (120.8) (144.8) (414.2) (329.2) General and administrative (62.4) (53.1) (61.1) (178.2) (150.7) Other operating income 3.6 2.9 0.3 8.2 10.3 Results from disposal of assets (0.1) (0.4) (0.1) (0.9) 2.5 Operating income (loss) 257.2 155.3 187.6 586.8 315.8 Share of profit (loss) of subsidiaries, joint ventures and associates (0.0) (0.0) 0.0 0.0 0.0 Adjusted EBITDA 332.4 220.5 261.0 806.6 507.2 Depreciation and amortization¹ 75.2 65.1 73.4 219.8 191.4 Ratios - - - - - Gross margin (R$/ton) 1,026 721 925 919 603 Operating margin (R$/ton) 571 343 441 460 243 Adjusted EBITDA margin (R$/ton) 738 486 614 633 391 Number of employees 3,496 3,409 3,420 3,496 3,409 ¹ Includes amortization with contractual assets with customers - exclusiv e rights CONSOLIDATED BALANCE SHEET ULTRAGAZ CONSOLIDATED INCOME STATEMENT
  • 32. 15 3rd QUARTER OF 2022 15 In million of Reais SEP 22 SEP 21 JUN 22 OPERATING ASSETS Trade receivables 17.2 25.3 19.5 Inventories 10.4 8.7 9.7 Taxes 7.7 24.1 13.6 Other 37.8 23.8 39.2 Right of use assets 655.6 536.8 580.1 Property, plant and equipment / Intangibles / Investments 1,759.5 1,659.9 1,710.5 TOTAL OPERATING ASSETS 2,488.3 2,278.7 2,372.7 OPERATING LIABILITIES Trade payables 61.8 44.9 48.2 Salaries and related charges 46.9 44.6 37.6 Taxes 4.8 5.2 8.8 Judicial provisions 9.7 10.1 9.5 Leases payable 598.4 481.4 514.4 Other¹ 63.2 61.0 72.1 TOTAL OPERATING LIABILITIES 784.8 647.3 690.5 In million of Reais 3Q22 3Q21 2Q22 9M22 9M21 Net revenues 224.5 177.8 216.8 638.8 525.7 Cost of services provided (80.9) (69.2) (87.7) (252.3) (207.8) Gross profit 143.6 108.7 129.1 386.4 317.9 Operating expenses Selling and marketing (2.4) (2.2) (2.8) (9.1) (6.2) General and administrative (36.8) (30.5) (31.8) (95.2) (93.9) - - - - - Other operating income (0.4) 0.8 (0.1) (1.7) 4.0 Results from disposal of assets 0.0 (0.0) (0.1) (0.2) 0.0 Operating income (loss) 104.1 76.7 94.3 280.3 221.8 Share of profit (loss) of subsidiaries, joint ventures and associates (0.5) 0.1 (0.3) (1.4) 0.7 Adjusted EBITDA 136.3 102.1 129.6 379.8 294.8 Depreciation and amortization 32.8 25.2 35.6 100.9 72.3 Ratios Gross margin (%) 64.0% 61.1% 59.6% 60.5% 60.5% Operating margin (%) 46.4% 43.2% 43.5% 43.9% 42.2% Adjusted EBITDA margin (%) 60.7% 57.4% 59.8% 59.5% 56.1% Number of employees 869 736 864 869 736 ¹ Includes the long term obligations with clients account CONSOLIDATED BALANCE SHEET ULTRACARGO CONSOLIDATED INCOME STATEMENT
  • 33. 16 3rd QUARTER OF 2022 16 In million of Reais SEP 22 SEP 21 JUN 22 OPERATING ASSETS Trade receivables 3,940.6 3,119.6 3,855.9 Non-current trade receivables 532.2 451.4 495.1 Inventories 4,125.4 3,436.6 5,800.0 Taxes 2,485.7 1,820.3 2,214.2 Contractual assets with customers - exclusive rights 2,288.1 1,914.4 2,222.1 Other 501.8 481.2 491.6 Right of use assets 990.3 1,043.8 1,011.6 Property, plant and equipment / Intangibles / Investments 4,310.4 3,669.5 4,114.7 TOTAL OPERATING ASSETS 19,174.5 15,936.6 20,205.2 OPERATING LIABILITIES Trade payables 5,768.5 4,773.3 6,401.7 Salaries and related charges 177.3 130.9 138.2 Post-employment benefits 213.0 269.0 210.5 Taxes 164.6 178.2 176.2 Judicial provisions 287.0 212.9 305.0 Leases payable 733.1 730.4 737.5 Other 654.2 370.3 483.3 TOTAL OPERATING LIABILITIES 7,997.8 6,665.0 8,452.4 In million of Reais 3Q22 3Q21 2Q22 9M22 9M21 Net revenues 35,999.1 26,613.8 33,706.0 98,375.1 70,322.6 Cost of products and services sold (35,004.4) (25,891.8) (32,391.5) (95,025.8) (68,106.8) Gross profit 994.7 722.0 1,314.5 3,349.4 2,215.7 Operating expenses Selling and marketing (359.5) (361.2) (398.2) (1,131.7) (981.5) General and administrative (230.5) (184.9) (247.7) (657.1) (544.7) Other operating income (176.1) 5.2 (129.9) (416.3) 59.1 Results from disposal of assets 49.3 17.9 53.0 128.2 55.4 Operating income (loss) 277.9 199.0 591.7 1,272.4 804.1 Share of profit (loss) of subsidiaries, joint ventures and associates (12.4) 0.6 0.8 (10.4) (1.3) Adjusted EBITDA 532.7 398.1 840.0 1,992.2 1,382.9 Non-recurring items Results from disposal of assets (49.3) (17.9) (53.0) (128.2) (55.4) Extemporaneous tax credits - (37.9) (32.7) (32.7) (134.8) Recurring Adjusted EBITDA 483.4 342.3 754.3 1,831.3 1,192.6 Depreciation and amortization¹ 267.2 198.5 247.5 730.3 580.1 Ratios Gross margin (R$/m³) 165 123 234 197 132 Operating margin (R$/m³) 46 34 105 75 48 Adjusted EBITDA margin (R$/m³) 88 68 149 117 82 Recurring Adjusted EBITDA margin (R$/m³) 80 58 134 108 71 Number of service stations 6,940 7,088 7,010 6,940 7,088 Number of employees 4,587 3,778 4,363 4,587 3,778 ¹ Includes amortization with contractual assets with customers - exclusiv e rights CONSOLIDATED BALANCE SHEET IPIRANGA CONSOLIDATED INCOME STATEMENT
  • 34. 17 3rd QUARTER OF 2022 17 In million of Reais SEP 22 SEP 21 JUN 22 OPERATING ASSETS Trade receivables - 35.0 123.2 Inventories - 527.0 562.8 Taxes - 74.8 86.5 Other - 33.3 35.1 Right of use assets - 352.8 313.2 Property, plant and equipment / Intangibles - 247.4 207.9 TOTAL OPERATING ASSETS - 1,270.4 1,328.6 OPERATING LIABILITIES Trade payables - 194.2 208.9 Salaries and related charges - 62.4 54.8 Taxes - 14.9 18.5 Judicial provisions - 10.2 2.5 Leases payable - 383.9 382.0 Other - 19.2 10.6 TOTAL OPERATING LIABILITIES - 684.8 677.3 In million of Reais 3Q22¹ 3Q21 2Q22 9M22 9M21 Gross revenues 199.9 509.6 575.8 1,304.7 1,568.6 Sales returns, discounts and taxes (10.9) (26.2) (30.0) (69.2) (81.5) Net revenues 189.0 483.4 545.8 1,235.5 1,487.1 Cost of products and services sold (191.8) (333.7) (374.1) (912.3) (1,032.1) Gross profit (2.8) 149.7 171.6 323.2 455.0 Operating expenses (75.0) (175.3) (192.1) (436.2) (520.0) Other operating income (0.0) 2.7 (0.8) (2.2) 0.0 Results from disposal of assets 0.5 0.8 (1.3) (3.8) 0.2 Impairment - - - - (394.7) Operating income (loss) (77.3) (22.1) (22.6) (119.0) (459.5) Adjusted EBITDA (64.2) 17.0 17.0 (26.6) (344.5) Non-recurring items Impairment - - - - 394.7 Pre-closing expenses provisions 67.4 - - 67.4 - Recurring Adjusted EBITDA 3.1 17.0 17.0 40.7 50.2 Depreciation and amortization 13.1 39.1 39.7 92.4 115.0 Ratios² Gross margin (%) (1.4%) 29.4% 29.8% 24.8% 29.0% Operating margin (%) (38.7%) (4.3%) (3.9%) (9.1%) (29.3%) Adjusted EBITDA margin (%) (32.1%) 3.3% 3.0% (2.0%) (22.0%) Recurring Adjusted EBITDA margin (%) 1.6% 3.3% 3.0% 3.1% 3.2% Number of stores - 399 399 - 399 Number of employees - 5,838 5,608 - 5,838 ¹ Considers Extrafarma's result for July only, due to the conclusion of its sale on August 1st , 2022 ² Calculated based on gross rev enues BALANCE SHEET EXTRAFARMA INCOME STATEMENT