Exit managed futures now?
•
0 gefällt mir•363 views

Managed futures have significantly underperformed broad markets over the past few years. When an asset class disappoints, selling it is always tempting. But they are still worthwhile. If anything, this might be an appropriate time to direct more funds into them. Managed futures give you exposure to future prices of commodities, equities and currencies with the benefit of professional management. This asset class has a low correlation to traditional stocks. So if there’s another stock market crash, manag

Empfohlen
Empfohlen
Weitere ähnliche Inhalte
Was ist angesagt?
Was ist angesagt? (18)
Andere mochten auch
Ähnlich wie Exit managed futures now?
Ähnlich wie Exit managed futures now? (20)
Kürzlich hochgeladen
Kürzlich hochgeladen (20)
Exit managed futures now?
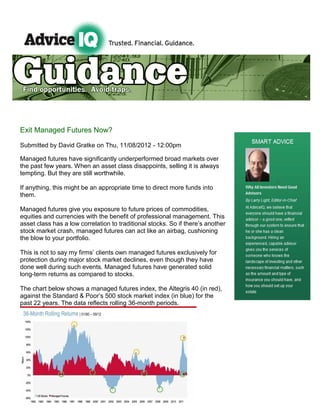
- 1. Exit Managed Futures Now? Submitted by David Gratke on Thu, 11/08/2012 - 12:00pm Managed futures have significantly underperformed broad markets over the past few years. When an asset class disappoints, selling it is always tempting. But they are still worthwhile. If anything, this might be an appropriate time to direct more funds into them. Managed futures give you exposure to future prices of commodities, equities and currencies with the benefit of professional management. This asset class has a low correlation to traditional stocks. So if there’s another stock market crash, managed futures can act like an airbag, cushioning the blow to your portfolio. This is not to say my firms’ clients own managed futures exclusively for protection during major stock market declines, even though they have done well during such events. Managed futures have generated solid long-term returns as compared to stocks. The chart below shows a managed futures index, the Altegris 40 (in red), against the Standard & Poor’s 500 stock market index (in blue) for the past 22 years. The data reflects rolling 36-month periods.
- 2. The chart shows that over the past 20 years, there have been four distinct timespans where managed futures have greatly underperformed the broad stock market indexes. We are in one of those periods right now. But historically, after some spell of significant underperformance by managed futures, they have risen sharply, often against the backdrop of a declining stock market. What’s more, managed futures do not have a record of falling as far as stocks have. The rolling returns for stocks (also known as “risk assets”) was as sharp as negative 37% (in 2008) while managed futures have only exhibited a 36-month worst-case return of just nearly zero. Although markets have experienced tremendous price fluctuations, the longer-term underlying trends for many managed futures (stock and bond indexes, commodities and currencies) was basically flat, making it hard to discern a major trend. Let’s review several charts to understand the asset class’ near-term under-performance. Interest rates. The chart here on the 10-year U.S. Treasury bond reflects a yield of 1.6% in July 2012. Although the yield moved as low as 1.4% and as high as 1.85%, it fell back to near 1.6% in September. So in this three-month window, despite the volatility, interest rates stayed essentially flat. Oil. The chart on oil is of a similar pattern, a lot of short-term price movement, but the overall trend for the period was flat.
- 3. Although oil was as high as $110 per barrel and down to nearly $75 per barrel, the nine-month trend also was flat, thus making it difficult for intermediate to long-term trend-following managers to make money. Central bank intervention. In the past five years, central banks around the world injected more than $9 trillion dollars into their sluggish economies, hoping to stimulate growth. Asset purchases by central banks, called quantitative easing (or QE, for short), has still not successfully ignited the global economy. But those short bursts of stimulus certainly led to unusual market movements, where investors were more likely to take risks, such as by buying stocks. Once the central banks stop increasing the money supply, they become risk- averse again. The chart below clearly illustrates the effect of the Federal Reserve’s asset purchase programs on the S&P 500 stock index. Similar results occurred in bond rates, commodities and currencies, the four major markets managed futures managers work in. Many of the managed futures managers we work with are trend-followers. Some look for a trend that persists for months, not just days and weeks. Other managers zero in on very short-term trends. At the moment, given the unsettled nature of the U.S. and European economies, we prefer those with a more short-term philosophy. Tipping points. What can change or create a new trend? Three key global events could move markets and potentially change their direction over the next few years. One is the U.S. fiscal cliff – the huge tax increases and brutal spending cuts that will occur on Jan. 1, 2013 unless Congress does something to prevent them. Falling off this cliff could throw the U.S. back into a recession, which would have global implications. A second is China’s recent economic slowdown. As China prepares to choose its next generation of leaders, its prodigious economic growth is flagging. This is partly linked to the ongoing European debt crisis. That region’s leaders are increasingly at odds with one another, and there is
- 4. still no end in sight for Europe’s malaise. Dire consequences could ensue if there is a sovereign default by a European nation, a country’s exit from the Eurozone or an erosion of consensus over economic recovery plans. Any one of these events, or any combination, can create new trends, presenting risk for those who are not prepared and opportunities for those who are. Given stocks’ greater volatility versus managed futures (the first chart), which is the better road to travel? As the chart below illustrates, over the past 15 years, managed futures arrived at a slightly better cumulative return than U.S, stocks but with much less trauma. Sophisticated hedging strategies did better – global macro and long/short, which involve betting both for and against different asset classes. We aren’t predicting that stocks or any other asset class will collapse and managed futures will sharply rally. But if history is any guide, this strategy should continue to do well. It outpaces stocks and has for some time. This probably is not the time to exit from managed futures. Follow AdviceIQ on Twitter at @adviceiq. David Gratke is chief executive officer of Gratke Wealth LLC in Beaverton, Ore. Source of Data: Altegris Q3 2012 Alternative Investment Market Review AdviceIQ delivers quality personal finance articles by both financial advisors and AdviceIQ editors. It ranks advisors in your area by specialty. For instance, the rankings this week measure the number of clients whose income is between $250,000 and $500,000 with that advisor. AdviceIQ also vets ranked advisors so only those with pristine regulatory histories can participate. AdviceIQ was launched Jan. 9, 2012, by veteran Wall Street executives, editors and technologists. Right now, investors may see many advisor rankings, although in some areas only a few are ranked. Check back often as thousands of advisors are undergoing AdviceIQ screening. New advisors appear in rankings daily.