Size of m&e industry
•Als PPTX, PDF herunterladen•
1 gefällt mir•2,422 views

Deviprasad Goenka Management college of Media Studies http://www.dgmcms.org.in/ Subject:BRAND BUILDING Lesson :Size of m&e industry Faculty Name: Vishal Desai

Empfohlen
Empfohlen
Weitere ähnliche Inhalte
Was ist angesagt?
Was ist angesagt? (20)
Andere mochten auch
Andere mochten auch (20)
Ähnlich wie Size of m&e industry
Ähnlich wie Size of m&e industry (20)
Mehr von Deviprasad Goenka Management College of Media Studies
Mehr von Deviprasad Goenka Management College of Media Studies (20)
Kürzlich hochgeladen
Kürzlich hochgeladen (20)
Size of m&e industry
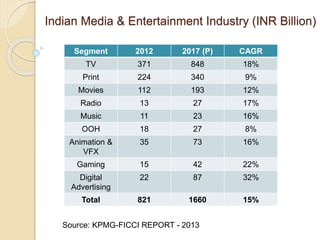
- 1. Indian Media & Entertainment Industry (INR Billion) Segment 2012 2017 (P) CAGR TV 371 848 18% Print 224 340 9% Movies 112 193 12% Radio 13 27 17% Music 11 23 16% OOH 18 27 8% Animation & VFX 35 73 16% Gaming 15 42 22% Digital 22 87 32% Advertising Total 821 1660 15% Source: KPMG-FICCI REPORT - 2013
- 2. Indian M&E Industry Size – 2012 (INR 821 Billion) TV 45% Animation & VFX 4% Gaming Print 27% Music 1% OOH, 2.5% Radio 2% Movies 14% 2% Digital Advertising, 2.5% TV Print Radio OOH Music Movies Animation & VFX Gaming Digital Advertising Source: KPMG FICCI REPORT - 2013
- 3. Indian M&E Industry Size – 2017 (P) (INR 1660 Billion) TV 51% Print 20% Source: KPMG FICCI REPORT - 2013 Movies 12% Music 1% OOH 2% Radio, 2% Animation & VFX 4% Gaming, , 3% Digital Advertising, , 4% TV Print Radio OOH Music Movies Animation & VFX Gaming Digital Advertising
- 4. Global Media & Entertainment Industry Size Segment USD Billion CAGR % Movie Entertainment 103 4.9 TV -Networks & Distribution 480 7.5 Music 40 2.3 Radio & Out-of-Home 99 5.2 Gaming 50 9.1 Business Information 110 5.8 Print 317 2.1 Theme Parks and Amusement Parks 30 4.6 Casino and Other Regulated Gaming 144 7.2 Sports Entertainment 123 5.2 Total 1496 6.4 Source- PWC Report
- 5. Global Media & Entertainment Industry Theme & Amusement Parks 2% Source- PWC Report Movies 7% TV- Networks & Dist 32% Music 3% Radio & OOH 7% Gaming 3% Sports Entertainment Business Info. 7% Print 21% Casinos 10% 8% % Share
- 6. Top M&E markets Nation USD Billion 1 USA 503 2 Japan 186 3 China 120 4 Germany 96 5 UK 82 6 France 72 7 Italy 45 8 Canada 42.6 9 Brazil 42.2 10 South Korea 37 11 Australia 35 12 Spain 28 India 12.6 Source: PWC Report
- 7. Indian Advertising Industry Revenue (INR billion) Segment 2012 2017(P) CAGR TV 125 240 14% Print 150 248 10.6% Radio 13 27 16.6% OOH 18 27 8.4% Digital Advertising 22 87 32% Total 328 629 14% Source: KPMG FICCI REPORT - 2013
- 8. Indian Advertising Industry Revenue Advt. Revenue - 2012 TV 38% Print 46% Digital 7% Radio 4% OOH 5% TV 38% Radio 4% Advt. Revenue - Digita l 14% Print 40% 2017 OOH 4%
- 10. Advertising v/s Pay Revenues for Indian M&E industry Segment Advertising Pay Print 79 % 21 % TV 43 % 57 % Film 1 % 99 % Internet 27 % 73 % Music & Home Video - 100 % OOH 100 % - Radio 100% - Total 40% 60% Source-The Indian Media Business – Vanita Kohli, Khandekar
- 11. TOP 10 COUNTRIES WITH HIGHEST INTERNET USERS # Country Population (Crs) Internet Users (Crs) Penetration (% Population) Users % World 1 China 134 54 40 % 22% 2 United States 31 25 78 % 10% 3 India 120 14 11 % 6 % 4 Japan 13 10 79 % 4 % 5 Brazil 19 8.9 46 % 4 % 6 Russia 14 6.8 48 % 3 % 7 Germany 8 6.7 83 % 3 % 8 Indonesia 25 5.5 22 % 2 % 9 United Kingdom 6.3 5.3 83 % 2 % 10 France 6.5 5.2 80 % 2 % Source: www.internetworldstats.com
- 12. Common Terms used in MEA sector Content ARPU (Avg. Revenue Per User) Subscriber base Cable Digitization (DAS) Viewership TRP (TAM rating) GRP (TAM rating) Circulation v/s readership (IRS / NRS / ABC ratings) Subscriber base Listenership Sq. Cm rate TVC (Television Commercial) Spot rate / air-time rate Traditional Media (Print, Television, Films) New Media (Internet, Mobiles, Gaming)
- 13. Key figures about Indian M&E industry 14.6 crs TV households 73 crs TV viewers. 12 crs Cable & Satellite (C&S) households 623 channels 82,000 news papers 30-35 crs newspaper readers 13.7 crs internet users 15.9 crs radio listeners 1000 Indian films released every year
- 14. Key figs about Indian M&E industry Mission Impossible: Ghost Protocol and The Adventures Of Tintin: The Secret Of The Unicorn released in India before they did in the U.S. Digital sales of music contributes 42% of total revenues of the music industry in India and its share will be almost 80% by 2015 77 crs mobile phones , 55 crs active mobile subscribers and 8 crs mobile internet users More than 35 million Indians are logged on to some kind of social network India has the 2nd highest number of Facebook users and 3rd highest number of internet users.
- 15. Key figures about Indian M&E industry Average time spent watching television is 2.55 hrs / day. One of the highest in the world. Advertising spends across all media to cross Rs 629 billion by 2017 40 million DTH households 107 million copies of newspapers circulated daily accounting for than 20% of all dailies in the world. Indian film industry is pegged at 112 billion INR and produces more movies than Hollywood every year 4 billion movie tickets sold across 12,500 screens
- 16. The India Story 80% cinema screens are now digitized and 100% will be digitized by 2015. 1000 Crs Box-Office mark not far DAS for TV digitization; Phase-1 completed in 4 metros and Phase –II in 38 cities under process. Govt. has announced new Radio licensees in 294 cities India is still largely a traditional media market with new media co-existing as an add-on distribution platform Regional Markets remain key centers of growth across print, TV and films. India is a language driven market due to increasing literacy in regional languages. Revenue models still advertising dependent as compared to global standards and hence susceptible to economic downturns. Piracy and transparency across value chain a concern Indian content being consumed worldwide albeit gradually eg: Zee TV in 169 countries, Chennai Express released in 35 countries
- 17. Can India reach the Un-Reached !!! How to segment a diverse audience base and create customized content for each segment to ensure relevance with-out losing economies of scale ? Is there possibility of further zoning/ going hyper-local to create localized content? How do we engage the multi-tasking youth of today who experiences content on varied distribution platforms but forms a low ARPU segment ? How to leverage increasing penetration of mobile phones and increased band-width connectivity through 3G/4G technology? How to create content which has a global appeal for international markets?
- 18. Major Companies Print Bennett Coleman & Co (The Times of India) HT Media (Hindustan Times) Telegraph (ABP group) Dainik Bhaskar Dainik Jagran Deccan Herald Deccan Chronicle Gujarat Samachar Rajasthan Patrika Navbharat Times MaharashtraTimes
- 19. TV Colors ( Viacom 18 Group) MTV (Viacom 18 Group) Star TV ABP News Zee Group Sony (Multi Screen Media & Sony Group) SAB TV Life OK UTV (Movies/Bindaas/Action) Disney (Walt Disney Group) Cartoon Network (Turner Broadcasting/Time Warner) ESPN (Walt Disney Group) Ten Sports (Zee Group) ETV (Eanadu Group) Discovery Nat Geo Fox Traveler
- 20. Film Entertainment Disney UTV Eros Entertainment Reliance Big Entertainment Yashraj Films Viacom 18 Fox Star Studios Sony Pictures Entertainment Warner Bros PVR Inox Shemaroo Entertainment Aamir Khan Productions Red Chillies Entertainment Dharma Production Vidhu Vinod Chopra Films Vishesh Films
- 21. Music & Home Video Saregama (RPG Group) BIG Music,Home Video & Games (Reliance Entertainment) Moser Baer Entertainment Ltd Shemaroo Entertainment Ltd Eros Yashraj Films T-Series
- 22. Gaming (PC /Console) Microsoft Sony Electronic Arts Activision Nintendo Take 2 Sega Ubisoft Vivendi Indian Licensees • Milestone Interactive •BIG Music, Home Video & Games • WWE CD-ROMs
- 23. Gaming (Mobile/On-line) Indiagames (UTV) Dhruva Interactive Trine Games Mauj Mobile2win Ibibo Zapak Hungama
- 24. Animation/VFX/Post Production Toonz Animation Pentamedia Graphics UTV Toons Crest Animation Prime Focus Tata Elxsi Shemaroo Entertainment BIG Animation
- 25. Radio Radio Mirchi (Times Group) Fever 104 (HT Media) Big 92.7 (Reliance Entertainment) Radio City Red FM
- 26. OOH Lakshya Bright Outdoor BIG Street OOH Digital Media Co. TDI Times OOH
- 27. Digital Advertising Google-adwords Facebook Rediff Yahoo
- 28. DTH players Tata Sky (Tata + Sky Broadcasting) Dish (Zee Group) Airtel BIG TV Videocon D2H
- 29. Value Chain Presence Indian Company/ Group Film Prod / Dist. Music /Home Video Label Film Exhibition Content Aggregation Retail Stores Gaming On-line Satellite Channel Print Radio Theme Parks Times Group UTV Eros Network 18 Reliance (ADAG) Yashraj Films Shemaroo Moser Baer PVR RPG Group HT Media Hungama Mobile / Mauj Zee Group
- 30. Value Chain Presence International Company/Group Film Production Theatrical Distribution Music/ Home Video Label Gaming Film Exhibition Theme Parks Merchandise TV Production / Channel Warner Bros. Disney 20th Century Fox Sony (Entertainment Div) Viacom Universal Studios Fox Star Studios Wanda/AMC
- 31. Key Trends Digital technology continues to revolutionalise media distribution Media on the go- Proliferation of New age Media Devices Regional Markets becoming increasingly attractive Digital advertising offers cost effective targeted advertising options to advertisers M&E industry still dependent largely on advertising revenues due to low ARPU (Average Revenue Per User)