1 q 2016-us-tile-industry-update
•
1 gefällt mir•123 views

1 q 2016-us-tile-industry-update

Empfohlen
Empfohlen
Weitere ähnliche Inhalte
Andere mochten auch
Andere mochten auch (20)
Ähnlich wie 1 q 2016-us-tile-industry-update
Ähnlich wie 1 q 2016-us-tile-industry-update (20)
Kürzlich hochgeladen
Kürzlich hochgeladen (20)
1 q 2016-us-tile-industry-update
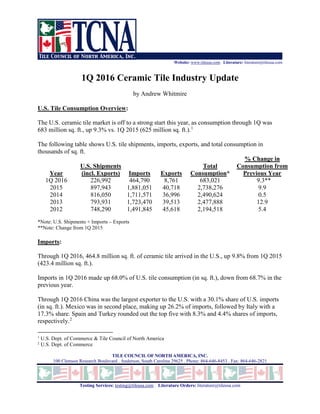
- 1. Website: www.tileusa.com . Literature: literature@tileusa.com TILE COUNCIL OF NORTH AMERICA, INC. 100 Clemson Research Boulevard . Anderson, South Carolina 29625 . Phone: 864-646-8453 . Fax: 864-646-2821 Testing Services: testing@tileusa.com . Literature Orders: literature@tileusa.com 1Q 2016 Ceramic Tile Industry Update by Andrew Whitmire U.S. Tile Consumption Overview: The U.S. ceramic tile market is off to a strong start this year, as consumption through 1Q was 683 million sq. ft., up 9.3% vs. 1Q 2015 (625 million sq. ft.).1 The following table shows U.S. tile shipments, imports, exports, and total consumption in thousands of sq. ft. Year U.S. Shipments (incl. Exports) Imports Exports Total Consumption* % Change in Consumption from Previous Year 1Q 2016 226,992 464,790 8,761 683,021 9.3** 2015 897,943 1,881,051 40,718 2,738,276 9.9 2014 816,050 1,711,571 36,996 2,490,624 0.5 2013 793,931 1,723,470 39,513 2,477,888 12.9 2012 748,290 1,491,845 45,618 2,194,518 5.4 *Note: U.S. Shipments + Imports – Exports **Note: Change from 1Q 2015 Imports: Through 1Q 2016, 464.8 million sq. ft. of ceramic tile arrived in the U.S., up 9.8% from 1Q 2015 (423.4 million sq. ft.). Imports in 1Q 2016 made up 68.0% of U.S. tile consumption (in sq. ft.), down from 68.7% in the previous year. Through 1Q 2016 China was the largest exporter to the U.S. with a 30.1% share of U.S. imports (in sq. ft.). Mexico was in second place, making up 26.2% of imports, followed by Italy with a 17.3% share. Spain and Turkey rounded out the top five with 8.3% and 4.4% shares of imports, respectively.2 1 U.S. Dept. of Commerce & Tile Council of North America 2 U.S. Dept. of Commerce
- 2. Website: www.tileusa.com . Literature: literature@tileusa.com TILE COUNCIL OF NORTH AMERICA, INC. 100 Clemson Research Boulevard . Anderson, South Carolina 29625 . Phone: 864-646-8453 . Fax: 864-646-2821 Testing Services: testing@tileusa.com . Literature Orders: literature@tileusa.com The five countries from which the most tiles were imported in 1Q 2016 based on sq. ft. were: Country Sq. Ft. 1Q 2016 YTD Sq. Ft. 1Q 2015 YTD 2016/2015 % Change 2015/2014 % Change China 139,859,987 140,970,360 -0.8% 12.4% Mexico 121,768,846 124,262,080 -2.0% 2.5% Italy 80,477,194 65,493,099 22.9% 2.7% Spain 38,506,759 24,821,513 55.1% 16.9% Turkey 20,670,174 16,086,201 28.5% -8.0%
- 3. Website: www.tileusa.com . Literature: literature@tileusa.com TILE COUNCIL OF NORTH AMERICA, INC. 100 Clemson Research Boulevard . Anderson, South Carolina 29625 . Phone: 864-646-8453 . Fax: 864-646-2821 Testing Services: testing@tileusa.com . Literature Orders: literature@tileusa.com Italy remained the largest exporter to the U.S. on a dollar basis (1Q 2016), comprising 32.5% of U.S. imports. China was second with a 26.7% share, and Mexico was third with a 14.5% share. The five countries from which the most tiles were imported in 1Q 2016 based on total U.S. $ value (including duty, freight, and insurance) were: Country Total Val 1Q 2016 YTD (in $) Total Val 1Q 2015 YTD (in $) 2016/2015 % Change 2015/2014 % Change Italy 157,571,105 139,438,316 13.0% 7.4% China 129,805,504 134,843,326 -3.7% 19.8% Mexico 70,603,216 72,400,875 -2.5% 1.8% Spain 52,964,224 37,767,530 40.2% 17.0% Turkey 23,966,062 17,667,848 35.6% -3.3% All Countries 485,269,362 444,270,706 9.2% 10.8% The average values of tile3 (including duty, freight, and insurance) from the five countries (based on sq. ft.) from which the most tiles were imported in 1Q 2016 were: Country Sq. Ft. 1Q 2016 Tot Val 1Q 2016 (in $) Val/Sq. Ft. 1Q 2016 Val/Sq. Ft. 1Q 2015 Val/Sq. Ft. 1Q 2014 China 139,859,987 129,805,504 $0.93 $0.96 $0.90 Mexico 121,768,846 70,603,216 $0.58 $0.58 $0.59 Italy 80,477,194 157,571,105 $1.96 $2.13 $2.04 Spain 38,506,759 52,964,224 $1.38 $1.52 $1.52 Turkey 20,670,174 23,966,062 $1.16 $1.10 $1.05 All Countries 464,789,548 485,269,362 $1.04 $1.05 $1.02 U.S. Shipments: U.S. shipments (less exports) in 1Q 2016 rose 8.4% in sq. ft. and 9.3% in $ value vs. 1Q 2015. The $ value/sq. ft. of U.S. shipments (less exports) in 1Q 2016 was $1.48, up from $1.46 in 1Q 2015. 3 The average value is significantly affected by the mix of tiles imported, with different types of tiles impacting the average value, in addition to differences in pricing for the same types of tile.
- 4. Website: www.tileusa.com . Literature: literature@tileusa.com TILE COUNCIL OF NORTH AMERICA, INC. 100 Clemson Research Boulevard . Anderson, South Carolina 29625 . Phone: 864-646-8453 . Fax: 864-646-2821 Testing Services: testing@tileusa.com . Literature Orders: literature@tileusa.com U.S. produced tile comprised 32.0% of the U.S. ceramic tile market (in sq. ft.) and 39.9% by $ value, by far the largest in both categories.4 Exports: U.S. ceramic tile exports in 1Q 2016 were 8.8 million sq. ft., down 14.6% from 1Q 2015. The vast majority of these exports (in sq. ft.) were to Canada (74.7%) and Mexico (9.6%).5 Economic Highlights: • The government’s revised 1Q 2016 estimate of the change in real GDP was 1.1%, a decrease of 0.3 percentage points from the change seen in 4Q 2015.6 • May 2016 new home starts were at a seasonally-adjusted annual rate of 1,164,000 units, a 9.5% increase from May 2015.7 • May 2016 new one-family home sales were at a seasonally-adjusted annual rate of 551,000 units, an 8.7% increase from May 2015.8 • May 2016 existing single family home sales were at a seasonally-adjusted annual rate of 4.90 million units, up 4.7% from May 2015.9 • There were 101,000 foreclosure filings on U.S. properties in May 2016, down 20.5% from May 2015.10 • The 30-year fixed mortgage rate in May 2016 was 3.60%, down from 3.84% in May 2015.11 • The U.S. unemployment rate was 4.7% in May 2016, down from 5.5% one year ago (May 2015).12 4 Tile Council of North America 5 U.S. Dept. of Commerce 6 Bureau of Economic Analysis 7 U.S. Census Bureau 8 U.S. Census Bureau 9 National Association of Realtors 10 RealtyTrac 11 Freddie Mac 12 Bureau of Labor Statistics
- 5. Website: www.tileusa.com . Literature: literature@tileusa.com TILE COUNCIL OF NORTH AMERICA, INC. 100 Clemson Research Boulevard . Anderson, South Carolina 29625 . Phone: 864-646-8453 . Fax: 864-646-2821 Testing Services: testing@tileusa.com . Literature Orders: literature@tileusa.com
- 6. Website: www.tileusa.com . Literature: literature@tileusa.com TILE COUNCIL OF NORTH AMERICA, INC. 100 Clemson Research Boulevard . Anderson, South Carolina 29625 . Phone: 864-646-8453 . Fax: 864-646-2821 Testing Services: testing@tileusa.com . Literature Orders: literature@tileusa.com
- 7. Website: www.tileusa.com . Literature: literature@tileusa.com TILE COUNCIL OF NORTH AMERICA, INC. 100 Clemson Research Boulevard . Anderson, South Carolina 29625 . Phone: 864-646-8453 . Fax: 864-646-2821 Testing Services: testing@tileusa.com . Literature Orders: literature@tileusa.com