SlideShare ist ein Scribd-Unternehmen logo
1 von 1
Strategies for detection of and targeting nanomedical systems to rare circulating
leukemia stem cells in peripheral blood
Christy L. Cooper, M.S.1; James F. Leary, Ph.D.1,2
1College of Veterinary Medicine, Department of Basic Medical Sciences, 2College of Engineering, Weldon School of Biomedical Engineering,
Purdue University, West Lafayette, IN 47907 USA
ABSTRACT
Detection of cells present at rare (<1.0%) frequencies in peripheral
blood, as is the case for leukemia stem cells (LSCs), is challenging due
to the presence of various cell types that are present in high
abundance in peripheral blood. LSC detection is further challenging
because these cells are immunophenotypically similar to hematopoietic
stem/progenitor cells (HSPCs). For this project, we utilized a panel of
five fluorescent antibodies directed toward different cell surface
markers in an attempt to distinguish between LSCs, HSCs, and the
bulk leukemic blast populations present within donor peripheral bloods
spiked with RS4;11 acute lymphoblastic leukemia (ALL) cells. This ex
vivo model system will be used in conjunction with advanced statistical
analyses of defined digital data mixtures to develop
immunophenotyping panels for sensitive, robust minimal residual
disease (MRD) (rare event) detection in whole peripheral blood and for
theragnosis of primitive acute leukemias using nanomedical systems.
Methods
Cell lines were obtained from the American Type Culture Collection
(ATCC) (Manassas, VA). RS4;11 acute lymphoblastic leukemia cells
were cultured in RPMI-1640 medium supplemented to contain
10%fetal bovine serum and were incubated at 37 oC, 5% CO2. Donor
peripheral blood was collected in BD K3/EDTA blood collection tubes
and processed using a Ficoll-Paque gradient to collect peripheral
blood mononuclear cells (PBMNCs). Anti-CD133-PE antibody was
obtained from Miltenyi Biotec (San Diego, CA). Anti-CD 34-BV421,
anti-CD45-APC, anti-CD33-PE-Cy5, and anti-CD24-PerCP-Cy5.5
antibodies were purchased from BD Biosciences (San Jose, CA).
Immunophenotyping
Anti-CD133-PE was used at a dilution of 1:10. All other antibodies
were used at a dilution of 1:4. 105 cells in PBS, 2% FBS were
incubated with antibodies at the indicated dilutions and kept at 4oC for
15 minutes. Flow cytometry was performed using a FACSAria III flow
cytometer/cell sorter (BD Biosciences, San Jose, CA) fitted with a
flow nozzle of 100 micron diameter orifice. . Single color
compensation controls and Fluorescence minus one (FMO) control
samples were also prepared.
Data analysis and statistics
Color compensation and gating of immunophenotyping data were
performed in WinList 6.0 3D (Verity Software House, Topsham, ME)
and further processed in Bioconductor/ R packages flowCore and
flowViz. ROC plots were created using the R package ROCR.
Spectral clustering was performed using Bioconductor / R package
SamSPECTRAL. Other R packages were also utilized for PCA, DFA,
and graphical representations of various data.
Table 1. Lasers and filters used for exciting and collecting the
emission of the various immunophenotyping panel antibodies.
Nanoparticle synthesis
HGC nanoparticles were synthesized by reacting glycol chitosan with
5-beta cholanic acid in 3:1 (v/v) methanol:water overnight. (Key 2012)
HGC-Alexa Fluor 488 was prepared by combining 40mg of
lyophilized HGC with 0.2mg NHS-Alexa Fluor 488 in anhydrous
DMSO. Iron oxide nanocubes, synthesized by thermal decomposition
of iron (III) acetylacetonate in oleic acid/benzyl ether, were loaded into
HGC-Alexa Fluor 488 by probe sonication. HGC-Alexa Fluor 488-
SPIO-anti-CD133 was prepared by adding 25uL of a 1mg/mL HGC-
Alexa Fluor 488 -SPIO solution in water to 5ug of anti-CD133
antibody in 100mM NaH2PO4, 2mM EDTA, pH 8.0. This reaction
proceeded overnight. The product was used as-is in place of or in
addition to anti-CD133-PE antibody in immunophenotyping
experiments.
Figure 3. Schematic
representation of HGC-
SPIO-anti-CD133
nanoconjugate
Dark blue: Glycol
chitosan shell
Green/black spheres
:SPIO in 5β cholanic acid
Green outer spheres
:Alexa Fluor 488
References
1. Leary, J.F, Hokanson, J.A., McLaughlin, S.R. “High Speed Cell Classification Systems for Real-Time Data
Classification and Cell Sorting,” SPIE 2982, 342-352 (1997).
2. Coustan-Smith, E., Campana, D. “Immunologic minimal residual disease detection in acute lymphoblastic
leukemia: A comparative approach to molecular testing,” Best Practice & Research Clinical Haematology
23(3), 347-358 (2010). .
3. Denys, B., van der Sluijs-Gelling, A.J., Homburg, C., van der Schoot, C.E., de Haas, V., Philippe, J.,
Pieters, R. van Dongen, J. J. M. van der Velden, V. H. J. “Improved flow cytometric detection of minimal
residual disease in childhood acute lymphoblastic leukemia,” Leukemia 27(3), 635-641 (2013).
4. Key, Jaehong. Cooper, Christy, Kim, Ah Young , Dhawan, Deepika,. Knapp, Deborah W, Kim,
Kwangmeyung, Park, Jae Hyung, Choi, Kuiwon, Kwon, Ick Chan , Park, Kinam, Leary, James F.,In vivo
NIRF and MR dual-modality imaging using glycol chitosan nanoparticles, Journal of Controlled Release,
163: 249–255 (2012)
5. Zare, H. and Shooshtari, P. and Gupta, A. and Brinkman R.B: Data Reduction for Spectral Clustering to
Analyse High Throughput Flow Cytometry Data. BMC Bioinformatics, 2010, 11:403.
Acknowledgements
The authors would like to acknowledge Jeffrey Woodliff, Ph.D. and Jill Hutchcroft, Ph.D. in the Purdue Cancer Research
Shared Flow Cytometry and Cell Separation Facility supported by grant 5P30-CA023168-33 for their assistance with
scheduling time on the FACSAria III flow cytometer/cell sorter. The authors would also like to thank Lisa Reece for
drawing blood for this work in accordance with IRB protocol 0604003812.
Conclusions
RS4;11 leukemic blasts and the LSC subpopulation thereof could be distinguished from PBMNCs including hematopoietic
stem/progenitors using a combination of fluorescent antibodies toward five cell surface markers. ROC curves indicated that
the most selective positive distinguishing marker was CD133. CD24 was also suitable positive selection markers while
CD45 proved to be a suitable negative selection marker. The ROC curves, shown here for individual markers, will be
repeated using statistical algorithms for constructing multiparametric ROC plots. These multiparametric plots will inform the
selection of new diagnostic markers using an iterative process. Cluster IDs output from spectral clustering algorithms
including SamSPECTRAL will be used to develop a classification scheme for improved diagnostics of acute leukemias and
to inform the development of targeted therapies that will eradicate leukemia cell subpopulations including rare LSC
populations while sparing normal, healthy hematopoietic stem / progenitor cells.
Figure 2. Schematic of the immunophenotypes of RS4;11 pro-B acute
lymphoblastic leukemia cell line and PBMNC populations.
Receiver operator characteristic (ROC) curves measure the true positive
vs. false positive rate for a given diagnostic marker or test.
Principal components analysis (PCA) and linear discriminant analysis
(LDA) are used for both unsupervised dimensional reduction and for
distinguishing between multiple groups of data via selection of the
appropriate number of variables (or components) to retain for
classification (PCA) and for measuring classifier performance while
maximizing separation between the studied data groupings (DFA). For
this research, we employed a density-based spectral clustering method
with faithful sampling and clustering via a modified Markov clustering
algorithm. This method is implemented in the Bioconductor/R package
SamSPECTRAL (Zare 2010) and was selected because it saves time
computationally with its faithful sampling method and because it is
capable of finding clusters of rare (<2%) numbers of events.
Figure 4. Two parameter histograms (“dot plots”) of RS4;11 blasts (left) and PBMNCs (right).
CD133 v. CD33
CD133 v. CD34
CD133 v. CD24
CD133 v. CD45
ROC analysis on digital defined data mixtures of PBMNC and RS4;11 cells’
immunophenotyping data indicated that the order of specificity of the markers
(antibodies) was, from best to worst performance: CD133 > CD24 > CD34
>CD33 > CD45.
Marker(Ab) AUC
(Area under curve)
CD24 0.9188
CD33 0.4885
CD34 0.5020
CD45 0.1933
CD133 0.9994
Bioinformatics Approach
Experiment
Design
Data collection
Gate populations
Color compensate
Arcsinh transform
Combine/subset
Statistical
Analysis
Data
transformation
Cluster analysis
Data mining
ROC curves
Flow cytometry
Cytotoxicity and
cell targeting
studies
Purple: CD133
Green: CD24
Orange: CD34
Blue: CD33
Red: CD45
RS4;11 PBMNCs (“normal”)
Fig 7 Representative 3D PCA plots colored according to cell type (A,C) and by SamSPECTRAL cluster
assignment (B,D). PCA appears to separate clusters from each other, but lacks ability to clearly define rare
populations when cell types are used for PCA analysis..
Figure 1. Workflow for disease
classification using flow
cytometry and bioinformatics
tools with therapeutic targeting
to diseased cells.
Results: Immunophenotyping
Results: Marker Sensitivity and Specificity
Figure 5. ROC curves
and AUC values for
immunophenotyping
panel antibodies
PBMNCs: black
RS4;11: red
A B
C D
Fig 8 Representative 3D DFA plots colored according to SamSPECTRAL cluster assignment (A-C) and by cell
type (D). DFA identifies PBMNC clusters and RS4;11 clusters well but does not well resolve clusters in digital
data mixtures of the combined PBMNC and RS4;11 data as would be observed clinically in leukemia patients..
PBMNCs: black
RS4;11: red
PBMNC
only
RS4;11
only
PBMNC and RS4;11
combined
Results: Dimensionality Reduction and Classification
PBMNCs: black
RS4;11: red
Cell Type Mean LD1 Standard deviation LD1 Sample size
PBMNC -5.795301 0.9863204 89752
RS4;11 6.160970 1.0143405 84425
Allocated to PBMNC Allocated to RS4;11
Is PBMNC 89591 161*
Is RS4;11 376* 84049
Classification Rules
1. If MeanLD1 for a given cell < the average mean for the two
cell types, assign that cell to be a normal PBMNC.
2. If MeanLD1 for a given cell is > the average mean for the two
cell types, assign that cell to be an RS4;11 lymphoblast.
Misclassification rate
(total number of misclassified cells/ total number of cells) * 100 = 0.31%
The overall misclassification rate is 0.31%.
:* : Misclassified cells
RS4;11
PBMNC
Figure 9. Histograms of LD1 values corresponding to
PBMNCs (group 1) and RS4;11 blasts (group 2).
Decision boundary= 0.185
Populations overlap in this
region at low frequencies.
Truepositiverate(Sensitivity)
False positive rate (1-Specificity)

Weitere ähnliche Inhalte

Was ist angesagt?

Custom AmpliSeq™ Panels for Inherited Disease Research from Optimized, Invent...
Custom AmpliSeq™ Panels for Inherited Disease Research from Optimized, Invent...Custom AmpliSeq™ Panels for Inherited Disease Research from Optimized, Invent...
Custom AmpliSeq™ Panels for Inherited Disease Research from Optimized, Invent...Thermo Fisher Scientific
 
Antinuclear antobdy testing
Antinuclear antobdy testingAntinuclear antobdy testing
Antinuclear antobdy testingLAB IDEA
 
Insights into the tumor microenvironment and therapeutic T cell manufacture r...
Insights into the tumor microenvironment and therapeutic T cell manufacture r...Insights into the tumor microenvironment and therapeutic T cell manufacture r...
Insights into the tumor microenvironment and therapeutic T cell manufacture r...Thermo Fisher Scientific
 
tri insti poster
tri insti postertri insti poster
tri insti postermtchin08
 
Widespread human T cell receptor beta variable gene polymorphism: implication...
Widespread human T cell receptor beta variable gene polymorphism: implication...Widespread human T cell receptor beta variable gene polymorphism: implication...
Widespread human T cell receptor beta variable gene polymorphism: implication...Thermo Fisher Scientific
 
FabioAmaralProject 3
FabioAmaralProject 3FabioAmaralProject 3
FabioAmaralProject 3Fabio Amaral
 
Improved sensitivit
Improved sensitivitImproved sensitivit
Improved sensitivitt7260678
 
NF2 frequency of mosaicism
NF2 frequency of mosaicismNF2 frequency of mosaicism
NF2 frequency of mosaicismBianca Heinrich
 
Tumor Mutational Load assessment of FFPE samples using an NGS based assay
Tumor Mutational Load assessment of FFPE samples using an NGS based assayTumor Mutational Load assessment of FFPE samples using an NGS based assay
Tumor Mutational Load assessment of FFPE samples using an NGS based assayThermo Fisher Scientific
 
Medical review of medolife’s escozine tm technology in pre clinical &amp; cli...
Medical review of medolife’s escozine tm technology in pre clinical &amp; cli...Medical review of medolife’s escozine tm technology in pre clinical &amp; cli...
Medical review of medolife’s escozine tm technology in pre clinical &amp; cli...PetLife Pharmaceuticals Inc
 
A computational framework for large-scale analysis of TCRβ immune repertoire ...
A computational framework for large-scale analysis of TCRβ immune repertoire ...A computational framework for large-scale analysis of TCRβ immune repertoire ...
A computational framework for large-scale analysis of TCRβ immune repertoire ...Thermo Fisher Scientific
 
Sergio Querol - Advances in UCBT: UCB Banking, Making the Most of Cord Blood
Sergio Querol - Advances in UCBT: UCB Banking, Making the Most of Cord BloodSergio Querol - Advances in UCBT: UCB Banking, Making the Most of Cord Blood
Sergio Querol - Advances in UCBT: UCB Banking, Making the Most of Cord BloodSingapore Society for Haematology
 
Oncomine Cancer Research Panel (OCP) | ESHG 2015 Poster PS12.131
Oncomine Cancer Research Panel (OCP) | ESHG 2015 Poster PS12.131Oncomine Cancer Research Panel (OCP) | ESHG 2015 Poster PS12.131
Oncomine Cancer Research Panel (OCP) | ESHG 2015 Poster PS12.131Thermo Fisher Scientific
 

Was ist angesagt? (18)

nature
naturenature
nature
 
Custom AmpliSeq™ Panels for Inherited Disease Research from Optimized, Invent...
Custom AmpliSeq™ Panels for Inherited Disease Research from Optimized, Invent...Custom AmpliSeq™ Panels for Inherited Disease Research from Optimized, Invent...
Custom AmpliSeq™ Panels for Inherited Disease Research from Optimized, Invent...
 
Antinuclear antobdy testing
Antinuclear antobdy testingAntinuclear antobdy testing
Antinuclear antobdy testing
 
Insights into the tumor microenvironment and therapeutic T cell manufacture r...
Insights into the tumor microenvironment and therapeutic T cell manufacture r...Insights into the tumor microenvironment and therapeutic T cell manufacture r...
Insights into the tumor microenvironment and therapeutic T cell manufacture r...
 
tri insti poster
tri insti postertri insti poster
tri insti poster
 
Widespread human T cell receptor beta variable gene polymorphism: implication...
Widespread human T cell receptor beta variable gene polymorphism: implication...Widespread human T cell receptor beta variable gene polymorphism: implication...
Widespread human T cell receptor beta variable gene polymorphism: implication...
 
FabioAmaralProject 3
FabioAmaralProject 3FabioAmaralProject 3
FabioAmaralProject 3
 
MCR_Article_JW
MCR_Article_JWMCR_Article_JW
MCR_Article_JW
 
Improved sensitivit
Improved sensitivitImproved sensitivit
Improved sensitivit
 
NF2 frequency of mosaicism
NF2 frequency of mosaicismNF2 frequency of mosaicism
NF2 frequency of mosaicism
 
Tumor Mutational Load assessment of FFPE samples using an NGS based assay
Tumor Mutational Load assessment of FFPE samples using an NGS based assayTumor Mutational Load assessment of FFPE samples using an NGS based assay
Tumor Mutational Load assessment of FFPE samples using an NGS based assay
 
Medical review of medolife’s escozine tm technology in pre clinical &amp; cli...
Medical review of medolife’s escozine tm technology in pre clinical &amp; cli...Medical review of medolife’s escozine tm technology in pre clinical &amp; cli...
Medical review of medolife’s escozine tm technology in pre clinical &amp; cli...
 
A computational framework for large-scale analysis of TCRβ immune repertoire ...
A computational framework for large-scale analysis of TCRβ immune repertoire ...A computational framework for large-scale analysis of TCRβ immune repertoire ...
A computational framework for large-scale analysis of TCRβ immune repertoire ...
 
508 search for genomic and proteomic risk factors and protective factors asso...
508 search for genomic and proteomic risk factors and protective factors asso...508 search for genomic and proteomic risk factors and protective factors asso...
508 search for genomic and proteomic risk factors and protective factors asso...
 
Qpcr
QpcrQpcr
Qpcr
 
PlOSone paper
PlOSone paperPlOSone paper
PlOSone paper
 
Sergio Querol - Advances in UCBT: UCB Banking, Making the Most of Cord Blood
Sergio Querol - Advances in UCBT: UCB Banking, Making the Most of Cord BloodSergio Querol - Advances in UCBT: UCB Banking, Making the Most of Cord Blood
Sergio Querol - Advances in UCBT: UCB Banking, Making the Most of Cord Blood
 
Oncomine Cancer Research Panel (OCP) | ESHG 2015 Poster PS12.131
Oncomine Cancer Research Panel (OCP) | ESHG 2015 Poster PS12.131Oncomine Cancer Research Panel (OCP) | ESHG 2015 Poster PS12.131
Oncomine Cancer Research Panel (OCP) | ESHG 2015 Poster PS12.131
 

Ähnlich wie Purdue cancer center retreat poster Christy Cooper 12062014FINAL

Qualitative Flow Cytometric Analysis of Malaysian
Qualitative Flow Cytometric Analysis of MalaysianQualitative Flow Cytometric Analysis of Malaysian
Qualitative Flow Cytometric Analysis of MalaysianMohadese Hashem Boroojerdi
 
Poster at EMBL: Diagnosis and monitoring of Leptomeningeal Disease using Circ...
Poster at EMBL: Diagnosis and monitoring of Leptomeningeal Disease using Circ...Poster at EMBL: Diagnosis and monitoring of Leptomeningeal Disease using Circ...
Poster at EMBL: Diagnosis and monitoring of Leptomeningeal Disease using Circ...Ronak Shah
 
Detecting clinically actionable somatic structural aberrations from targeted ...
Detecting clinically actionable somatic structural aberrations from targeted ...Detecting clinically actionable somatic structural aberrations from targeted ...
Detecting clinically actionable somatic structural aberrations from targeted ...Ronak Shah
 
Flowcytometry
FlowcytometryFlowcytometry
FlowcytometryBadheeb
 
115 genomic and proteomic screen
115 genomic and proteomic screen115 genomic and proteomic screen
115 genomic and proteomic screenSHAPE Society
 
Acc 2002 microarray mehran for print
Acc 2002 microarray mehran for printAcc 2002 microarray mehran for print
Acc 2002 microarray mehran for printSHAPE Society
 
Reference for long range pcr based ngs applications
Reference for long range pcr based ngs applicationsReference for long range pcr based ngs applications
Reference for long range pcr based ngs applicationsssuser1e2788
 
Rohan gupta 2015 b1ab651p facs
Rohan gupta 2015 b1ab651p   facsRohan gupta 2015 b1ab651p   facs
Rohan gupta 2015 b1ab651p facsRohan Gupta
 
Global Gene Expression Profiles from Breast Tumor Samples using the Ion Ampli...
Global Gene Expression Profiles from Breast Tumor Samples using the Ion Ampli...Global Gene Expression Profiles from Breast Tumor Samples using the Ion Ampli...
Global Gene Expression Profiles from Breast Tumor Samples using the Ion Ampli...Thermo Fisher Scientific
 
DNA Amplification is a Ubiquitous Mechanism of Oncogene Activation in Lung an...
DNA Amplification is a Ubiquitous Mechanism of Oncogene Activation in Lung an...DNA Amplification is a Ubiquitous Mechanism of Oncogene Activation in Lung an...
DNA Amplification is a Ubiquitous Mechanism of Oncogene Activation in Lung an...Shryli Shreekar
 
Analytical chemistry 2013 qian liu
Analytical chemistry 2013 qian liuAnalytical chemistry 2013 qian liu
Analytical chemistry 2013 qian liuQian Liu, phD
 
Cd34_cord_blood_paper[1]
Cd34_cord_blood_paper[1]Cd34_cord_blood_paper[1]
Cd34_cord_blood_paper[1]Bill Martinez
 

Ähnlich wie Purdue cancer center retreat poster Christy Cooper 12062014FINAL (20)

Qualitative Flow Cytometric Analysis of Malaysian
Qualitative Flow Cytometric Analysis of MalaysianQualitative Flow Cytometric Analysis of Malaysian
Qualitative Flow Cytometric Analysis of Malaysian
 
Poster at EMBL: Diagnosis and monitoring of Leptomeningeal Disease using Circ...
Poster at EMBL: Diagnosis and monitoring of Leptomeningeal Disease using Circ...Poster at EMBL: Diagnosis and monitoring of Leptomeningeal Disease using Circ...
Poster at EMBL: Diagnosis and monitoring of Leptomeningeal Disease using Circ...
 
Dna microarray mehran- u of toronto
Dna microarray  mehran- u of torontoDna microarray  mehran- u of toronto
Dna microarray mehran- u of toronto
 
Detecting clinically actionable somatic structural aberrations from targeted ...
Detecting clinically actionable somatic structural aberrations from targeted ...Detecting clinically actionable somatic structural aberrations from targeted ...
Detecting clinically actionable somatic structural aberrations from targeted ...
 
P1-01-17_poster
P1-01-17_posterP1-01-17_poster
P1-01-17_poster
 
Flowcytometry
FlowcytometryFlowcytometry
Flowcytometry
 
115 genomic and proteomic screen
115 genomic and proteomic screen115 genomic and proteomic screen
115 genomic and proteomic screen
 
Genomic and proteomic screen
Genomic and proteomic screenGenomic and proteomic screen
Genomic and proteomic screen
 
Acc 2002 microarray mehran for print
Acc 2002 microarray mehran for printAcc 2002 microarray mehran for print
Acc 2002 microarray mehran for print
 
Acc 2002 microarray mehran for print
Acc 2002 microarray mehran for printAcc 2002 microarray mehran for print
Acc 2002 microarray mehran for print
 
115 genomic and proteomic screen
115 genomic and proteomic screen115 genomic and proteomic screen
115 genomic and proteomic screen
 
Reference for long range pcr based ngs applications
Reference for long range pcr based ngs applicationsReference for long range pcr based ngs applications
Reference for long range pcr based ngs applications
 
Lymphoma
LymphomaLymphoma
Lymphoma
 
Rohan gupta 2015 b1ab651p facs
Rohan gupta 2015 b1ab651p   facsRohan gupta 2015 b1ab651p   facs
Rohan gupta 2015 b1ab651p facs
 
Global Gene Expression Profiles from Breast Tumor Samples using the Ion Ampli...
Global Gene Expression Profiles from Breast Tumor Samples using the Ion Ampli...Global Gene Expression Profiles from Breast Tumor Samples using the Ion Ampli...
Global Gene Expression Profiles from Breast Tumor Samples using the Ion Ampli...
 
DNA Amplification is a Ubiquitous Mechanism of Oncogene Activation in Lung an...
DNA Amplification is a Ubiquitous Mechanism of Oncogene Activation in Lung an...DNA Amplification is a Ubiquitous Mechanism of Oncogene Activation in Lung an...
DNA Amplification is a Ubiquitous Mechanism of Oncogene Activation in Lung an...
 
Analytical chemistry 2013 qian liu
Analytical chemistry 2013 qian liuAnalytical chemistry 2013 qian liu
Analytical chemistry 2013 qian liu
 
Cd34_cord_blood_paper[1]
Cd34_cord_blood_paper[1]Cd34_cord_blood_paper[1]
Cd34_cord_blood_paper[1]
 
Biomed central
Biomed centralBiomed central
Biomed central
 
Flow cytometry
Flow cytometryFlow cytometry
Flow cytometry
 

Purdue cancer center retreat poster Christy Cooper 12062014FINAL

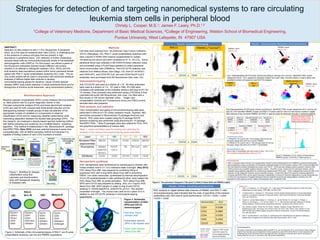
  • 1. Strategies for detection of and targeting nanomedical systems to rare circulating leukemia stem cells in peripheral blood Christy L. Cooper, M.S.1; James F. Leary, Ph.D.1,2 1College of Veterinary Medicine, Department of Basic Medical Sciences, 2College of Engineering, Weldon School of Biomedical Engineering, Purdue University, West Lafayette, IN 47907 USA ABSTRACT Detection of cells present at rare (<1.0%) frequencies in peripheral blood, as is the case for leukemia stem cells (LSCs), is challenging due to the presence of various cell types that are present in high abundance in peripheral blood. LSC detection is further challenging because these cells are immunophenotypically similar to hematopoietic stem/progenitor cells (HSPCs). For this project, we utilized a panel of five fluorescent antibodies directed toward different cell surface markers in an attempt to distinguish between LSCs, HSCs, and the bulk leukemic blast populations present within donor peripheral bloods spiked with RS4;11 acute lymphoblastic leukemia (ALL) cells. This ex vivo model system will be used in conjunction with advanced statistical analyses of defined digital data mixtures to develop immunophenotyping panels for sensitive, robust minimal residual disease (MRD) (rare event) detection in whole peripheral blood and for theragnosis of primitive acute leukemias using nanomedical systems. Methods Cell lines were obtained from the American Type Culture Collection (ATCC) (Manassas, VA). RS4;11 acute lymphoblastic leukemia cells were cultured in RPMI-1640 medium supplemented to contain 10%fetal bovine serum and were incubated at 37 oC, 5% CO2. Donor peripheral blood was collected in BD K3/EDTA blood collection tubes and processed using a Ficoll-Paque gradient to collect peripheral blood mononuclear cells (PBMNCs). Anti-CD133-PE antibody was obtained from Miltenyi Biotec (San Diego, CA). Anti-CD 34-BV421, anti-CD45-APC, anti-CD33-PE-Cy5, and anti-CD24-PerCP-Cy5.5 antibodies were purchased from BD Biosciences (San Jose, CA). Immunophenotyping Anti-CD133-PE was used at a dilution of 1:10. All other antibodies were used at a dilution of 1:4. 105 cells in PBS, 2% FBS were incubated with antibodies at the indicated dilutions and kept at 4oC for 15 minutes. Flow cytometry was performed using a FACSAria III flow cytometer/cell sorter (BD Biosciences, San Jose, CA) fitted with a flow nozzle of 100 micron diameter orifice. . Single color compensation controls and Fluorescence minus one (FMO) control samples were also prepared. Data analysis and statistics Color compensation and gating of immunophenotyping data were performed in WinList 6.0 3D (Verity Software House, Topsham, ME) and further processed in Bioconductor/ R packages flowCore and flowViz. ROC plots were created using the R package ROCR. Spectral clustering was performed using Bioconductor / R package SamSPECTRAL. Other R packages were also utilized for PCA, DFA, and graphical representations of various data. Table 1. Lasers and filters used for exciting and collecting the emission of the various immunophenotyping panel antibodies. Nanoparticle synthesis HGC nanoparticles were synthesized by reacting glycol chitosan with 5-beta cholanic acid in 3:1 (v/v) methanol:water overnight. (Key 2012) HGC-Alexa Fluor 488 was prepared by combining 40mg of lyophilized HGC with 0.2mg NHS-Alexa Fluor 488 in anhydrous DMSO. Iron oxide nanocubes, synthesized by thermal decomposition of iron (III) acetylacetonate in oleic acid/benzyl ether, were loaded into HGC-Alexa Fluor 488 by probe sonication. HGC-Alexa Fluor 488- SPIO-anti-CD133 was prepared by adding 25uL of a 1mg/mL HGC- Alexa Fluor 488 -SPIO solution in water to 5ug of anti-CD133 antibody in 100mM NaH2PO4, 2mM EDTA, pH 8.0. This reaction proceeded overnight. The product was used as-is in place of or in addition to anti-CD133-PE antibody in immunophenotyping experiments. Figure 3. Schematic representation of HGC- SPIO-anti-CD133 nanoconjugate Dark blue: Glycol chitosan shell Green/black spheres :SPIO in 5β cholanic acid Green outer spheres :Alexa Fluor 488 References 1. Leary, J.F, Hokanson, J.A., McLaughlin, S.R. “High Speed Cell Classification Systems for Real-Time Data Classification and Cell Sorting,” SPIE 2982, 342-352 (1997). 2. Coustan-Smith, E., Campana, D. “Immunologic minimal residual disease detection in acute lymphoblastic leukemia: A comparative approach to molecular testing,” Best Practice & Research Clinical Haematology 23(3), 347-358 (2010). . 3. Denys, B., van der Sluijs-Gelling, A.J., Homburg, C., van der Schoot, C.E., de Haas, V., Philippe, J., Pieters, R. van Dongen, J. J. M. van der Velden, V. H. J. “Improved flow cytometric detection of minimal residual disease in childhood acute lymphoblastic leukemia,” Leukemia 27(3), 635-641 (2013). 4. Key, Jaehong. Cooper, Christy, Kim, Ah Young , Dhawan, Deepika,. Knapp, Deborah W, Kim, Kwangmeyung, Park, Jae Hyung, Choi, Kuiwon, Kwon, Ick Chan , Park, Kinam, Leary, James F.,In vivo NIRF and MR dual-modality imaging using glycol chitosan nanoparticles, Journal of Controlled Release, 163: 249–255 (2012) 5. Zare, H. and Shooshtari, P. and Gupta, A. and Brinkman R.B: Data Reduction for Spectral Clustering to Analyse High Throughput Flow Cytometry Data. BMC Bioinformatics, 2010, 11:403. Acknowledgements The authors would like to acknowledge Jeffrey Woodliff, Ph.D. and Jill Hutchcroft, Ph.D. in the Purdue Cancer Research Shared Flow Cytometry and Cell Separation Facility supported by grant 5P30-CA023168-33 for their assistance with scheduling time on the FACSAria III flow cytometer/cell sorter. The authors would also like to thank Lisa Reece for drawing blood for this work in accordance with IRB protocol 0604003812. Conclusions RS4;11 leukemic blasts and the LSC subpopulation thereof could be distinguished from PBMNCs including hematopoietic stem/progenitors using a combination of fluorescent antibodies toward five cell surface markers. ROC curves indicated that the most selective positive distinguishing marker was CD133. CD24 was also suitable positive selection markers while CD45 proved to be a suitable negative selection marker. The ROC curves, shown here for individual markers, will be repeated using statistical algorithms for constructing multiparametric ROC plots. These multiparametric plots will inform the selection of new diagnostic markers using an iterative process. Cluster IDs output from spectral clustering algorithms including SamSPECTRAL will be used to develop a classification scheme for improved diagnostics of acute leukemias and to inform the development of targeted therapies that will eradicate leukemia cell subpopulations including rare LSC populations while sparing normal, healthy hematopoietic stem / progenitor cells. Figure 2. Schematic of the immunophenotypes of RS4;11 pro-B acute lymphoblastic leukemia cell line and PBMNC populations. Receiver operator characteristic (ROC) curves measure the true positive vs. false positive rate for a given diagnostic marker or test. Principal components analysis (PCA) and linear discriminant analysis (LDA) are used for both unsupervised dimensional reduction and for distinguishing between multiple groups of data via selection of the appropriate number of variables (or components) to retain for classification (PCA) and for measuring classifier performance while maximizing separation between the studied data groupings (DFA). For this research, we employed a density-based spectral clustering method with faithful sampling and clustering via a modified Markov clustering algorithm. This method is implemented in the Bioconductor/R package SamSPECTRAL (Zare 2010) and was selected because it saves time computationally with its faithful sampling method and because it is capable of finding clusters of rare (<2%) numbers of events. Figure 4. Two parameter histograms (“dot plots”) of RS4;11 blasts (left) and PBMNCs (right). CD133 v. CD33 CD133 v. CD34 CD133 v. CD24 CD133 v. CD45 ROC analysis on digital defined data mixtures of PBMNC and RS4;11 cells’ immunophenotyping data indicated that the order of specificity of the markers (antibodies) was, from best to worst performance: CD133 > CD24 > CD34 >CD33 > CD45. Marker(Ab) AUC (Area under curve) CD24 0.9188 CD33 0.4885 CD34 0.5020 CD45 0.1933 CD133 0.9994 Bioinformatics Approach Experiment Design Data collection Gate populations Color compensate Arcsinh transform Combine/subset Statistical Analysis Data transformation Cluster analysis Data mining ROC curves Flow cytometry Cytotoxicity and cell targeting studies Purple: CD133 Green: CD24 Orange: CD34 Blue: CD33 Red: CD45 RS4;11 PBMNCs (“normal”) Fig 7 Representative 3D PCA plots colored according to cell type (A,C) and by SamSPECTRAL cluster assignment (B,D). PCA appears to separate clusters from each other, but lacks ability to clearly define rare populations when cell types are used for PCA analysis.. Figure 1. Workflow for disease classification using flow cytometry and bioinformatics tools with therapeutic targeting to diseased cells. Results: Immunophenotyping Results: Marker Sensitivity and Specificity Figure 5. ROC curves and AUC values for immunophenotyping panel antibodies PBMNCs: black RS4;11: red A B C D Fig 8 Representative 3D DFA plots colored according to SamSPECTRAL cluster assignment (A-C) and by cell type (D). DFA identifies PBMNC clusters and RS4;11 clusters well but does not well resolve clusters in digital data mixtures of the combined PBMNC and RS4;11 data as would be observed clinically in leukemia patients.. PBMNCs: black RS4;11: red PBMNC only RS4;11 only PBMNC and RS4;11 combined Results: Dimensionality Reduction and Classification PBMNCs: black RS4;11: red Cell Type Mean LD1 Standard deviation LD1 Sample size PBMNC -5.795301 0.9863204 89752 RS4;11 6.160970 1.0143405 84425 Allocated to PBMNC Allocated to RS4;11 Is PBMNC 89591 161* Is RS4;11 376* 84049 Classification Rules 1. If MeanLD1 for a given cell < the average mean for the two cell types, assign that cell to be a normal PBMNC. 2. If MeanLD1 for a given cell is > the average mean for the two cell types, assign that cell to be an RS4;11 lymphoblast. Misclassification rate (total number of misclassified cells/ total number of cells) * 100 = 0.31% The overall misclassification rate is 0.31%. :* : Misclassified cells RS4;11 PBMNC Figure 9. Histograms of LD1 values corresponding to PBMNCs (group 1) and RS4;11 blasts (group 2). Decision boundary= 0.185 Populations overlap in this region at low frequencies. Truepositiverate(Sensitivity) False positive rate (1-Specificity)