1. 1
The Case for Distressed Investing (Draft February 16, 2010)
The Distressed Opportunity is Significant
We believe that distressed investing provides a compelling opportunity for investors to earn
double digit returns over the next two to four years at this stage in the credit cycle. Investment in distressed
corporate assets can offer investors attractive risk-adjusted returns with moderate correlation to other
market asset classes. With the credit beta opportunity having played out over the past year, we expect the
distressed investing opportunity to be significant over the next several years with greater-than-average
default rates driven by looming debt maturities, excess leverage of many corporate balance sheets, and
continued financial stress on companies due to ongoing economic weakness.
Defining Distressed Investing
Distressed hedge funds invest in the securities of companies that are in financial or operational
distress, often leading to restructurings, bankruptcies or liquidations. Such funds may opportunistically
invest across the capital structure of these companies on the thesis that their securities may trade at
substantial discounts to intrinsic value due to market inefficiencies, the complexity of ascertaining asset
value, or simply due to forced selling by more traditional fixed income investors.
This strategy is generally long-biased, but managers may take outright long, hedged or outright
short positions. Distressed managers typically seek to profit from the issuer’s ability to improve its
operations or from extracting value through the bankruptcy process that ultimately leads to an exit strategy.
Exit strategies can include selling the securities in the secondary market, participating in debt-for-debt or
debt-for-equity swaps, or taking ownership of undervalued collateral in the case of a liquidation.
Successful distressed managers often have some combination of deep industry expertise, strong
fundamental analytical ability, experience through multiple credit cycles, and significant restructuring
experience with the ability to influence outcomes through the restructuring process. A strong reputation
and deep relationships across the distressed community can also be value added in sourcing distressed
deals.
Distressed in the Portfolio Context
Distressed hedge funds fall into the category of return enhancers. Return enhancers in general
often share exposures with traditional market factors, although they can deliver superior risk adjusted
returns to traditional assets. Return enhancers will usually have fairly high correlations to traditional asset
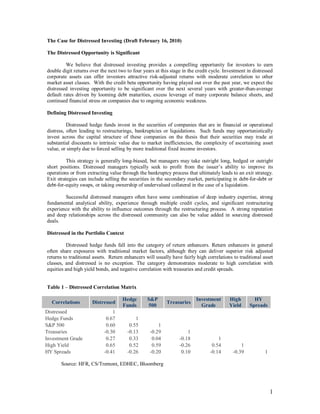
classes, and distressed is no exception. The category demonstrates moderate to high correlation with
equities and high yield bonds, and negative correlation with treasuries and credit spreads.
Table 1 – Distressed Correlation Matrix
Correlations Distressed
Hedge
Funds
S&P
500
Treasuries
Investment
Grade
High
Yield
HY
Spreads
Distressed 1
Hedge Funds 0.67 1
S&P 500 0.60 0.55 1
Treasuries -0.30 -0.13 -0.29 1
Investment Grade 0.27 0.33 0.04 -0.18 1
High Yield 0.65 0.52 0.59 -0.26 0.54 1
HY Spreads -0.41 -0.26 -0.20 0.10 -0.14 -0.39 1
Source: HFR, CS/Tremont, EDHEC, Bloomberg
2. 2
The inclusion of a return enhancer strategy versus a portfolio diversifier in an investor’s portfolio
should be intended to add to the total returns, not lower portfolio volatility. Distressed hedge funds can do
just that. Since 1994, distressed hedge funds have averaged annual returns of 11.7% and have compounded
gains at a geometric average of 10.9% per year compared to a 9.8% average and 7.6% compound rate of
return for the S&P 500 over the same time period. We also note that only twice during this stretch did the
category as a whole post yearly losses – in 1998 and 2008 – while the S&P 500 Total Return Index finished
in negative territory four times.
Figure 1 – Distressed Cumulative Returns
Cumulative Returns
-100%
0%
100%
200%
300%
400%
500%
Jan-94
Jan-95
Jan-96
Jan-97
Jan-98
Jan-99
Jan-00
Jan-01
Jan-02
Jan-03
Jan-04
Jan-05
Jan-06
Jan-07
Jan-08
Jan-09
Jan-10
Distressed Returns S&P 500 TR Index BarCap US Agg TR Index
Source: HFR, CS/Tremont, EDHEC, Bloomberg
Distressed and the Credit Cycle
We believe it is critical to evaluate the credit cycle when deciding on an allocation to distressed
managers, not only regarding expectations for the performance of the strategy as a whole but also as relates
to individual manager selection. Distressed performance statistics and distributions are not static across
time, but are heavily dependent upon debt market factors such as credit spreads, default rates and recovery
rates. We analyzed how changes in these market factors have impacted distressed performance historically.
Figure 2– The Mercer Model Credit Cycle
Credit Equilibrium
Credit ContractionCredit Expansion
3. 3
First, we categorize credit market conditions into a three stage cycle displayed graphically in
Figure 2 above: first a static Credit Equilibrium state followed by a Credit Contraction and finally a Credit
Expansion state. The Credit Equilibrium state is defined by very little change in credit spreads, default rates
or recovery rates. The Credit Contraction state sees spreads widen dramatically, while default rates increase
and recovery rates fall. Finally the improving Credit Expansion state witnesses spreads compressing to
longer term historical averages, while default rates come back down and recovery rates increase.
Figure 3 – Debt Market Changes across the Credit Cycle
Credit Cycle
(25)
(20)
(15)
(10)
(5)
0
5
10
15
20
25
Credit Equilibrium Credit Contraction Credit Expansion
PeriodChange(InPercentagePoints)
Change in Credit Spreads Change in Default Rates Change in Reovery Rates
Source: Morgan Stanley., Mercer
We then measured the return statistics of distressed investing across the stages of this cycle over
the time period 1991 to 2009. We note that the tailwinds of narrowing spreads, falling default rates and
increasing recovery rates results in the best performance for distressed in the Credit Expansion state.
Table 2 – Credit Cycle Comparison
Comparison
Credit
Equilibrium
Credit
Contraction
Credit
Expansion
Average Duration (years) 3.38 3.13 2.75
Average Annualized Return 13.2% -2.5% 25.8%
Annualized Standard Deviation 3.3% 7.6% 5.2%
Return skew -0.5 -2.5 1.0
Correlation with Equities 0.60 0.56 0.70
Correlation with High Yield 0.56 0.67 0.74
Source: Morgan Stanley, Mercer, Bloomberg
Annualized returns for distressed hedge funds in Credit Expansion conditions have averaged
25.8%, the highest of any state. Further, this phase has the lowest volatility and most positive skew of any
4. 4
point in the cycle. Only two monthly returns in the entire Credit Expansion state sample in our analysis
were negative. The average length of improving credit conditions has been 2.75 years.
We note that performance in the relatively benign Credit Equilibrium state is also fairly strong at
13.2% per annum. Returns in the this state, which averages just under three-and-a-half years in length,
exhibits a slight negative skew but also a very low standard deviation.
Finally, the Credit Contraction is the worst performer, posting negative average annualized returns
after the poor performance in 2008. Moreover, this period demonstrates a large negative skew, or a high
predisposition to substantial losses, and a high level of volatility. This period tends to last around three
years, although the last cycle was more compressed.
We also document that correlations to market factors are time-varying. Distressed returns are more
highly correlated with equity and high yield returns in Credit Expansion conditions and slightly less
correlated in both Equilibrium and Contraction market environments. While the difference is not large, it
may suggest that distressed participates more with equity and high yield returns on the upside, and in
general provides relatively more diversification benefits on the downside, which is consistent with a
strategy that has lower total volatility over the credit cycle than either equities or high yield bonds and
superior risk adjusted returns to both.
Manager Dispersion
Another phenomenon we investigated was the dispersion of the underlying managers from the
distressed benchmark, and how this dispersion manifests across the credit cycle. First, hedge funds as a
whole are an extremely heterogeneous asset class. And managers within a given strategy may be much
more differentiated in their investment philosophy and process than traditional, benchmark-linked
managers. As such, the dispersion of returns within one category of hedge funds is much wider than the
dispersion within one category of mutual funds. We calculated the dispersion of returns as the annualized
difference in returns of the 75th percentile manager over the 25th percentile manager. (For example, if the
75th percentile manager returned 30% per year, and the 25th percentile manager averaged -15%, the
difference would be expressed as 45 percentage points.)
Figure 4 – Dispersion of Manager Returns by State
Dispersion of Manager Returns
Credit
Equilibrium
Credit
Contraction
Credit
Expansion
0
10
20
30
40
50
PercentagePoints
Source: Eurekahedge, CS/Tremont, HFR, Mercer
5. 5
It is apparent that over the cycle in its entirety, distressed hedge fund returns are very widely
dispersed, about 35 percentage points for the 75th to 25th percentile difference, a significantly larger spread
than for traditional equity mutual fund managers, and even more so versus bond funds. While manager
dispersion is the widest in the Credit Contraction phase, it is clear that manager selection is critical for
performance at all phases in the credit cycle. However, specific considerations regarding what managers to
invest in may differ in each phase of the cycle.
Backdrop for the Distressed Opportunity
Current estimates of the total dollar amount of defaulted and distressed corporate loans and high
yield bonds range from roughly $650 billion to $1.2 trillion. From 2008 to 2009, 193 companies defaulted
totaling $283.6 billion, many of which were good businesses with bad balance sheets, victims of the mid-
2000s leveraged buying spree by private equity firms.
Figure 5 – Dollar Default Totals
Defaults
$0
$20
$40
$60
$80
$100
$120
$140
$160
$180
$200
1998 1999 2000 2001 2002 2003 2004 2005 2006 2007 2008 2009
($inBil)
Leveraged Loans High Yield Bonds
Source: Morgan Markets
As illustrated in figure 6, leveraged loan and high yield maturities peak in the 2012 to 2014
timeframe, with almost $1 trillion of debt coming due. This wall of maturities could potentially generate
additional defaults as many stressed companies may not be able to refinance their debt. Further, during this
same time period, many Collateralized Loan Obligations (CLOs), which have been natural buyers of
leveraged loans, will see their reinvestment periods winding down with little to no new CLO issuance
expected (see figure 7). Defaults, which normally run around 4%, peaked near 12% in 2009. A number of
industry experts predict default levels to decline gradually to around 4% through 2011 and to start ramping
up again beginning in 2012. This projection could be optimistic should economic headwinds lead to a
global double-dip recession and a number of firms are unable to further extend these maturities.
6. 6
Figure 6 – Dollar Value of Maturing Debt
The Wall of Maturities
$0
$50
$100
$150
$200
$250
$300
$350
$400
$450
2009 2010 2011 2012 2013 2014 2015 2016 2017
($inBil)
Leveraged Loans High Yield Bonds
Source: Credit Suisse and Barclays Capital
Figure 7 – Collateralized Loan Obligation (CLO) Re-Investable Assets
CLO Reinvestable Assets
$0
$50
$100
$150
$200
$250
$300
2010 2011 2012 2013 2014
($inBil)
Source: Wells Fargo, Credit Suisse
2009 saw a number of high-profile bankruptcies of household names. As such, we expect the next five
years to see many corporations restructure their balance sheets through exchange offers, pre-packaged
bankruptcies, and Chapter 11 filings. The skilled distressed manager should be able to take advantage of
the significant distressed opportunity and extract attractive value for investors.
7. 7
Figure 8 – Corporate Bankruptcies and Bank Failures
20,000
30,000
40,000
50,000
60,000
70,000
80,000
90,000
1980
1984
1988
1992
1996
2000
2004
2008
0
100
200
300
400
500
600
US Corporate Bankruptcies - (LHS) Bank Failures- (RHS)
Source: FDIC and Administrative Office of the United States Courts
Distressed returns can remain robust across entire business cycles as opportunities arise through
supply/demand imbalances. Nontraditional distressed holders such as banks often have to sell distressed
assets off of their balance sheets to meet internal and external regulatory guidelines, thus boosting the
supply of distressed paper. The universe of distressed buyers can often be limited by barriers to entry into
distressed investing due to the experience, capital, and resources required to successfully invest in the asset
class.
Current Conditions
We believe the credit state is currently still improving, and will gradually continue to do so for
some time, inclusive of the occasional market correction. Credit spreads have tightened dramatically from
the peaks with high yield bond spreads at average historical levels and bank loans still trading wider to
historic averages. Default rates, which typically peak during the improving phase, have already begin
moving lower, but may move up again as debt maturities mount in the 2012 to 2014 timeframe and or the
current economic recovery stalls. Recovery rates remain slightly below long term averages as well.
Table 3 – Current State Comparison
Market Factor
Long Run
Average
Average
Expansion
End State
Current
HY Bond Spreads 500 bps 400 bps 650 bps
Default Rate 3% to 4% 2.8% 7.5%
Recovery Rate 50% to 60% 54.3% 45.0%
Source: Morgan Stanley, Moody’s, Bloomberg
8. 8
Based upon our analysis, evidence suggests we are roughly fourteen months into the Credit
Expansion cycle, which on average has lasted 2.75 years. We expect to see a gradual, continued moderation
of credit spreads, notwithstanding the possibility of temporary credit contractions. Default rates, which
have historically peaked after credit conditions have begun to improve, will likely also contract over the
next eighteen months or so, declining to longer term averages while recovery rates will improve as well.
Figure 9 – Credit Spreads
Spreads
0
250
500
750
1000
1250
1500
1750
2000
9/30/02
3/21/03
9/12/03
3/5/04
8/27/04
2/18/05
8/12/05
2/3/06
7/28/06
1/19/07
7/13/07
1/4/08
6/27/0812/19/08
6/12/09
12/4/09
5/28/10
High Yield Investment Grade
Source: Moody’s, Bloomberg
Figure 10 – Default Rates
Annualized High Yield Default Rates
0
2
4
6
8
10
12
1983
1985
1987
1989
1991
1993
1995
1997
1999
2001
2003
2005
2007
2009
Source: Moody’s
9. 9
Strategy Options for Distressed Investors
Investors may choose to invest in one of several distressed vehicles depending on their objectives.
Exposure to distressed alpha can be achieved through a number of hedge fund structures, including: 1)
distressed only funds; 2) hybrid long/short credit and distressed debt funds, or 3) multistrategy event-driven
funds. In distressed-only funds, the investment team is focused on distressed investing through a credit
cycle. In the hybrid and multistrategy funds, capital is dynamically allocated across two or more strategies,
often including distressed, long/short credit, merger arbitrage and special situations, depending on the
opportunity set at any one point in the cycle.
Distressed managers can have different stylistic approaches to investing. When evaluating distressed
managers, it may be helpful to understand where a manager stands on this matrix.
Value v. control strategies – A value distressed manager uses fundamental analysis to identify
value in distressed securities. These managers generally target returns in the 15% to 20% range.
Holding periods may vary. A trade is exited when a target price or return has been achieved. By
contrast, some managers try to maximize returns by taking control positions in distressed
securities, often purchasing a majority block in an effort to enhance their bargaining power in a
restructuring. Certain managers build positions in a company’s securities to gain influence through
a restructuring while others take maturity ownership so that they can exercise control over the
turnaround of a company’s operations after emerging from bankruptcy.
Liquid v. illiquid strategies – Distressed securities run the gamut of the liquidity spectrum. A
good supply of large, liquid distressed deals are currently traded on the market as a result of the
recent LBO boom. As the supply of more liquid distressed deals wanes, however, a number of
managers are moving down the spectrum into less liquid assets. Investors need to understand the
risk/return trade-off of exposure to these securities and a manager’s policy or ability regarding
potentially side-pocketing these assets.
Long v. shorter lock up periods – Distressed managers focusing on value trades generally have
lock-ups of one year or less. We often see lock-ups of two to three years for funds that are
focused on extracting value from restructurings, as many of these situations can take 18 to 24
months for value to be realized. Finally, a growing number of distressed managers are offering
private-equity-like structure, investing in longer-term assets and locking up investor funds for five
to ten years.
How to Choose a Distressed Manager
We have performed due diligence on a broad set of distressed hedge funds, culling through a large list
of managers in search of those with the highest probability of consistently outperforming their peers. In
identifying these likely outperformers, we outline here a core set of manager characteristics that we believe
can lead to superior returns:
Focus on strong fundamental analysis – Distressed investing is bottom-up driven and, thus, a strong
credit culture and commitment to fundamental research is critical to identifying value in distressed
assets.
Experience through multiple credit cycles – A manager with significant experience through multiple
credit cycles is best equipped to foresee cyclical turns, adapt its investment style appropriately, and
navigate through the volatility that often accompanies a deteriorating credit environment.
Deep restructuring experience – Those managers with deep restructuring teams are better able to
identify and extract value in corporate restructurings. We like to see teams with significant
bankruptcy experience and legal expertise.
10. 10
Capital available for deployment – The ability to attract capital, particularly when coming out of a
cyclical bottom when investors may be a skittish, will best position a distressed manager to be able to
take advantage of the distressed opportunity.
Willingness/ability to take control positions or influence outcomes in restructuring – There is a
subset of distressed managers that has been proven very adept at maximizing value through taking
control positions in corporate restructurings. The ability to drive the restructuring process gives the
manager greater control over potential outcomes and, thus, returns.
Strong reputation/deep relationships – There is a relatively small universe of distressed investors.
As the distressed market can be relatively illiquid and inefficient, an edge can be gained by those
investors that have strong relationships within the distressed community and can form alliances with
other managers in putting together a blocking position. The ability to forge strong relationships with
corporate management teams is also valuable.
Flexibility – Managers that have proven the flexibility to adapt their investing styles across cycles and
who are able to proactively pursue new opportunities in distressed are valued. For example, debtor-in-
possession “DIP” financings have recently provided a new investing opportunity for distressed funds
able to remain agile.
Risks to Our Thesis
While we believe market conditions are likely to remain favorable to at least neutral for investors
in distressed strategies for some time, there are of course potential risks to this view. We enumerate several
of these below.
1) “Double-dip” recession: It is possible that economic conditions in 2010 could turn adverse again,
potentially sending equity returns into negative territory and causing additional deleveraging in
credit markets. Such a scenario would likely result in deteriorating credit conditions and negative
tailwinds for distressed portfolios. However, managers that could successfully protect their
portfolios against this situation and raise cash would very likely find more investment
opportunities in the long run as a result.
2) Stronger than expected economic rebound: It is also possible that the economy will rebound more
sharply than anticipated. This scenario would lead to greater liquidity and greater access to capital
markets, and would likely help the valuations of current distressed portfolios. However, such an
outcome could also shorten the cycle and reduce the window of opportunity going forward.
3) Regulatory uncertainty: Given the current political environment in favor of greater regulation of
financial market participants, any number of new legislative actions could be initiated that would
change the bankruptcy and restructuring process, hedge fund industry, and financial markets in
general.
4) European contagion: The recent financial stress in Greece is expected to lead to austerity
programs across Europe which will likely stagnate economic growth across the region. This
contagion could spread globally, stalling the recent economic recovery.
Conclusion
We believe conditions are favorable for distressed investing at this stage in the credit cycle.
Corporate bankruptcies, over-leveraged companies, and significant debt maturity overhang all seem likely
to offer sufficient investment opportunities for managers going forward. At the same time, we also see
potential for easing of default rates and improving recovery rates, all of which provide positive tailwinds
11. 11
for a distressed portfolio. As we hit the 2012 debt maturity wall, however, we may see a new increase in
default rates. We are also mindful that a double dip recession could erode distressed returns in the near
term but would probably prolong the distressed cycle. Historical analysis of distressed returns across the
credit cycle suggests the possibility for a three to four year period where returns might average 10% to
15%. As shown, good manager selection will be imperative in maximizing returns in the distressed space
across cycles.
Catherine Beard, CFA
Senior Associate, Mercer
Christopher M. Schelling, CAIA
Senior Associate, Mercer
12. 12
Appendix A – An analysis of distressed returns
Figure A.1 – Distressed Annual Returns
Distressed Annual Returns
-30%
-20%
-10%
0%
10%
20%
30%
1994 1995 1996 1997 1998 1999 2000 2001 2002 2003 2004 2005 2006 2007 2008 2009 2010
YTD
Source: HFR, CS/Tremont, EDHEC
The standard deviation of distressed returns has been relatively low at roughly 6.5% annualized,
giving the strategy a solid Sharpe ratio of 1.07. However, it is important to note that volatility alone is not
the full measure of risk in this strategy, nor most hedge fund strategies for that matter. Distressed hedge
funds have a decidedly non-normal return distribution. That is to say, distressed returns are both
asymmetrical and more prone to outlier events than normal. As such, manager selection is particularly
important in distressed investing.
Table A.1 – Distressed Annual Return Statistics Summary
1994-2009 Distressed
HF
Index
S&P 500
TR
Barclay
Agg TR
Geometric Average Annual Return 10.90% 9.50% 7.61% 6.16%
Arithmetic Annual Mean Return 11.68% 10.65% 9.81% 6.89%
Annualized Standard Deviation 6.47% 7.27% 15.52% 3.88%
Sharpe Ratio 1.07 0.76 0.23 0.56
Skew -1.9531 -0.6723 -0.7701 -0.2688
Kurtosis 8.3321 2.8910 1.2032 0.8962
Source: HFR, CS/Tremont, EDHEC
13. 13
Figure A.3 – Distressed Monthly Return Distribution
Distressed Monthly Return Distribution (1994-2009)
0
20
40
60
80
100
120
140
-12.5%
-11.7%
-10.9%
-10.1%
-9.3%
-8.5%
-7.8%
-7.0%
-6.2%
-5.4%
-4.6%
-3.8%
-3.1%
-2.3%
-1.5%
-0.7%
0.1%
0.9%
1.6%
2.4%
3.2%
4.0%
4.8%
More
Source: HFR, CS/Tremont, EDHEC
We analyzed monthly returns for the distressed benchmark indices from HFR, Credit Suisse
Tremont and EDHEC, which resulted in the histogram displayed in Figure A.3. Again, this negatively
skewed distribution highlights the importance of manager selection which can eliminate the left tail shown
above.
Left tail exposure