SlideShare ist ein Scribd-Unternehmen logo
1 von 12
Downloaden Sie, um offline zu lesen
Stat. 4868/6610 Data Visualization Name: ___Christina Huang________
Department of Statistics and Biostatistics (print First Last )
CSU East Bay Class Number:___STAT 6610________
Source: January, 2011 to February, 2015 from China Labour Bulletin website.
1. b. The time plot for each Location by Tableau
China Labour Strikes (2011-2015)
Beijing Labour
Strikes 2011-2015
Chongqing Labour
Strikes 2011-2015
Guangdong Labour
Strikes 2011-2015
Shanghai Labour
Strikes 2011-2015
Labour Strikes Time
Series 2011-2015
Labour Strikes
Comparison
2011-2015
2011 2012 2013 2014 2015
Year
0
5
10
15
20
China Labour Strikes (2011-2015)
Beijing Labour
Strikes 2011-2015
Chongqing Labour
Strikes 2011-2015
Guangdong Labour
Strikes 2011-2015
Shanghai Labour
Strikes 2011-2015
Labour Strikes Time
Series 2011-2015
Labour Strikes
Comparison
2011-2015
2011 2012 2013 2014 2015
Year
0
5
10
15
20
China Labour Strikes (2011-2015)
Beijing Labour
Strikes 2011-2015
Chongqing Labour
Strikes 2011-2015
Guangdong Labour
Strikes 2011-2015
Shanghai Labour
Strikes 2011-2015
Labour Strikes Time
Series 2011-2015
Labour Strikes
Comparison
2011-2015
2011 2012 2013 2014 2015
Year
0
50
100
150
200
250
300
1. c. Nne plot with all four Locations on the time plot in different colors by Tableau
China Labour Strikes (2011-2015)
Chongqing Labour
Strikes 2011-2015
Guangdong Labour
Strikes 2011-2015
Shanghai Labour
Strikes 2011-2015
Labour Strikes Time
Series 2011-2015
Labour Strikes
Comparison
2011-2015
Labour Strikes Map
2011-2015
2011 2012 2013 2014 2015
Year
0
10
20
30
40
China Labour Strikes (2011-2015)
Guangdong Labour
Strikes 2011-2015
Shanghai Labour
Strikes 2011-2015
Labour Strikes Time
Series 2011-2015
Labour Strikes
Comparison
2011-2015
Labour Strikes Map
2011-2015
2011 2012 2013 2014 2015
Year
0
50
100
150
200
250
300
Shanghai
Guangdong
Locations
Beijing
Chongqing
Guangdong
Shanghai
1. d. The clustered bar graph for the data by Tableau.
Optional stacked up bar graph:
China Labour Strikes (2011-2015)
Guangdong Labour
Strikes 2011-2015
Shanghai Labour
Strikes 2011-2015
Labour Strikes Time
Series 2011-2015
Labour Strikes
Comparison
2011-2015
Labour Strikes Map
2011-2015
Year
2011 2012 2013 2014 2015
0
50
100
150
200
250
300
54
642
154
12
5 2
243
13 10 11
301
20
44
22
42
5 86
Measure Names
Beijing
Chongqing
Guangdong
Shanghai
1. e. The screen shots of each year from the dynamic bubble graph by Tableau are show below:
China Labour Strikes (2011-2015)
Guangdong Labour
Strikes 2011-2015
Shanghai Labour
Strikes 2011-2015
Labour Strikes Time
Series 2011-2015
Labour Strikes
Comparison
2011-2015
Labour Strikes Map
2011-2015
Guangdong
54
Shanghai
6
Beijing
2
Locations
Beijing
Chongqing
Guangdong
Shanghai
Num Strikes
2
100
200
301
Year of Year
2011
Show History
China Labour Strikes (2011-2015)
Guangdong Labour
Strikes 2011-2015
Shanghai Labour
Strikes 2011-2015
Labour Strikes Time
Series 2011-2015
Labour Strikes
Comparison
2011-2015
Labour Strikes Map
2011-2015
Beijing
5
Locations
Beijing
Chongqing
Guangdong
Shanghai
Num Strikes
2
100
200
301
Year of Year
2012
Show History
China Labour Strikes (2011-2015)
Guangdong Labour
Strikes 2011-2015
Shanghai Labour
Strikes 2011-2015
Labour Strikes Time
Series 2011-2015
Labour Strikes
Comparison
2011-2015
Labour Strikes Map
2011-2015
Beijing
13
Locations
Beijing
Chongqing
Guangdong
Shanghai
Num Strikes
2
100
200
301
Year of Year
2013
Show History
China Labour Strikes (2011-2015)
Guangdong Labour
Strikes 2011-2015
Shanghai Labour
Strikes 2011-2015
Labour Strikes Time
Series 2011-2015
Labour Strikes
Comparison
2011-2015
Labour Strikes Map
2011-2015
Beijing
20
Locations
Beijing
Chongqing
Guangdong
Shanghai
Num Strikes
2
100
200
301
Year of Year
2014
Show History
China Labour Strikes (2011-2015)
Guangdong Labour
Strikes 2011-2015
Shanghai Labour
Strikes 2011-2015
Labour Strikes Time
Series 2011-2015
Labour Strikes
Comparison
2011-2015
Labour Strikes Map
2011-2015
Guangdong
42
Chongqing
6
Shanghai
8
Beijing
5
Locations
Beijing
Chongqing
Guangdong
Shanghai
Num Strikes
2
100
200
301
Year of Year
2015
Show History
2. The screen shots of each year from the dynamic bubble graph using google Chart Tools are shown
below:
Appendix
1. The data were collected from January, 2011 to February, 2015 from China Labour Bulletin
(http://maps.clb.org.hk/strikes/en). Data were recorded as monthly and saved in Excel spreadsheet
format. Two data sets (labour.csv and labour.alt.csv) were then generated by R codes to created plots in
Tableau.
# Project 01
#install.packages("xlsx", dependencies=TRUE)
#install.packages("lubridate", dependencies=TRUE)
#install.packages("zoo")
library(xlsx)
library(lubridate)
library(zoo)
# 1a.
strikes = read.xlsx("I:/STAT6610/Homework/project1/proj01_strikes.xlsx", sheetName="Labour",
as.data.frame=TRUE,header=TRUE)
# calculate strikes by year by locations
# This is to make one plot with all four Locations on the time plot in different colors.
# Also for dynamic bubble graph and stacked up bar graph.
year=rep(c("2011/12/31","2012/12/31","2013/12/31","2014/12/31", "2015/02/28"),4)
locations=rep(c("Beijing","Chongqing","Guangdong","Shanghai"),each=5)
num_strikes=numeric(length(year))
for (i in 1:length(year))
{
num_strikes[i]=sum(strikes$Strikes[which(year(strikes$Date)==year(year[i])
& (strikes$Locations==locations[i]))])
}
labour=data.frame(year, locations, num_strikes)
write.csv(labour, "I:/STAT6610/Homework/project1/labour.csv",row.names=FALSE )
# create another data set for individual bar graph and cluster bar graph
Year=c("2011/12/31","2012/12/31","2013/12/31","2014/12/31", "2015/02/28")
Beijing=num_strikes[1:5]
Chongqing=num_strikes[6:10]
Guangdong=num_strikes[11:15]
Shanghai=num_strikes[16:20]
labour.alt=data.frame(Year,Beijing,Chongqing,Guangdong,Shanghai)
write.csv(labour.alt, "I:/STAT6610/Homework/project1/labour.alt.csv",row.names=FALSE)
labour.csv
2. R code to produce the dynamic bubble graph using google Chart Tools.
install.packages("googleVis")
library(googleVis)
labour=read.csv("I:/STAT6610/Homework/project1/labour.csv",header=TRUE,sep=",")
# create another data set for dynamic bubble graph using google Chart Tools
Year = year(labour$year)
locations=labour$locations
num_strikes=labour$num_strikes
labour.g=data.frame(locations, Year, num_strikes)
M1 <- gvisMotionChart(labour.g, idvar="locations", timevar="Year",
sizevar="num_strikes")
plot(M1)

Weitere ähnliche Inhalte

Andere mochten auch

Búsqueda avanzada 3
Búsqueda avanzada 3Búsqueda avanzada 3
Búsqueda avanzada 3C4RL05V
 
Resume: Social Media Officer
Resume: Social Media OfficerResume: Social Media Officer
Resume: Social Media OfficerLukmanul Hakim
 
Corporate Watch: false dilemmas a critical guide to the euro zone crisis
Corporate Watch: false dilemmas a critical guide to the euro zone crisisCorporate Watch: false dilemmas a critical guide to the euro zone crisis
Corporate Watch: false dilemmas a critical guide to the euro zone crisisDr Lendy Spires
 
Chớ xem thường các cơn đau nửa đầu, nhức đầu
Chớ xem thường các cơn đau nửa đầu, nhức đầuChớ xem thường các cơn đau nửa đầu, nhức đầu
Chớ xem thường các cơn đau nửa đầu, nhức đầufelipe174
 
Tăng testosterone nội sinh bằng thảo dược thiên nhiên
Tăng testosterone nội sinh bằng thảo dược thiên nhiênTăng testosterone nội sinh bằng thảo dược thiên nhiên
Tăng testosterone nội sinh bằng thảo dược thiên nhiêncletus310
 
Tabiat merokok menjadi panorama biasa dalam masyarakat kita
Tabiat merokok menjadi panorama biasa dalam masyarakat kitaTabiat merokok menjadi panorama biasa dalam masyarakat kita
Tabiat merokok menjadi panorama biasa dalam masyarakat kitaOng Fang
 
Submit final report on working capital mgt
Submit final report on working capital mgtSubmit final report on working capital mgt
Submit final report on working capital mgtJack Silambu
 
Dbl15 e0001 sponsorship_gen_fa2_lr_no contact
Dbl15 e0001 sponsorship_gen_fa2_lr_no contactDbl15 e0001 sponsorship_gen_fa2_lr_no contact
Dbl15 e0001 sponsorship_gen_fa2_lr_no contactStephanie Bleakley
 
O site Jornalismo Colaborativo como agente de transformação social
O site Jornalismo Colaborativo como agente de transformação socialO site Jornalismo Colaborativo como agente de transformação social
O site Jornalismo Colaborativo como agente de transformação socialGeorges Kirsteller Ryoki Inoue
 

Andere mochten auch (11)

Búsqueda avanzada 3
Búsqueda avanzada 3Búsqueda avanzada 3
Búsqueda avanzada 3
 
Resume: Social Media Officer
Resume: Social Media OfficerResume: Social Media Officer
Resume: Social Media Officer
 
Corporate Watch: false dilemmas a critical guide to the euro zone crisis
Corporate Watch: false dilemmas a critical guide to the euro zone crisisCorporate Watch: false dilemmas a critical guide to the euro zone crisis
Corporate Watch: false dilemmas a critical guide to the euro zone crisis
 
Chớ xem thường các cơn đau nửa đầu, nhức đầu
Chớ xem thường các cơn đau nửa đầu, nhức đầuChớ xem thường các cơn đau nửa đầu, nhức đầu
Chớ xem thường các cơn đau nửa đầu, nhức đầu
 
MODOS DE PRODUCCION
MODOS DE PRODUCCIONMODOS DE PRODUCCION
MODOS DE PRODUCCION
 
Tăng testosterone nội sinh bằng thảo dược thiên nhiên
Tăng testosterone nội sinh bằng thảo dược thiên nhiênTăng testosterone nội sinh bằng thảo dược thiên nhiên
Tăng testosterone nội sinh bằng thảo dược thiên nhiên
 
Guided reading
Guided readingGuided reading
Guided reading
 
Tabiat merokok menjadi panorama biasa dalam masyarakat kita
Tabiat merokok menjadi panorama biasa dalam masyarakat kitaTabiat merokok menjadi panorama biasa dalam masyarakat kita
Tabiat merokok menjadi panorama biasa dalam masyarakat kita
 
Submit final report on working capital mgt
Submit final report on working capital mgtSubmit final report on working capital mgt
Submit final report on working capital mgt
 
Dbl15 e0001 sponsorship_gen_fa2_lr_no contact
Dbl15 e0001 sponsorship_gen_fa2_lr_no contactDbl15 e0001 sponsorship_gen_fa2_lr_no contact
Dbl15 e0001 sponsorship_gen_fa2_lr_no contact
 
O site Jornalismo Colaborativo como agente de transformação social
O site Jornalismo Colaborativo como agente de transformação socialO site Jornalismo Colaborativo como agente de transformação social
O site Jornalismo Colaborativo como agente de transformação social
 

proj_plots

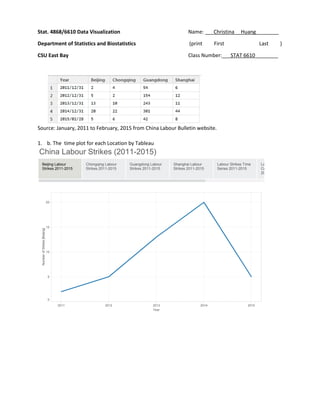
  • 1. Stat. 4868/6610 Data Visualization Name: ___Christina Huang________ Department of Statistics and Biostatistics (print First Last ) CSU East Bay Class Number:___STAT 6610________ Source: January, 2011 to February, 2015 from China Labour Bulletin website. 1. b. The time plot for each Location by Tableau China Labour Strikes (2011-2015) Beijing Labour Strikes 2011-2015 Chongqing Labour Strikes 2011-2015 Guangdong Labour Strikes 2011-2015 Shanghai Labour Strikes 2011-2015 Labour Strikes Time Series 2011-2015 Labour Strikes Comparison 2011-2015 2011 2012 2013 2014 2015 Year 0 5 10 15 20
  • 2. China Labour Strikes (2011-2015) Beijing Labour Strikes 2011-2015 Chongqing Labour Strikes 2011-2015 Guangdong Labour Strikes 2011-2015 Shanghai Labour Strikes 2011-2015 Labour Strikes Time Series 2011-2015 Labour Strikes Comparison 2011-2015 2011 2012 2013 2014 2015 Year 0 5 10 15 20 China Labour Strikes (2011-2015) Beijing Labour Strikes 2011-2015 Chongqing Labour Strikes 2011-2015 Guangdong Labour Strikes 2011-2015 Shanghai Labour Strikes 2011-2015 Labour Strikes Time Series 2011-2015 Labour Strikes Comparison 2011-2015 2011 2012 2013 2014 2015 Year 0 50 100 150 200 250 300
  • 3. 1. c. Nne plot with all four Locations on the time plot in different colors by Tableau China Labour Strikes (2011-2015) Chongqing Labour Strikes 2011-2015 Guangdong Labour Strikes 2011-2015 Shanghai Labour Strikes 2011-2015 Labour Strikes Time Series 2011-2015 Labour Strikes Comparison 2011-2015 Labour Strikes Map 2011-2015 2011 2012 2013 2014 2015 Year 0 10 20 30 40 China Labour Strikes (2011-2015) Guangdong Labour Strikes 2011-2015 Shanghai Labour Strikes 2011-2015 Labour Strikes Time Series 2011-2015 Labour Strikes Comparison 2011-2015 Labour Strikes Map 2011-2015 2011 2012 2013 2014 2015 Year 0 50 100 150 200 250 300 Shanghai Guangdong Locations Beijing Chongqing Guangdong Shanghai
  • 4. 1. d. The clustered bar graph for the data by Tableau. Optional stacked up bar graph: China Labour Strikes (2011-2015) Guangdong Labour Strikes 2011-2015 Shanghai Labour Strikes 2011-2015 Labour Strikes Time Series 2011-2015 Labour Strikes Comparison 2011-2015 Labour Strikes Map 2011-2015 Year 2011 2012 2013 2014 2015 0 50 100 150 200 250 300 54 642 154 12 5 2 243 13 10 11 301 20 44 22 42 5 86 Measure Names Beijing Chongqing Guangdong Shanghai
  • 5. 1. e. The screen shots of each year from the dynamic bubble graph by Tableau are show below: China Labour Strikes (2011-2015) Guangdong Labour Strikes 2011-2015 Shanghai Labour Strikes 2011-2015 Labour Strikes Time Series 2011-2015 Labour Strikes Comparison 2011-2015 Labour Strikes Map 2011-2015 Guangdong 54 Shanghai 6 Beijing 2 Locations Beijing Chongqing Guangdong Shanghai Num Strikes 2 100 200 301 Year of Year 2011 Show History China Labour Strikes (2011-2015) Guangdong Labour Strikes 2011-2015 Shanghai Labour Strikes 2011-2015 Labour Strikes Time Series 2011-2015 Labour Strikes Comparison 2011-2015 Labour Strikes Map 2011-2015 Beijing 5 Locations Beijing Chongqing Guangdong Shanghai Num Strikes 2 100 200 301 Year of Year 2012 Show History
  • 6. China Labour Strikes (2011-2015) Guangdong Labour Strikes 2011-2015 Shanghai Labour Strikes 2011-2015 Labour Strikes Time Series 2011-2015 Labour Strikes Comparison 2011-2015 Labour Strikes Map 2011-2015 Beijing 13 Locations Beijing Chongqing Guangdong Shanghai Num Strikes 2 100 200 301 Year of Year 2013 Show History China Labour Strikes (2011-2015) Guangdong Labour Strikes 2011-2015 Shanghai Labour Strikes 2011-2015 Labour Strikes Time Series 2011-2015 Labour Strikes Comparison 2011-2015 Labour Strikes Map 2011-2015 Beijing 20 Locations Beijing Chongqing Guangdong Shanghai Num Strikes 2 100 200 301 Year of Year 2014 Show History
  • 7. China Labour Strikes (2011-2015) Guangdong Labour Strikes 2011-2015 Shanghai Labour Strikes 2011-2015 Labour Strikes Time Series 2011-2015 Labour Strikes Comparison 2011-2015 Labour Strikes Map 2011-2015 Guangdong 42 Chongqing 6 Shanghai 8 Beijing 5 Locations Beijing Chongqing Guangdong Shanghai Num Strikes 2 100 200 301 Year of Year 2015 Show History
  • 8. 2. The screen shots of each year from the dynamic bubble graph using google Chart Tools are shown below:
  • 9.
  • 10.
  • 11. Appendix 1. The data were collected from January, 2011 to February, 2015 from China Labour Bulletin (http://maps.clb.org.hk/strikes/en). Data were recorded as monthly and saved in Excel spreadsheet format. Two data sets (labour.csv and labour.alt.csv) were then generated by R codes to created plots in Tableau. # Project 01 #install.packages("xlsx", dependencies=TRUE) #install.packages("lubridate", dependencies=TRUE) #install.packages("zoo") library(xlsx) library(lubridate) library(zoo) # 1a. strikes = read.xlsx("I:/STAT6610/Homework/project1/proj01_strikes.xlsx", sheetName="Labour", as.data.frame=TRUE,header=TRUE) # calculate strikes by year by locations # This is to make one plot with all four Locations on the time plot in different colors. # Also for dynamic bubble graph and stacked up bar graph. year=rep(c("2011/12/31","2012/12/31","2013/12/31","2014/12/31", "2015/02/28"),4) locations=rep(c("Beijing","Chongqing","Guangdong","Shanghai"),each=5) num_strikes=numeric(length(year)) for (i in 1:length(year)) { num_strikes[i]=sum(strikes$Strikes[which(year(strikes$Date)==year(year[i]) & (strikes$Locations==locations[i]))]) } labour=data.frame(year, locations, num_strikes) write.csv(labour, "I:/STAT6610/Homework/project1/labour.csv",row.names=FALSE ) # create another data set for individual bar graph and cluster bar graph Year=c("2011/12/31","2012/12/31","2013/12/31","2014/12/31", "2015/02/28") Beijing=num_strikes[1:5] Chongqing=num_strikes[6:10] Guangdong=num_strikes[11:15] Shanghai=num_strikes[16:20] labour.alt=data.frame(Year,Beijing,Chongqing,Guangdong,Shanghai) write.csv(labour.alt, "I:/STAT6610/Homework/project1/labour.alt.csv",row.names=FALSE)
  • 12. labour.csv 2. R code to produce the dynamic bubble graph using google Chart Tools. install.packages("googleVis") library(googleVis) labour=read.csv("I:/STAT6610/Homework/project1/labour.csv",header=TRUE,sep=",") # create another data set for dynamic bubble graph using google Chart Tools Year = year(labour$year) locations=labour$locations num_strikes=labour$num_strikes labour.g=data.frame(locations, Year, num_strikes) M1 <- gvisMotionChart(labour.g, idvar="locations", timevar="Year", sizevar="num_strikes") plot(M1)