Weitere ähnliche Inhalte
Mehr von ChristinaHoe (15)
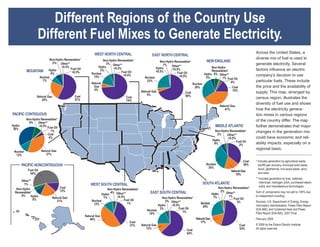
Map of generated electricity
- 1. Different Regions of the Country Use
Different Fuel Mixes to Generate Electricity.
WEST NORTH CENTRAL Across the United States, a
EAST NORTH CENTRAL
Non-Hydro Renewables* diverse mix of fuel is used to
Non-Hydro Renewables* Non-Hydro Renewables* NEW ENGLAND
2% Other** 3% Other** generate electricity. Several
1% Other**
<0.5% Hydro <0.5% Hydro Non-Hydro
Fuel Oil <0.5%
MOUNTAIN Hydro <0.5%
2%
Fuel Oil <0.5% Fuel Oil
Renewables*
8% Nuclear Hydro 6% Other**
Nuclear 15% <0.5% <0.5% company’s decision to use
Nuclear 5% 1% Fuel Oil
7% 23% 4% particular fuels. These include
Natural Nuclear
Gas 28% Coal the price and the availability of
5% Natural Gas 15%
Coal supply. This map, arranged by
5% 69%
Natural Gas Coal Coal census region, illustrates the
25% 57% 74%
diversity of fuel use and shows
Natural Gas
41% how the electricity genera-
PACIFIC CONTIGUOUS tion mixes in various regions
Non-Hydro Renewables* of the country differ. The map
9% Other**
Hydro <0.5% Fuel Oil MIDDLE ATLANTIC further demonstrates that major
38%
1% Non-Hydro Renewables* changes in the generation mix
Coal 2% Other**
4% <0.5% could have economic and reli-
Hydro Fuel Oil
6% 2%
ability impacts, especially on a
regional basis.
Nuclear Natural Gas
12% 37%
Coal * Includes generation by agricultural waste,
PACIFIC NONCONTIGUOUS Nuclear 36% landfill gas recovery, municipal solid waste,
35% wood, geothermal, non-wood waste, wind,
Fuel Oil Natural Gas
54% 19% and solar.
** Includes generation by tires, batteries,
Other** chemicals, hydrogen, pitch, purchased steam,
1% WEST SOUTH CENTRAL SOUTH ATLANTIC
Coal Non-Hydro Renewables* sulfur, and miscellaneous technologies.
Non-Hydro Non-Hydro Renewables*
12% 2%
Renewables*
Hydro
4% Other** EAST SOUTH CENTRAL Hydro Other** Sum of components may not add to 100% due
4% Hydro <0.5% 1% 1% to independent rounding.
Natural Gas 1% Non-Hydro Renewables* Fuel Oil
8% 21% Nuclear Fuel Oil 2% Other** 3% Sources: U.S. Department of Energy, Energy
12% 1% Nuclear
Hydro <0.5% 24% Information Administration, Power Plant Report
Fuel Oil
Nuclear 3% 1%
(EIA-906), and Combined Heat and Power
19% Plant Report (EIA-920), 2007 Final.
Natural Gas
46% Natural Gas February 2009
Coal 17%
37% Natural Gas Coal © 2009 by the Edison Electric Institute.
12% Coal 53% All rights reserved.
64%