JM road ( Call Girls ) Pune 6297143586 Hot Model With Sexy Bhabi Ready For ...
Food Systems Review: Fruits & Vegetables in South Dakota
1. Food Systems Review: Fruits & Vegetables in South Dakota
Chang K-L, Ph.D.; Stluka S, MS, RD, LN; Zastrow M, MS; & Zdorovtsov C, MS
Department of Health and Nutritional Sciences, South Dakota State University, Brookings, SD
South Dakota State University Extension
Abstract
Insufficient intake of fruits and vegetables (F&V) is recognized as a
contributor to rising chronic health issues and medical costs. In 2009,
South Dakota (SD) was ranked last nationally for vegetable consumption
by the Behavioral Risk Factor Surveillance System (BRFSS) survey. In 2013,
BRFSS listed SD as one of five states (along with North Dakota, Iowa,
Louisiana and Mississippi) with daily adult vegetable intakes below 1.4
times/day. SD adults’ median fruit intake was 1.0/day.
This ‘Food Systems Review’ summarizes interrelated factors of three
independent Producer, Grocer and Consumer surveys used to determine
reasons for South Dakotans low consumption and identify opportunities
to increase consumption of F&V. Data sets from consumer surveys were
sorted into “food desert” and “non-food desert” areas (USDA, ERS).
Respondents from all surveys indicated an increase in F&V production,
sales and consumption over pervious three years. Conflicting opinions
were found on how to increase grocer sales; grocers preferred in-store
samples, displays & quick and easy recipes while consumers preferred
coupons. Grocers felt consumers are easily swayed by low cost
convenience foods and were not assured they had in-depth knowledge of
the role F&V play in the prevention of chronic disease. Consumers did not
think food quality, price or household income were reasons to prevent
them from eating more F&V, though a lack of time and knowledge or
capability to prepare and preserve is a problem.
Data gleaned from the study is being utilized to support and guide
programming to increase production and consumption of F&V in SD.
SOUTH DAKOTA STATE UNIVERSITY
Participant Demographic Highlights
• 445 consumers sampled, of which 208 were located in a FD.
• The Consumer Survey deliberately oversampled Native American
consumers with 72.4% of respondents in FD locations Native American
while only 8.9% were Native American in NFD locations.
• Data indicated 71.4% of survey respondents were female.
• Consumers in NFD locations were more likely to be married, were
older, had fewer or no dependents, were less likely to receive WIC or
SNAP, had more education and higher incomes, and were more likely to
be employed than those in FD locations.
• Grocer and Producer respondents closely represent the nature of SD
with a higher density of respondents on the eastern ½ of the state.
• Grocer Survey – 45 respondents with 17 located in FD locations
with those in FD locations being smaller in scale and sales.
• Producer Survey - 44 respondents with 6 located in FD locations
and 83.3% in FD locations being female with those in NFD
locations more evenly distributed between male and female.
Methods
Surveys were developed with information collected from previous studies
conducted by the SD Department of Health to identify factors impacting
SD’s low consumption of F&V. Grocer and Producer surveys were
distributed utilizing existing mailing lists and list serves, and collected via
mail or electronic form. The Consumer survey was personally distributed
in identified communities and either collected on site or mailed in.
Respondents received gift cards worth $40 for the Producer and Grocer
and $5 for the Consumer Survey. The Grocer and Producer Surveys were
conducted May – July, 2012 with the Consumer Survey conducted August
– December, 2012. Data sets were sorted into “food desert” (FD) and
“non-food desert” (NFD). “Food desert areas” in this report are defined as
regional with limited access to healthy and affordable food (USDA, ERS).
ACKNOWLEDGEMENTS
Funding: Centers for Disease Control administered by the South Dakota Department of Health - Kristin Biskeborn, MPH, RD, LN & Larissa Skjonsberg
Implications
Respondents from all three survey’s agreed that there is an opportunity to
increase ‘Locally Grown’ sales through posting signage.
Between grocers and consumers there are conflicting opinions of
marketing methods to increase consumption; grocers preferred in-store
samples, displays and quick & easy recipes and were questionable about
state-wide social marketing techniques, while consumers preferred
coupons.
Consumers and Grocers are generally satisfied with produce quality.
Grocers in FD areas felt that home grown produce impacted overall F&V
sales.
To have a more sustainable business without having to work a 2nd full or
part-time job, growers will likely need to expand or change their
production and markets.
Policy makers and stakeholders need to support expanding the producer
base and level of production, as well as development of distribution
systems and processing facilities.
Production education for producers, as well as education about season
extension, developing value added products and tapping marketing
opportunities will continue to be critical to expand markets.
Only 1 grocer in FD locations was under age 35— as individuals retire,
who will operate community stores which are a source of F&V in
communities, as well as a critical component in community vitality.
Grocers are not assured that consumers had an in-depth knowledge of the
role of F&V in the prevention of chronic disease.
While consumers do not think food quality, price or household income are
reasons to prevent them from eating more F&V, data indicates that a lack
of time, knowledge or capability to prepare and preserve F&V is a
problem.
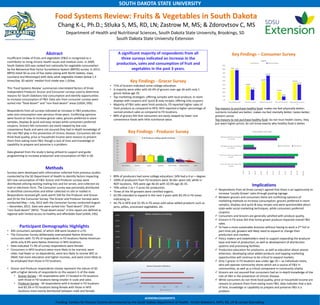
Key Findings - Producer Survey
• 89% of producers had some college education; 34% had a 4-yr + degree.
• 100% of producers from FD locations were 36-66+ years old; while in
NDF locations, 76% were age 46-65 with 10.5% age 26-35.
• 70% utilize 1 to < 5 acres for production.
• Three of the 44 growers were certified organic.
• 65.9% intended to expand in the next 3 years with 83.3% in FD areas
indicating so.
• 44.7% in NFD and 33.3% in FD areas sold value-added products such as
jams, jellies, processed vegetables, etc.
Key Findings - Grocer Survey
• 71% of Grocers indicated some college education.
• A majority were older with 64.4% of grocers over age 46 with only 1
grocer below age 35.
• Top marketing strategies: offering samples with local produce; in-store
displays with coupons and ‘quick & easy recipes; offering only coupons.
• Majority of F&V sales were fresh products; FD reported higher sales of
fresh produce as compared to NFD; NFD reported a higher percentage of
canned product sales as compared to FD locations.
• 80% of grocers felt that consumers are easily swayed by lower cost
convenience foods with little nutritional value.
A significant majority of respondents from all
three surveys indicated an increase in the
production, sales and consumption of fruit and
vegetables in the past 3 years.
Key Findings – Consumer Survey
Top reasons to purchase healthy food: makes me feel physically better;
nutrients included are better; makes me feel mentally better; tastes better;
prevent cancer.
Top reasons to not purchase healthy food: do not trust health claims, they
just want higher prices; do not know exactly why healthy food is better.
0
10
20
30
40
50
60
70
80
VEGETABLES GRAPES HERBS BERRIES TREE FRUITS SHRUB FRUITS NUTS
77.3
25 25 22.9
13.6
6.8
2.3
% of Producers Selling Specific Products
0% 10% 20% 30% 40% 50%
Season Extension Utilization
% of Producers
56.9%
34.1%
20.6%
18.2%
13.6%
11.4% 11.4%
9.1%
0.0%
10.0%
20.0%
30.0%
40.0%
50.0%
60.0%
Where Producers are Selling
79%
36.90%
48.80%
21.90%
45.60%
78%
27.50%
63.70%
9.48%
40.50%
0%
10%
20%
30%
40%
50%
60%
70%
80%
90%
Buy Healthy Food Exercise 2-3x/wk Shop for food 2x/w Shop for food 3x/w Shop whenever I need
to
Habits
Food Desert NonFood Desert
0.0%
10.0%
20.0%
30.0%
40.0%
50.0%
60.0%
70.0%
80.0%
90.0%
100.0%
Feel Fresh Veg. taste better than
canned
Feel Fresh Fruits taste better than
canned
Self-Reported veg. consumption
of 2-3c/day
Self-Reported fruit consumption
of 1-2c/day
Consumption and Taste
NonFood Desert Food Desert