Brooklyn Monthly Market Snapshot - February 2016
•
0 gefällt mir•171 views

Monthly summary of real estate activity in Brooklyn, NY during February 2016.

Empfohlen
Empfohlen
Weitere ähnliche Inhalte
Mehr von Charles Zivancev
Mehr von Charles Zivancev (7)
Kürzlich hochgeladen
Kürzlich hochgeladen (20)
Brooklyn Monthly Market Snapshot - February 2016
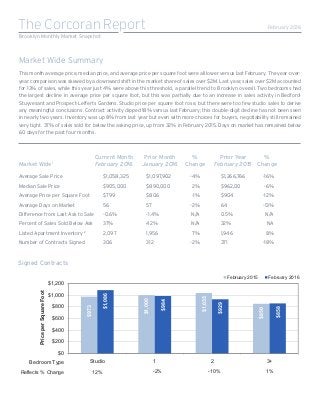
- 1. Signed Contracts Current Month Prior Month % Prior Year % Market Wide1 February 2016 January 2016 Change February 2015 Change Average Sale Price $1,058,325 $1,097,902 -4% $1,266,766 -16% Median Sale Price $905,000 $890,000 2% $962,00 -6% Average Price per Square Foot $799 $806 -1% $904 -12% Average Days on Market 56 57 -2% 64 -13% Difference from Last Ask to Sale -0.6% -1.4% N/A 0.5% N/A Percent of Sales Sold Below Ask 37% 42% N/A 32% NA Listed Apartment Inventory 2 2,097 1,956 7% 1,946 8% Number of Contracts Signed 306 312 -2% 371 -18% $973 $1,000 $1,035 $850 $1,086 $984 $929 $858 $0 $200 $400 $600 $800 $1,000 $1,200 +321oidutS PriceperSquareFoot Bedroom Type February 2015 February 2016 12% -10%Reflects % Change -2% 1% February 2016The Corcoran Report Brooklyn Monthly Market Snapshot Market Wide Summary This month average price, median price, and average price per square foot were all lower versus last February. The year-over- year comparison was skewed by a downward shift in the market share of sales over $2M. Last year, sales over $2M accounted for 13% of sales, while this year just 4% were above this threshold, a parallel trend to Brooklyn overall. Two bedrooms had the largest decline in average price per square foot, but this was partially due to an increase in sales activity in Bedford- Stuyvesant and Prospect-Lefferts Gardens. Studio price per square foot rose, but there were too few studio sales to derive any meaningful conclusions. Contract activity dipped 18% versus last February; this double-digit decline has not been seen in nearly two years. Inventory was up 8% from last year but even with more choices for buyers, negotiability still remained very tight. 37% of sales sold for below the asking price, up from 32% in February 2015. Days on market has remained below 60 days for the past four months.
- 2. 1. Statistics are based on Corcoran Group’s monthly signed contract data, with the exception of “Listed Inventory” and “Number of Contracts Signed”. Statistics include condominium, co-operative and townhouse sales unless otherwise noted. 2. Statistics include condominium and co-operatives only. All material herein is intended for information purposes only and has been compiled from sources deemed reliable. Though information is believed to be correct, it is presented subject to errors, omissions, changes or withdrawal without notice. This is not intended to solicit property already listed. Equal Housing Opportunity. The Corcoran Group is a licensed real estate broker. Owned and operated by NRT LLC. Brooklyn Apartment Listings Apartment inventory rose 8% from February 2015 to 2,097 listings. This is the twenty-first month of year-over-year inventory growth in Brooklyn. Despite the increase in inventory, the number of listings in February was just 2% more than the 13-month rolling average of 2,065 listings. February 2016The Corcoran Report Brooklyn Monthly Market Snapshot $973 $1,000 $1,03 $850 $1,0 $984 $929 $858 $0 $200 $400 $600 $800 +321oidutS PriceperSquareF Bedroom Type 12% -10%Reflects % Change -2% 1% 0 200 400 600 800 1,000 1,200 1,400 1,600 1,800 2,000 2,200 2,400 Feb-15 Mar-15 Apr-15 May-15 Jun-15 Jul-15 Aug-15 Sep-15 Oct-15 Nov-15 Dec-15 Jan-16 Feb-16 NumberofUnitsListed Apartment Listings New Listings