Financial analysis and management
•
1 gefällt mir•336 views

1. Cash Flow statement 2. Permanent & Temporary Working Capital 3. Cash Flow and Common Size Statement 4. EOQ & Safety Stock 5. Return on Equity & Return on Capital Employed

Empfohlen
Weitere ähnliche Inhalte
Was ist angesagt?
Was ist angesagt? (20)
Ähnlich wie Financial analysis and management
Ähnlich wie Financial analysis and management (20)
Kürzlich hochgeladen
Kürzlich hochgeladen (20)
Financial analysis and management
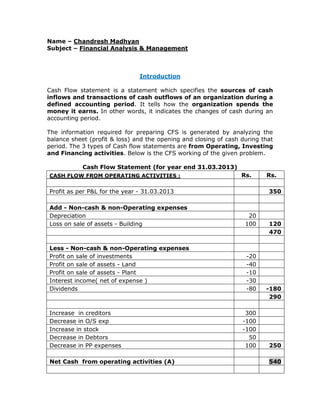
- 1. Name – Chandresh Madhyan Subject – Financial Analysis & Management Introduction Cash Flow statement is a statement which specifies the sources of cash inflows and transactions of cash outflows of an organization during a defined accounting period. It tells how the organization spends the money it earns. In other words, it indicates the changes of cash during an accounting period. The information required for preparing CFS is generated by analyzing the balance sheet (profit & loss) and the opening and closing of cash during that period. The 3 types of Cash flow statements are from Operating, Investing and Financing activities. Below is the CFS working of the given problem. Cash Flow Statement (for year end 31.03.2013) CASH FLOW FROM OPERATING ACTIVITIES : Rs. Rs. Profit as per P&L for the year - 31.03.2013 350 Add - Non-cash & non-Operating expenses Depreciation 20 Loss on sale of assets - Building 100 120 470 Less - Non-cash & non-Operating expenses Profit on sale of investments -20 Profit on sale of assets - Land -40 Profit on sale of assets - Plant -10 Interest income( net of expense ) -30 Dividends -80 -180 290 Increase in creditors 300 Decrease in O/S exp -100 Increase in stock -100 Decrease in Debtors 50 Decrease in PP expenses 100 250 Net Cash from operating activities (A) 540
- 2. CASH FLOW FROM INVESTING ACTIVITIES : `- Sale of Land - net -260 `- Sale of Building - net -400 `+ Sale of plant - net 190 `+ Dividends received 80 `+ Interest received ( net of expenses ) 30 `- Net Investments (Purchase/Sale) -80 Net Cash from investing activities (B) -440 CASH FLOW FROM FINANCING ACTIVITIES : `+ Proceeds from issue of Share Capital 400 ` - Repayment of Debentures -200 `+ Proceeds from LT Loan 200 Net Cash used in Financing activities (C) 400 Net Cash & Cash Equivalents (A+B+C) 500 Cash & Cash Equivalents at the beginning of the year 630 Cash & Cash Equivalents at the end of the year 1130
- 3. a.) Permanent & Temporary Working Capital An organization (business) has to go through different phases of operating cycle and does not end business after generating the revenues (cash) from customers. It is continuous process for which organizations require working capital. However, the amount of capital required varies from organization to organization and changes from time to time and is not constant. Permanent Working Capital Permanent working capital refers to the minimum investment in an organization in the form of current work (tasks), inventory of raw materials, finished goods and book debts to facilitate uninterrupted functioning of an organization. This minimum level of capital is called the permanent working capital. This capital requirement has to be met permanently like the firm’s fixed assets. Temporary Working Capital On other hand, any amount of capital required over and above permanent working capital is referred to as the fluctuating or temporary working capital. It is the excess capital required over the permanent working capital. Temporary Working capital = Net Working Capital – Permanent Working capital Differences 1.) Organization’s working capital requirements fluctuate/change depending upon the phase of operating cycle and seasonality of product demands, which is not case with permanent capital. Temporary working capital is further categorized as – a.) Seasonal working Capital – required to meet seasonal demands b.) Special working capital – required to meet special demands Temporary working capital differs from permanent working capital because of its cyclicality and it keeps on fluctuating. Because of this factor, temporary working capital requires a different source of financing than permanent working capital. 2.)While permanent working capital is usually financed through a long- term financing source such as equity capital and debt, temporary working capital is often financed by short-term funds. 3.) There are various reasons for change in working capital required by an organization. Some of them are changes in Sales & Operating or
- 4. Technological Changes. These factors impact permanent capital for growing business but remain intact for set business. While temporary capital keeps on changing for any business. 4.) During recession cycle, company need not invest in new raw materials, finished products or current work because of decrease in sales. On the other hand, during peak cycle, companies need higher working capital to support large sales. This is clearly depicted in the figure below for stable business temporary working capital changes with season and special events but permanent working capital is fixed for stable business. 5.) Organization has to draw a distinction between temporary and permanent working capital to align their financing properly. The position of temporary working capital is needed to meet fluctuations (seasonal changes) but change in permanent capital is for long overhaul. Both kinds of working capital are necessary to facilitate the smooth running of business (process) of an organization. Organization should maintain optimum level of working capital as unnecessary blockage of funds will lose opportunity of return and lesser working capital will harm the flow of operational activities.
- 5. b.) Cash Flow and Common Size Statement Organization’s balance sheet which has profit and loss accounts are the basic financial statements of any business. They do not show cash flows associated with period of operations, investing or financing activities. Also these statements do not show relationship between different items of balance sheet with total assets or liabilities. Cash Flow Statement (CFS) It is a statement which specifies the sources of cash inflows and transactions of cash outflows of an organization during a defined accounting period. It tells how the organization spends the money it earns. In other words, it indicates the changes of cash during an accounting period. The information required for preparing CFS is generated by analyzing the balance sheet (profit & loss) and the opening and closing of cash during that period. Common Size Statement On the other hand, common size statement states the relation of individual items of cash flow statement or other statement (balance, income) to the total in the form of percentage. Differences 1.) In common size Cash flow statement, the total cash (inflow/outflow) is treated as common base and on the basis of it the percentage of other cash (inflow/outflow) items (on statement) is calculated. The total percentage of all the individual items should come to 100% which represents the total cash. While Cash flow doesn’t follow such calculations. 2.) The importance of Cash flow statement arises from the information that it contains which is objective and hence it is more reliable and credible as compared to other financial statements. The amount of cash flow is not affected by subjective findings that are usually made in expenses, revenues etc. In common size statement, the process of converting the value of line items in the cash flow statement into percentages helps in vertical analysis of the statement that is comparison of the value of one line item with another. This type of analysis is called vertical analysis. It helps user get better understanding of the relationship among two or more items on statement. Example - overhead expenses and sales
- 6. 3.) Cash flow statement can be prepared by two methods namely – Direct method and In-direct method. The preparation of CFS is must under the Accounting Standard (AS-3) as prescribed by Institute of Chartered Accountants Of India (ICAI). Whereas there is no such mandate for Common Size statements as it is used mostly for organization internal purpose or comparison between two companies. 4.)CFS helps organization with information related to Framing of Financial policies, knowledge of short-term solvency, Cash Inflow and cash position & requirements, dividend policy etc. The 3 types of Cash flow statements are from Operating, Investing and Financing activities. The major application of common size cash flows is to determine the quantum of allocation of cash for each line item. For instance, converting the sub-totals for net outflows in operations, investing, and financing as a percentage of the total cash allows determining the proportion of cash used for these purposes. 5.) Common size statements also help in horizontal analysis or comparison of the two different companies for the same period. These statements help in removing bias when comparing operational, investing or financial cash flows of two different companies of different size. Example - Suppose Company A has total revenue of Rs. 10000 and reinvests Rs. 1000 only whereas company B with total revenue of Rs. 50,000, reinvests Rs. 2000. Although company B reinvests more amount but the % it reinvests is only 4% as compared to Company A which reinvests 10% percent of revenue. 6.) Cash flow statement has its own set of limitations – a.) It is not complete substitute of Income or Fund flow Statement b.) Non-Cash transactions are ignored in CFS c.) It presents misleading comparisons between inter-company d.) It ignores the Accrual concept of Accounting There are no such limitations for common size statements. 7.) Common sizing of the statement is easy. In case of cash flow common sizing, one needs to simply add up all the cash inflows/outflows and calculate the percentage value of each line item of the total cash inflow/outflow. Example – Suppose Interest is Rs. 2800 and the total cash inflow is Rs. 10,000. Common size value for interest is (2800/10,000)*100 = 28%. Thus 28% of the net income for that particular period comes from interest.
- 7. The best part it is unit free and ignores the size differentials. It also helps highlight inconsistencies arising from data error. Same is not the case with Cash flow statement. c.) EOQ & Safety Stock Economic Order Quantity Economic order quantity refers to the quantity of order that minimizes total inventory holding costs and ordering costs of an organization. This method of determining the order quantity is also called Wilson Formula. The EOQ technique is applicable only when demand for a product is constant over the year and each new order gets delivered in full when inventory level reaches zero. Safety Stock Safety Stock which is also termed as buffer stock refers to level of extra stock that is maintained by an organization to mitigate the risk of shortfall in raw materials or any other material required for finished goods. It is maintained to tackle the uncertainties in demand and supply which ensures no disruption in business operations and work is carried out according to the plan. Safety stock is calculated using below formula – Safety Stock = (Maximum Daily Usage − Average Daily Usage) × Lead Time Differences 1.) An organization needs to determine the optimal number of units to order (EOQ) so that it can minimize the total cost associated with the storage, purchase and delivery of the product. Each order placed has its fixed cost which is independent of number of units ordered. And also, there is a cost associated with each unit held in storage which is commonly known as holding cost. While Safety stock becomes savior when there is uncertainty in supply, demand or any other yield. If a company is new or launches new product, safety stock is used as strategic tool till the company is able get their demand forecast accurately. It acts like a backup plan (insurance) for the company. The lesser accurate forecast, the more safety stock is required. 2.) The parameters required to calculate EOQ (solution) are the fixed cost to place the new order, the total demand for the year, the purchase cost for each item and the storage cost for each item per year. Further, total cost also gets changed (affected) with the number of times an order is placed. While calculating EOQ, there are certain assumptions bases which this model works. These are -
- 8. a.) Ordering cost is constant b.) Rate of demand is known and evenly distributed in an year c.) Lead time is fixed d.) The purchase price of product (item) is constant e.) Replenishment happens instantaneously f.) Only one product is involved While for calculation of Safety Stock there are no such assumptions. 3.) EOQ is the quantity to order at which the sum of ordering cost and holding cost is at its minimum. These costs will be equal to one another at the minimized cost point and is one of the oldest classical production scheduling models. Safety Stock can be determined using Material Requirement Plan (MRP) or the latest trend is to use ERP (Enterprise Resource planning) to get safety stock value according to business plan. 4.) Safety Stock strategy is applicable for organizations who need lead time to procure raw materials and then process them to generate finished products/goods at the right time of demand. It helps prevent stock-out situation when there is upward trend in demand of customer. While EOQ is applicable for all type of organizations. 5.) The various parameters used to determine the EOQ and the formula is – • = purchase price, unit production cost • = order quantity • = optimal order quantity • = annual demand quantity • = fixed cost per order, setup cost • h = annual holding cost per unit, also known as carrying cost Economic Order Quantity = Safety stock calculation depends on the listed factors – Demand Rate, Lead time, Service Level & Forecast Error. The formula is – Safety stock = {Z*SQRT (Avg. Lead Time * Standard Deviation of Demand^2 + Avg. Demand^2 * Standard Deviation of Lead Time^2)} where Z = NORMSINV function (Service Level) 6.) It is very important for an organization to calculate and maintain the right balance of safety stock. Keeping too much of safety stock can lead to high inventory costs. Also, finished products which are stored for too
- 9. long a time will get spoiled, expired or damaged during the warehousing process. On the other hand, keeping too little of safety stock can result in loss of product sales and a higher rate of dissatisfied (turnover) customers. d.) Return on Equity & Return on Capital Employed Return on equity (ROE) and return on capital (ROC) employed are almost similar concepts but they have slight difference in their underlying formulas. Both of them are used to interpret the profitability of a company and well known benchmarks used by investors and institutions to decide between investment options. Return on Equity (RoE) Return on equity measures an organization’s profit as a percentage of the combined total worth of all ownership interests in the company. Example - Suppose an organization's profit is Rs. 5 million for a period and the total value of the shareholders' equity in the organization equals Rs. 100 million, then return on equity will be equal to 5% (5 million divided by 100 million in equity). Return on Equity = Net Profit after interest and tax X 100 Equity shareholder funds Return On Capital Employed (RoCE) On other hand, Return on capital employed has the same formula as return on equity but with the additional component i.e. it also includes the total value of debts owed by the company in the form of loans and bonds. Example – Suppose the organization stated in the above example also owes Rs. 50 million in debts, the return on capital will be 3.33% (5 million divided by the sum of Rs. 100 million in equity and Rs. 50 million in debts). Return on Capital Employed = Net Profit before interest and tax X 100 Capital Employed Where capital employed = Net Fixed Assets – Working Capital 1.) Return on Equity consists of two things – returns generated by the organization on the money raised by the shareholders and the returns generated by the organization on the reinvested earnings. While Return on capital employed represents the return generated by an organization on its total capital employed which includes debts. 2.) Return on Equity (RoE) is calculated on Net profit after interest and tax whereas Return on Capital (RoCE) is calculated on Net profit before interest and tax.
- 10. 3.) Return on Capital (RoCE) employed is a good measure to estimate operational efficiency of a company - to understand how much operating profit (earnings before interest and tax) an organization is able to generate from the total capital employed. It also helps in investment decisions by management and planning the capital structure of the organization. On comparing two organizations if RoCE is same then RoE can be used to analyze as the composition of total capital employed will be different and will give the profitability of the capital invested. 4.) An organization is considered to be good if it has better RoCE i.e. it employs less capital to generate the same operating profit and also has a better RoE i.e. uses less shareholders fund to gain profits. 5.) If an organization thinks that it can increase RoE from new projects/products, it should prefer to pay out lesser dividends to shareholders and deploy most of its profits to fund new projects. On the other hand, if it does not have new projects on hand, it should choose to pay out more dividends to the shareholders. Ideally, in an organization, RoCE should be greater than the rate at which company is borrowing. Better RoCE means the efficiency of operations (management) of an organization in holistic manner. It depicts how efficiently management has used the investments in the company to generate profits for the business.