How to finance the biomedical research with securitization techniques, a prac...
Biotechnology Publication
1. January 2013 I Volume 19 I Number 1 7
INTRODUCTION
R
ecent patterns suggest that the biotechnol-
ogy industry, and biotechnology investors, may
be entering a new financial era; gone are the days
of loose venture capital purse strings and generous buy-
out offers from the “majors.” Rockoff and Tam1
note that
“the gravy days are over.” Once a “darling” of investors
and global pharmaceuticals, newer startups are having to
more convincingly show their muster than was the case
a decade or less ago. In this light, factors contributing
to the valuation of biotechnology firms are key. Given
this, we examine the influence of such issues as research,
clinical success rates and board composition as they
relate to firm value.
Some of our findings are unsurprising, while others
are more noteworthy: We find that the advancement of
drugs in the pipeline is associated with increased firm
values, and that the failures of drugs in testing are seen
alongside declinations in those values. A more note-
worthy finding is seen where we observe no better per-
formance for companies engaged in partnerships or
alliances than is observed for firms striking out on their
own. Extending prior research, we find that the presence
of medical doctors on the boards of directors is associated
Original Article
Biotechnology valuation and
governance: Drug development and
board of directors composition
Received: May 24, 2012; revised: November 27, 2012
Chad Houston
is a financial analyst at the U.S. Small Business Administration
J. Edward Graham
is a professor of finance, Department of Economics and Finance, at the University of North Carolina Wilmington
Peter Schuhmann
is a professor of economics, Department of Economics and Finance, at the University of North Carolina Wilmington
ABSTRACT
We examine the valuation of biotechnology firms and measure firm value relative to the firms’ drug development pipelines,
alliances with other firms, and the varied composition of those firms’ boards of directors. Unsurprisingly, the advancement
of drugs in the pipeline is associated with increased valuation, and the failure of drugs in testing is found to have negative
impacts.Ourfindingsdonotsupportthenotionthatcompaniesengagedinpartnershipsorallianceshavebetterperformance.
Extending prior research, we find that the presence of medical doctors on the boards of directors is significantly positively
associatedwithprice-to-bookratiosandfirmvalue.Drugapprovalsseemedlesslikelyforsmallcapfirms;thisoutcomeislikely
the result of small cap firms with more promising prospects being acquired, and exiting “small cap” status. Smaller firms have
lower approval rates—they have fewer drugs in the pipeline—and the risk of these smaller firms is diversified when they are
combinedwithlargerfirmswhoseresearchisspreadacrossmanymoredrugs.Weobserveahighernumberofdrugapprovals
for AIDS and cancer. We also discover a modestly higher approval rate alongside a higher proportion of financiers—such as
hedge fund managers and investment bankers—on biotechnology boards. The investor might use our discoveries to better
project a firm’s success in drug approvals and equity returns; the biotech manager could use our findings to better anticipate
marketresponsestochangesinthecompany’sboardorresearch;theregulatorcouldremembertolimitthepoliticalinfluences
ondrugapprovalsbyrecallingthepotential“favoring”ofonediseaseoveranotherdependinguponthepoliticalclimate.Thus
ourfindingsareimportanttotheinvestor,thebiotechnologymanagerandtheregulator.
Journal of Commercial Biotechnology (2013) 19(1), 7–23. doi: 10.5912/jcb.561
Keywords: valuation; board composition; drug development; governance
Correspondence: Peter Schuhmann. University of North
Carolina Wilmington, US. Email: schuhmannp@uncw.edu
2. Journal of Commercial Biotechnology http://www.CommercialBiotechnology.com8
with higher price-to-book ratios and firm values. Drug
approvals seemed less likely for small cap firms; we
believe this outcome is the result of small cap firms with
more promising prospects being acquired, and exiting
“small cap” status. Among other results, a higher num-
ber of drug approvals among such targeted diseases as
AIDS and cancer are observed; modestly higher approval
rates are observed in concert with a relatively higher pro-
portion of financiers—such as hedge fund managers and
investment bankers—on biotechnology boards. This is
especially meaningful; hedge fund managers and invest-
ment advisors would be expected to appreciate whether a
drug-development “team” is more or less likely to create
value for an investor. However, taking this set of “skills”
a step farther leads to a surprising result—that invest-
ment advisor seems better able, as well, to influence the
selection of the more promising drugs for development
in the first place.
The sector has a storied past, with a plethora of
factors contributing to the success, and value, of par-
ticipants in the biotechnology marketplace. The bio-
tech industry emerged in the 1970’s. NAICS data and
Plunkett Research, Ltd report that this sector wit-
nessed dramatic growth, from less than $10 billion in
global sales for publicly held biotech firms in the early
1990’s to over $80 billion in 2010. And this is a research
intensive industry; near the end of 2011, according to
MedTrack,2
there were 10,000 or more “unique prod-
ucts” under development, with many of these products
being drugs in various stages of development. There
were over 400 drugs “being tested to treat more than
100 …” diseases, including various cancers, cognitive
disorders, heart disease, diabetes, multiple sclerosis,
AIDS, and arthritis.3
A review of BIO4
describes the
work of 180,000 employees working towards the com-
bined biotechnology goals of both creating value for
investors and discovering remedies for various mala-
dies. Drug breakthroughs may generate considerable
value for investors, but most research spending does
not result in a drug reaching the market.
Pisano5
notes that most biotechnology companies
do not generate positive cash flows or profit. Thus, tradi-
tional financial or economic theory that estimates value
as a function of future cash flows is compromised; yet,
Bratic et al.6
and Villiger and Bogdan7
remind us that the
valuation of biotechnology firms is important for capital
and investment decisions, and in the division of any value
the firm creates between investors and management.
The purpose of this research is to examine—in a
new light and with a previously unexamined set of
data—factors that impact biotechnology firm value.
These factors include the transition of drugs through
various phases of clinical trials, the prior experiences of
the firms’ science and management teams in achieving
success with drug development, the diversification of
the drug development pipeline, and the firms’ alliances
and partnerships. Finally, extending the extant research,
this study considers the role played by the composition
of the firms’ board of directors in describing increases in
firm value, and in anticipating increases in R&D spend-
ing; the likelihood of success with drug approvals is
probably framed by these same factors, and tests for that
are provided, as well.
Literature that has examined related topics over the
past couple of decades is considered next, followed by a
description of our data to reveal the importance of such
factors as the firm’s investment in R&D and the composi-
tion of its board of directors in describing the firm’s later
success, in creating shareholder value and in securing
drug approvals. We construct a set of models to test these
ideas; results are reported. We then provide a summary
along with some concluding remarks.
BACKGROUND AND LITERATURE
REVIEW
Industries that are characterized by significant invest-
ments in research and development make traditional
valuations difficult to apply. Impediments in biotechnol-
ogy valuation stem from the large initial investments typ-
ically required to develop new pharmaceutical products,
coupled with the inherent uncertainty that such efforts
will yield marketable products; cash flows typically do
not occur until years after initial investments, and the
application of traditional valuation models is compro-
mised. A review of Microsoft’s performance prior to
its initiation of a dividend payment in the early 2000’s
is telling; there, stock price and company value soared
through the late 1990’s in the absence of distributions
to shareholders, yet corporate profits and cash accumu-
lations at the company level were clearly apparent. For
the high-tech firm considered here, not even those earn-
ings—much less dividend payments upon which some
valuation models depend—are evident.
DiMasi et al.8
and Xu9
affirm that research and dev
elopment can be time-consuming, often lasting a decade
or more. Estimates of costs per drug are substantial, but
vary considerably. Bratic et al.6
estimate that sixty per-
cent of drugs currently in the market required over $100
million in development costs. This earlier research esti-
mates cash outlays for each successful drug range from
$207 million to nearly $900 million; Morgan et al.10
report that the capitalized costs per drug may be as high
as $1.8 billion. DiMasi11
notes that as new drugs move
through the development pipeline, these sunk costs may
actually increase, but the probability of garnering FDA
approval improves.
3. January 2013 I Volume 19 I Number 1 9
There are four phases of clinical trials for prospec-
tive drugs, necessary for the drug’s approval by the FDA.
Phase 1 (or I) trials are the earliest and least structured,
and are typically tailored for a cohort of a few dozen (or
less) patients that have exhausted traditional treatment
options. If non-human laboratory testing has revealed
that some new drug or treatment may have potential with
humans, the first tenuous steps towards ascertaining safe
dosage levels and side effects are taken with the Phase 1
trials. If a new treatment passes muster with the Phase
1 trial, a second phase may be initiated. The Phase 2 (II)
trial involves a much larger set of test subjects, further
examines dosages and side effects, and often allows the
prospective drug to be tested alongside a placebo and
contrasted with existing treatments. If positive results
are generated with the Phase 2 trial, a Phase 3 (III) clini-
cal trial may be conducted, if the company conducting
the trials can justify the often-enormous costs of this
third phase. To iron out ideal doses, clearly portray
potential side effects, and determine the appropriateness
for differing populations (children, adolescents, adults,
those suffering from other maladies, citizens of differ-
ent countries, the thin, the overweight, etc.) of the new
treatment, the Phase 3 trial may involve thousands of
patients, and cost tens of millions of dollars. Differences
in success rates for the given populations may be small,
and this phase needs to begin to anticipate those varying
success rates prior to FDA approval. Once the FDA has
issued a license for a new drug or treatment, Phase 4 (IV)
trials are conducted to discover long-range side effects
and risks and the suitability of the new drug or treatment
for wider populations over a longer period of time.
Using a real options framework, Villiger and
Bogdan7
show that drugs in different phases of clinical
trials have different values depending upon the uncer-
tainties attaching to each drug’s development. Villiger
and Bogdan12
note that due to breakdowns in efficacy,
safety, or economics, many drugs never make it to mar-
ket. In fact, and according to Bratic et al.6
, only one in
five thousand compounds that enter preclinical research
and development make it to human testing, and then
only one in five garners FDA approval. Pisano5
observes
that, historically, between 10 and 20 percent of drugs that
begin clinical trials will become commercially viable.
The development status of a firm’s drug pipeline
has substantial implications for firm value, as it signals
the likelihood that the firm will convert R&D expendi-
tures into viable commercial products. However, unlike
a retailer’s metric of same store sales, the drug develop-
ment pipeline of one company is not easily compared
to another. Hence, the type, number, and development
stage of the drugs in each company’s pipeline are ger-
mane to valuation.
Competition motivates rapid development, as drugs
under development have less value once a competitor’s
similar drug is FDA-approved. Xu9
reports that rapid
progress through the development process reveals that
development is going well; a product is nearing com-
mercialization and is associated with higher valuations.
However, given the significant costs of development
noted above, rapid progress implies a rapid “burn” or
depletion of available cash. Bratic et al.6
found 33% of
the biotechnology firms in their sample had less than
one year of cash, with 50% having less than two years.
Given the multi-year development witnessed with most
drugs, alliances and partnerships with larger more estab-
lished companies could provide access to needed liquid-
ity, particularly in the latter stages of development. In
this vein, and according to the Biotechnology Industry
Organization4
, biotechnology companies struck 417 new
partnerships in 2007 with pharmaceutical companies
and 473 deals with fellow companies. Baum et al.13
and
Agnew14
note that these alliances facilitate the transition
to production and enhance the likelihood of success for
new disease therapies. Xu et al.15
hold that these alliances
may also serve to validate product viability to investors,
contributing to firm value.
Also important is the composition of the board of
directors. As noted in Pisano5
, a biotechnology company
presents a unique set of challenges for management and
investors; with uncertain cash flows broadcast years into
the future, traditional financial modeling falls short.
The necessity to manage persistent risk and uncertainty,
coupled with a critical need for integration between the
disparate disciplines of business, science and medicine
suggests that boards may require a special backgrounds
and expertise. The presence of medical doctors and
financiers on boards may impact spending on R&D and
may influence alliances, later influencing firm perfor-
mance and value.
A broad literature examines the relationships
between corporate governance and firm value. Vance16
and Pearce and Zahra17
consider the functional back-
grounds of directors. Barnhart and Rosenstein18
find
that smaller boards generally outperform larger boards,
while Finkle19
concludes that there is a quadratic rela-
tionship between the number of board members and
firm valuation—value increases with board size up to a
point and then diminishes. While larger boards of direc-
tors may allow for a more diverse array of knowledge
and perspectives, larger boards suffer from the adverse
effects of large group dynamics such as free-riding and
fractionalization.20,21
Board independence is another area of uncertainty.
Jensen and Meckling’s22
seminal work notes that most
corporate managers are not shareholders but agents of
those owners. As agents, they have little or no personal
4. Journal of Commercial Biotechnology http://www.CommercialBiotechnology.com10
wealth at stake and often act in their own self interests.
Jensen and Meckling’s work has encouraged a number
of studies of the behavior of managers, and the impor-
tance of board composition in assuring the enhancement
of firm value. For example, non-management or outside
directorships seem to influence value. Schellenger et al.23
find a direct positive relationship between outside direc-
tor’s representation on the board and a risk-adjusted
measure of stock price performance. On the other hand,
earlier work by Vance24
finds that better financial perfor-
mance, as measured by net income, sales, and owner’s
equity, is associated with a high proportion of inside
directors. Pfeffer25
suggests the existence of an optimal
insider-outsider ratio. And Dalton et al.26
and Bosner27
find that board composition in terms of insiders, out
siders, and CEO/Chair duality has virtually no effect on
firm performance.
In a study of Canadian firms, McIntyre et al.28
find that firm performance as measured by Tobin’s Q
is highly correlated with the board levels of experience,
team size, variation in age, and team tenure. Among
other results, they suggest that peers of similar age work
better in increasing firm value, than boards comprised of
generational age differences. Markarian and Parbonetti29
classified board members according to four typologies
developed by Baysinger and Zardkoohi30
: insiders, busi-
ness experts, support specialists, and “community influ-
entials.” They find that a higher proportion of support
specialists on the board is associated with larger R&D
expenditures per employee, but they do not discover
such relationships for the other three board typologies.
Drug therapies designed for specific conditions
(e.g. cancer, diabetes) might also create value. Targeting
high-profilediseasesmaybeapromisingstrategy.Among
the diseases targeted by sample firms, cancer, cognitive
disorders, pain, heart disease, diabetes, and AIDS have
the greatest number of drug indications under dev
elopment. Market valuations of these R&D investments
may be associated with high market valuation due to the
potential for substantial new revenues. This is especially
true for drugs in the advanced stages of development,
and those that target multiple high-profile diseases.
DATA
The importance of several factors influencing company
valuation is measured. Drug development success, stra-
tegic alliances, board composition, pipeline diversity
and specific disease targets are considered. The sample
includes 163 biotechnology companies with market capi-
talizations greater than $30 million over the period from
the first quarter of 2007 to the first quarter of 2009. The
sample consists of 116 firms with less than $1 billion in
market capitalization and 47 worth over $1 billion.
Firms in the sample have Standard Industrial
Classification (SIC) codes between 2830 and 2836. These
firms discover, develop, produce, and sell drugs for the
treatment or diagnosis of human diseases; 199 firms meet-
ing this criterion were initially identified; 29 firms were
omitted due to incomplete or inaccessible financial data
and seven firms were excluded due to incomplete or inac-
cessible clinical trial data. Financial data were collected
from Bloomberg, clinical trial and strategic alliance data
were collected from Inteleos, and board of director infor-
mation was gathered from company websites.
Firms in the sample have an average of more than
five drugs in phase II clinical trials and more than three
in phase III trials. Phase II appears to be a critical turn-
ing point in the drug development pipeline, as firms have
modestly more drugs discontinued in phase II, than in
phases I and III combined.
Disease indications are grouped into seven cat-
egories: cancer, cognitive disorders, pain, heart disease,
diabetes, AIDS, and bone disorders. The total number
of drug indications under development by firms in the
sample, in each of these categories is, respectively, 842,
199, 106, 102, 99, 67, and 48. Cancer therapies dominate
the pipeline for firms in the sample with a mean of 5.17
drugs per company. Firms also have an average of 1.22
drugs that target cognitive disorders and an average of
0.65, 0.63, and 0.61 drugs for pain, diabetes, and heart
therapies.
Board members are classified into five categories:
medical doctors, business experts, scientists, financiers,
and support professionals. They are classified as medi-
cal doctors regardless of whether or not they are still
practicing. Business experts are consultants or manag-
ers of biotechnology/pharmaceutical companies. If the
director possessed specialized knowledge outside of the
biotechnology industry (lawyers, accountants, chemical
engineers, etc.) they are classified as support. Scientists
are those who hold PhD’s. Financiers belong to a venture
capital group, hedge fund, or investment bank.
The typical size of boards of directors in the sample is
approximately eight individuals, with an average of 3.45
business experts, 1.47 financiers and 1.3 medical doc-
tors per board. There is an average of nearly seven males
in each group and roughly 42 percent of the boards in
the sample are chaired by the CEO. On average, boards
contain approximately 1.5 members who are current or
previous employees of the company.
The average change in market capitalization for firms
in the sample over the time period Q1 2007-Q1 2009 is
-3.28% with a median of -43.69%, indicative of the reces-
sionary climate during the sample period. Yet, on aver-
age, changes in research and development expenditures
5. January 2013 I Volume 19 I Number 1 11
are 26.12%. Price-to-book ratios at the end of the sample
period exhibit considerable variation across firms.
Pipeline success is measured, as in Dimasi11
using
the probabilities of drugs passing through the various
stages of development, and calculate the percent of a
firm’s total pipeline that is expected to be FDA approved.
The total number of drugs in the pipeline expected to be
FDA approved is estimated as:
(1) E[Approved Drugs] = Prclinic (n1
)*.1936
+ PhaseI(n2
)*.2391 + PhaseII(n3
)*.3188
+ PhaseIII(n4
)*.6375 + Pending(n5
)*.75
Where n1
– n5
are the number of drugs the firm has at
the associated stage of development.
The percentage of the total pipeline that is expected
to be FDA approved is estimated as:
(2) E[Approval Rate] = E[Approved Drugs] /Total
drugs in the pipeline
Accordingly, a drug in the preclinical trial has a
probability of 19.36% to pass the FDA final approval; this
probability is 23.91% for a drug in Phase I trial, 31.88%
for a drug in Phase II trial, 63.75% for a drug in Phase III
trial and finally, 75% for a drug in the final FDA approval
process.
Using the function above, firms in the sample expect
to have 5.47 drugs FDA-approved, on average (with a
median of 2.34). This suggests that on average roughly
33% of drugs in the associated pipelines can be expected
to be approved.
To quantify pipeline diversity, the number of drug
indications in each of the phases of development and
phases of discontinuance is measured, extending the
measures of diversity used in Guo et al. 31
and Xu et al.15
Those measures accounted for differences in expected
returns across target diseases. Guo et al.31
used the total
number of drugs being developed by a firm to assess
pipeline diversification; Xu et al.15
measured the level of
diversification using the number of different drug ther-
apies the firm had in development. To account for the
importance with alliances and mergers, we measure the
number of alliances per firm that were in effect at the
end of the most recent pipeline development phase; the
pipeline report revealed firm alliances.
Table 1: Variable names and definitions
Board of Director Variables
Director Number of directors on board of directors
Medical Number of medical doctors on the board
BsExpert Number of business experts on the board (consultants, managers, VP’s, CEOs, etc of healthcare,
pharma, or biotechnology companies)
Finance Number of financiers on the board (bankers, hedge fund managers, institutional investors,
venture capitalists)
Scientists Number of scientists on the board (scientists, PhDs)
Support Number of support professionals on the board (attorneys, accountants, etc)
CEODual = 1 if CEO is also the chairman of the board, = 0 otherwise
Male Number of males on the board
PhDFinance Number of financiers who hold PhD’s
PhDExpert Number of business experts who hold PhD’s
Insider Number of current or previous employees of the company that reside on the board
Performance Variables
MktCap0709 The change in the market capitalization of the company from Q1 2007 to Q1 2009
RD0709 The change in research development expenditures from Q1 2007-Q1 2009
PBratio Price-to-book ratio as of Q1 2009
PTBratio Price-to-tangible book ratio as of Q1 2009
6. Journal of Commercial Biotechnology http://www.CommercialBiotechnology.com12
A full list of variable names and definitions is pro-
vided in Table 1. Descriptive statistics are shown in
Table 2. The size and composition of the boards of direc-
tors are considered, along with the number of doctors,
financial experts, scientists, PhD’s, and insiders on the
boards. Over the period of the study, from the first quar-
ters of 2007 through 2009, prosaic measures of market
capitalization, research expenditures, and price-to-book
ratios are gathered. Clinical factors include measures
of the numbers of drugs in various testing phases, the
successes and failures of drugs in the various company
pipelines and the diseases targeted by the drugs in the
pipeline. In Table 2, the average board has seven or eight
members, most of whom are male and one or two of
which are founders or other insiders. Three or four of
the board members are “experts” in the industry; those
experts might also be founders or insiders. The typical
firm has between three and six drugs in various stages
of development; some have as few as one, and some
over 100, using the generous descriptions used by firms
when identifying the different compounds they have in
various stages of testing; the drugs being developed are
designed to treat a panoply of ailments, from AIDS to
cancer, heart disease, cognitive disorders, diabetes and
pain.
METHODS
Relationships between the several explanatory vari-
ables and performance and valuation are examined.
Explanatory variables include measures of drug devel-
opment success, strategic alliances, board composition,
pipeline diversity and specific disease targets. Given the
wealth of research describing a relationship between
firm size and market performance, we created a small
Table 1: continued
Drug Pipeline Variables
Prclinic Number of drugs in preclinical trials Q1 2009
PhaseI Number of durgs in Phase 1 clinical trials Q1 2009
PhaseII Number of drugs in Phase 2 clinical trials
PhaseIII Number of drugs in Phase 3 clinical trials
Pending Number of drugs pending FDA approval
Approved Number of drugs approved since 1998
PhaseIV Number of drugs in post-marketing surveillance trials32
since 1998
DsconPre Number of drugs discontinued during preclinical trials since 1998
DisoconI Number of drugs discontinued during phase 1 trials since 1998
DisconII Number of drugs discontinued during phase 2 trials since 1998
DisconIII Number of drugs discontinued during phase 3 trials since 1998
DisconPA Number of drugs discontinued during the pending approval stage since 1998
Suspend Number of drugs in development temporarily put on hold by the company
Withdraw Number of approved drugs pulled from the market (e.g. Vioxx)
Licensed Number of drug indications approved and that are being marketed and/or were developed with
more than one firm
Solo Number of approved drug indications that were developed and are marketed by one company
DrugAppr Number of drug indications approved and on the market since 1998
AIDS, Bone, Cancer,
Cognitive, Diabetes,
Heart, Pain, Other
Number of drug indication therapies in development targeted at each ailment as of Q1 2009
8. Journal of Commercial Biotechnology http://www.CommercialBiotechnology.com14
cap indicator variable to control for differences in mar-
ket capitalizations. A differentiation was made between
companies that exhibited positive growth in market cap-
italization over the period of study and those that expe-
rienced a decline.
An array of measures to proxy for performance
and valuation were employed, including price-to-book
ratios, changes in market capitalization, changes in RD
spending, the number of expected drug approvals and
the expected approval rate. The price-to-book ratio and
changes in market capitalization served as measures of
changes in firm size or value. Because data were collected
during a recessionary period, changes in capitalization
for the sample may not be indicative of firm success.
Changes in research and development expendi-
tures over the period of the data (first quarter of 2007
to first quarter of 2009) influence the drug development
pipeline; this simply assumes that higher RD expen-
ditures are indicative of more drugs in a company’s
pipeline and progression through the pipeline toward
commercialization.
Finally, it is hypothesized that firms with a larger
number of expected drug approvals and greater drug
approval rate will have more favorable measures of suc-
cess and higher valuations. Indeed, drug approvals can
be viewed as both a quantifiable measure of success and
a causal factor in explaining other valuation measures.
However, endogeneity may confound the empirical esti-
mation of the effect of pipeline success on firm perfor-
mance and valuation. For example, higher expenditures
on research and development may lead to larger number
of total approvals or a higher probability of pipeline suc-
cess, yet as drugs near the approval stage, RD spending
may increase. This potential for endogeneity prompts the
use of an instrumental variables approach when using
one of these variables as an explanatory factor in model-
ing the other.
RESULTS
Results in Table 3 are fairly straightforward; the price to
book ratio is positively and significantly related to having
a board chairperson that is also the CEO; the number
of insiders and doctors on the board share this relation-
ship. Echoing an extensive literature, the smaller firm is
expected to outperform the larger one. Squared insider
and doctor variables are also positive; this suggests that
the importance of those parties being on the board,
towards the enhancement of firm value as measured by
the price-to-book, increases as insiders and doctors are
added to the board. This is modestly surprising; an ana-
lyst might expect that with more insiders and doctors on
the board, the diversity of opinion on the board might be
reduced, negatively impacting firm value and the price-
to-book ratio. Such is not the case with the firms in the
sample.
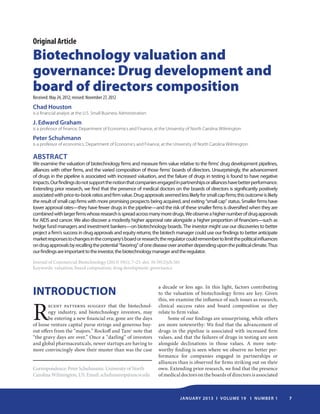
Extending this discovery concerning the number
of insiders and doctors on the board, Figure 1 portrays
the predicted price-to-book ratio using the medical doc-
tor and insider coefficients from Model 2 in Table 3. The
quadratic relationship between insiders, doctors and the
price-to-book ratio is revealed. It is likely that the newest
firms, with the lowest earnings and the smallest book val-
ues, have a greater preponderance of doctors and found-
ing partners (insiders) on their boards than do “older”
more established firms. With the “number of insiders”
becoming a proxy for the newer smaller firm with the
lower book value, the linear and quadratic relationships
observed between the number of insiders (and doctors)
and the price-to-book ratio is less surprising.
Extending the “stories” of Table 3 and Figure 1,
in Table 4 the price-to-book ratio is measured against
additional descriptive features of the board of direc-
tors. The importance of board composition as measured
by the percentage of total membership comprised of
Table 2: continued
Variables Mean Median Minimum Maximum n
DrugAppr 8.74 5 0 157 163
AIDS 0.41 0 0 8 163
Bone 0.29 0 0 5 163
Cancer 5.17 0 0 111 163
Cognitiv 1.22 0 0 41 163
Diabetes 0.61 0 0 17 163
Heart 0.63 0 0 21 163
Other 7.04 4 0 115 163
Pain 0.65 0 0 23 163
9. January 2013 I Volume 19 I Number 1 15
individuals with different backgrounds is examined.
Given an increase in the growth rate of the relative por-
tion of the board made up by doctors, the presence on
the board of men (without over-representation), and
the inclusion of finance experts on the board (without
over-representation), the price-to-book ratio increases.
For the firm seeking to enhance its attractiveness to buy-
ers (both buyers of its stock, and potential buyers of the
entire firm), these findings are not critical, but they are
telling; the firm should exhibit a growing board presence
of doctors, and should include but not overweight men
and “experts” in finance.
Results in Tables 3 and 4 relate board features to
firm value. Increasing equity values, as firms mature
and expand, are characterized by a number of the vari-
ables. Most of the features of the board members (MD’s,
insiders, gender, etc) do not regularly influence the
firm’s market cap or firm size, but they are often asso-
ciated with equity returns. In a set of unreported tests,
it is found that only the finance PhD’s and scientists
appeared to play any significant role in describing mar-
ket cap.
But between 2007 and 2009, two difficult years for
most equities across the world, the examinations of
RD expenditures reveal several patterns: In Table 5,
for example, the influence of doctors and business
experts in directing firm resources towards greater
expenditures on research is affirmed. In a broad set of
unreported tests, no separable statistically significant
influence of scientists or insiders, in directing the firm
towards greater RD expenses, is observed over those
years. One might have expected the influence of those
stakeholders to increase during that time period, but
such is not the case.
Changes in research and development expendi-
tures are associated with efforts to move drugs through
the development pipeline, and those changes influence
firm value. In Table 6 below, the number of drugs in the
pipeline pending FDA approval (Pending) has a negative
Table 3: OLS results for price-to-book ratio
Model 1 Model 2 Model 3 Model 4
Variable
Coefficient
(standard error)
Intercept –42.28***
(13.14)
–25.88***
(10.27)
–34.28***
(11.32)
–33.71***
(12.31)
CEO Dual 13.39+
(8.71)
15.48*
(8.62)
15.05*
(8.62)
13.98+
(8.70)
Small Cap 19.99**
(9.30)
22.06**
(9.25)
22.31**
(9.26)
19.93**
(9.28)
Insider 14.48***
(5.02)
13.21***
(5.06)
Insider2
3.25***
(1.04)
3.54***
(1.03)
Medical Doctor 11.20***
(3.95)
11.85***
(3.89)
Medical Doctor2
2.80***
(0.90)
2.72***
(0.92)
R-Squared 0.1448 0.1675 0.1656 0.1495
*Indicates significance at the 10% level, **indicates significance at the 5% level, ***indicates significance at the 1% level
Figure 1: Predicted price-to-book ratio as a function of
the number of medical doctors and insiders
10. Journal of Commercial Biotechnology http://www.CommercialBiotechnology.com16
effect on RD0709, the RD expenditures between 2007
and 2009. This may at first seem counterintuitive, but
on reflection it makes sense: Having invested in a given
drug in the past, as that drug moves through the pipeline,
companies seem to pause on other, newer, R and D
efforts, as the decisions attaching to the existing drug(s)
develop.
Table 4: OLS results for price to book ratio with board
composition measured as a percentage of the board
Variable
Coefficient
(standard error)
Intercept –120.89*
(65.22)
CEO Dual –0.76
(4.14)
Insider 0.11
(0.18)
Medical Doctor –1.46*
(0.77)
Medical Doctor2
8.47**
(3.82)
Medical Doctor3
–11.93**
(5.09)
BsExpert –0.21
(0.14)
Finance 0.14
(0.17)
Scientist –0.05
(0.24)
Male 10.84**
(5.18)
Male2
–19.19**
(9.18)
Male3
9.75**
(4.64)
PhDFinance –0.44
(0.35)
PhDExpert 1.52**
(0.78)
PhDeExpert2
–7.29
(4.64)
PhDExpert3
8.28
(6.57)
R-Squared 0.1441
*Indicates significance at the 10% level, **indicates
significance at the 5% level, ***indicates significance at the
1% level
Table 5: OLS results for change in RD expenditures
with board composition measured as a percentage of
the board
Variable
Coefficient
(standard error)
Intercept –142.85
(92.10)
Medical –2.95
(2.94)
Medical2
23.03*
(14.02)
Medical3
–26.55
(17.59)
BsExpert 1.4***
(0.56)
Finance 1.32*
(0.72)
Scientist 0.79
(0.95)
CEODual 9.12
(16.73)
Male 3.69
(2.66)
Male2
–3.78
(2.42)
Male3
0.56
(0.42)
PhDFinance 0.69
(1.45)
PhDExpert 4.12
(3.23)
PhDeExpert2
–18.51
(19.52)
PhDExpert3
22.53
(28.25)
R-Squared 0.1245
*Indicates significance at the 10% level, **indicates
significance at the 5% level, ***indicates significance at the
1% level
11. January 2013 I Volume 19 I Number 1 17
Results in Table 6 suggest that higher RD expen-
ditures are influenced by higher expected approval rates,
as calculated using Equation 2, but the direction of that
relationship should be kept in mind; higher RD expen-
ditures likely lead to higher approval rates and the higher
approval rates themselves influence RD. As the FDA
moves a drug past various phases of approval, additional
RD spending ensues, as those approvals themselves
mandate additional expenditures by the drug developer.
Interestingly, the number of professional support
personnel in Table 6 (lawyers, accountants) exhibits a
quadratic relationship with changes in RD spending.
This relationship, represented in Figure 2 (with other
dependent variables evaluated at their means), signifies
that as more professional support personnel are added
to boards, RD spending may decrease at first, but
will eventually increase with additional support per-
sonnel. This is an absolute and relative relationship; we
find that as either the total number of these personal or
their percentage representation on the board increases,
the effect in Figure 2 is observed. Notably, boards with
between two and seven professional support personnel
appear to decrease spending on RD on average, while
those with fewer than two or more than seven support
personnel appear to increase spending on RD. This
changing spending, in turn, influences firm value and
the attractiveness of the firm to stockholders and poten-
tial acquirers.
Expected drug approvals, the hoped-for outcome
of the RD expenditures, are associated with sev-
eral distinct factors, as shown in Table 7. Following an
exhaustive set of tests encouraged by prior research
and anecdotal comment in the press, one finds the like-
lihood of drug approvals characterized by the number
of prior approvals, the alliances in which the firm is
engaged, and the duality of the CEO’s role with the firm.
The expected approval rate is higher for the firm with
a history of drug approvals (this is unsurprising), that
is not a member of a drug development alliance but is
working on its own, and whose CEO is not also the board
chairman; this contrasts with the higher price-to-book
ratios observed for firms with a board chairman who
is also CEO. The greater likelihood of success among
firms going “solo,” suggests that perhaps the firms seek
partners for the less promising endeavors, saving the
better prospects for independent development. As well,
the greater success of firms that have earlier had drugs
approved may contribute to a snowball effect—the firms
with greater prior success have enhanced later success,
and in turn invest more in RD, perpetuating the cycle.
A multitude of tests were conducted, encouraged by
the financial press, to ascertain the importance of firm
foci on various diseases in both motivating research and
in contributing to the firm’s growth and overall equity
values. In Table 8 below, it is shown that additional RD
spending is associated with those firms that are mov-
ing drugs through the FDA pipeline, with those com-
panies that have recently discontinued work on a drug,
and for those firm’s engaged in bone work. A review of
the p-values in the right-hand column of Table 8 sug-
gests that, for the sample, research is conducted across a
broad area of medical maladies, with only bone research
being associated with statistically significantly increased
RD expenditures for the small cap firms in the sample.
Note also the marginal significance of the relationship
between market cap and RD. In another set of tests, not
detailed here in the interest of brevity, no single disease
and its adjacent treatments are statistically significantly
Table 6: OLS results for percent changes in RD
expenditure
Variable
Coefficient
(standard error)
Intercept –0.62*
(0.38)
Pending –0.15*
(0.09)
Expected approval rate 1.54**
(0.66)
Director 0.09**
(0.04)
Support –0.35***
(0.12)
Support2
0.04**
(0.02)
R-Squared 0.1133
*Indicates significance at the 10% level, **indicates significance
at the 5% level, ***indicates significance at the 1% level
Figure 2: Predicted percentage change in RD
expenditure as a function of professional support
personnel
12. Journal of Commercial Biotechnology http://www.CommercialBiotechnology.com18
Table 7: OLS results for expected drug approval rate
Variable
Coefficient
(standard error)
Intercept 0.34***
(0.01)
Approved 0.007***
(0.002)
Solo –0.001***
(0.0004)
CEODual –0.04**
(0.02)
Finance2
0.002+
(0.0016)
R-Squared 0.1270
*indicates significance at the 10% level, **indicates significance
at the 5% level, ***indicates significance at the 1% level,
+
indicates significance at the 15% level
Table 8: OLS results drug data-small capitalization
firms
Variable
Coefficient
(standard error)
Intercept –37.71
(39.26)
MktCap0709 0.19
(0.12)
Prclinic 25.17
(26.00)
PhaseI 7.45
(30.94)
PhaseII 21.31
(39.02)
PhaseIII 51.78
(72.22)
Pending 12.82
(82.85)
Approved 35.32
(30.31)
PhaseIV –3.55
(26.45)
TotPipes –68.81
(109.03)
PipeFDA 2.6***
(1.09)
Table 8: continued
Variable
Coefficient
(standard error)
DsconPre 34.3
(28.38)
DisconI 30.32
(30.89)
DisconII 29.15
(29.77)
DisconIII 50.6*
(31.05)
DisconPA 121.65**
(56.09)
Licensed –34.34
(28.48)
Solo –34.97
(28.34)
AIDS 40.92
(32.53)
Bone 71.58**
(37.04)
Cancer 36.17
(28.17)
Cognitive 20.44
(29.86)
Diabetes 48.82
(31.99)
Heart 43.67
(36.00)
Other 30.35
(28.03)
Pain 37.25
(31.99)
DrugAppr –4.55
(5.69)
R-Squared 0.2886
*Indicates significance at the 10% level, **indicates significance
at the 5% level, ***indicates significance at the 1% level
13. January 2013 I Volume 19 I Number 1 19
associated with the equity values and market caps of the
sample firms.
CONCLUSIONS AND
ENCOURAGEMENTS FOR
SUBSEQUENT RESEARCH
Factors associated with the success of the biotechnology
industry are examined, with particular attention paid to
board structure and the firm’s alliances, as those issues
receive only limited consideration in the prior research.
Employing a sample of biotechnology firms, between
2007 and 2009, alternative measures of firm valuation
are modeled based upon board composition and char-
acteristics of the drug development pipeline. Over 1,000
directors are classified by specialty and degree earned,
alongside a sub-classification of close to 5,000 drug
treatments under development by the examined firms.
Findings show that:
• A CEO who is also board chairman
appears to have a positive relationship with
the price-to-book ratio, but is negatively
associated with the drug approval rate.
• Similarly, small cap firms have higher
price-to-book ratios (this is unsurprising
and a pattern revealed in a broad research),
but lower expected approval rates.
Approvals for these smaller firms have a
much larger relative impact, and that larger
impact may account for this observed
relationship. This “relative impact”
influences the likelihood of acquisition; as
smaller and smaller firms are influenced to
a greater and greater degree by the success
or failure of a given drug, the attractiveness
of being acquired (and of subsequently
diversifying the firm’s operations over all
the activities of the acquirer) increases. As
well, recent changes in new equity-issue
regulations have been onerous, and the
desirability of being acquired over going
public has become clear.
• Insiders and medical doctors on the board
are associated with higher price-to-book
ratios, but have no significant relationships
with the number of approvals or approval
rates.
• A critical mass of support personnel on
the Board appears to have a significant
impact on RD spending and subsequent
drug approvals.
• History of success matters.
• Volume matters; more going into the
pipeline means there is a higher chance of
something making it through to the market.
• Having the capital to operate
independently is important; firms appear
to keep the best prospects “at home,” and
enter alliances with poorer development
candidates; this becomes risky where the
firm is not independently able to fund the
better prospects.
The investor could use our findings to frame a firm’s
success in drug approvals and equity returns, encourag-
ingordiscouraginginvestment.Abiotechmanagermight
anticipate market responses to changes in the company’s
board or research plans using our study’s results. And,
finally, a regulator is encouraged to maintain—with our
findings—his or her sensitivity to the approval of a drug
for any non-scientific or political reason. Thus our find-
ings are important to all three of these stakeholders—the
investor, the biotechnology manager and the regulator.
While these findings are in no way exhaustive, and clear
avenues for additional research are evident, the results
shared here can assist the investor, manager, mergers and
acquisitions specialist and regulator in motivating the
best allocations of capital, and the most promising direc-
tions for research and development. Later research could
refine some of this work—value enhancements provided
by research into varied diseases is one area inviting addi-
tional tests—and assist the manager or clinician in better
creating value with the biotechnology firm’s resources.
REFERENCES AND NOTES
1. Rockoff, J. D. and Tam, P. (2012). “Biotech Funding Gets
Harder to Find.” Wall Street Journal, 19 March, P1.
2. Medtrack (2012). http://www.medtrack.com/wp-content/
uploads/2012/01/Medtrack-for-Biotechs.pdf
3. EuropaBio (2011). Available online at: http://www.
europabio.org/healthcare-biotech-facts-figures
4. “BIO | Biotechnology Industry Facts.” BIO |
Biotechnology Industry Organization. 2008.
5. Pisano, G.P. (2006). “Can Science Be a Business? Lessons
from Biotech”. Harvard Business Review, October, 2006.
6. Bratic, V. W., Tilton, P. and Balkrishnan, M. (1997).
“Navigating through a Biotech Valuation.” Journal of
Biotechnology in Healthcare Research and Regulation,
Vol. 4, 207-216.
7. Villiger, R., and Bogdan, B. (2005). “Valuing Pharma
RD: The catch-22 of DCF.” Journal of Applied
Corporate Finance 17(2): 113-116.
14. Journal of Commercial Biotechnology http://www.CommercialBiotechnology.com20
8. DiMasi, J. A., R. W. Hansen, and H. G. Grabowski
(2003). “The price of innovation: new estimates of drug
development costs”, Journal of Health Economics 22:
151–185.
9. Xu, B. (2009). “Investment success and the value of
investment opportunities: evidence from the biotech
industry.” Applied Financial Economics 19(7): 527-537.
10. Morgan, S., Grootendors, P., Lexchine, J., Cunningham,
C. and Greyson, D. (2011). “The cost of drug development:
A systematic review”. Health Policy, Forthcoming, 2011.
11. DiMasi, J. A. (1995). “Success rates for new drugs
entering clinical testing in the United States.” Clinical
Pharmacology and Therapeutics 58: 1-14.
12. Villiger, R. and Bogdan, B. (2006). “Getting Real About
Valuations in Biotech .” Nature Biotechnology, 23,
423-428.
13. Baum, J. A., Calabrese, T., and Silverman, B. S. (2000).
“Don’t go it alone: Alliance network composition and
startups’ performance in Canadian biotechnology.”
Strategic Management Journal 21(3): 267-294.
14. Agnew, B. (2000). “When Pharma merges, RD is the
Dowry.” Science 287: 1952-1953.
15. Xu, B., Magnan, M. L. and Andre, P. E. (2007). “The Stock
Market Valuation of RD Information in Biotech Firms.”
Contemporary Accounting Research 24.4: 1291-1318.
16. Vance, S. C. (1983). “Corporate Leadership: Boards,
directors, and strategy.” McGraw-Hill, New York.
17. Pearce, J. A. and Zahra, S. A. (1992). “Board composition
from a strategic contingency perspective.” Journal of
Management Studies 29: 411-438.
18. Barnhart, S. W., and Rosenstein, S. (1998) “Board
Composition, Managerial Ownership, and Firm
Performance: An Empirical Analysis.” The Financial
Review 33(4): 1-16.
19. Finkle, T. A. (1998). “The Relationship between
Boards of Directors and Initial Public Offerings in the
Biotechnology Industry.” Entrepreneurship: Theory
Practice 22(3): 5-29.
20. Macus, M. (2008). “Board Capability: An Interactions
Perspective on Boards of Directors and Firm
Performance.” International Studies of Management
Organization 38(3): 98-116.
21. Goodstein, J., Gautam, K. and Boeker, W. (1994). “The
Effects of Board Size and Diversity on Strategic Change.”
Strategic Management Journal 15(3): 241-250.
22. Jensen, M., and Meckling, W. (1976). “Theory of the
Firm: Managerial behavior, agency costs, and ownership
structure.” Journal of Financial Economics 3: 305-350.
23. Schellenger, M. H., Wood, D. D. and Tashakori, A. (1989).
“Board of Director Composition, Shareholder Wealth, and
Dividend Policy.” Journal of Management 15(3): 457-468.
24. Vance, S. C. (1964). “Boards of Directors: Structure and
Performance.” University of Oregon Press.
25. Pfeffer, J. (1972). “Size and Composition of Corporate
Boards of Directors: The Organization and its
Environment.” Administrative Science Quarterly 17(2):
218-228.
26. Dalton, D., Daily, C. Ellstrand, A. and Johnson, J. (1998).
“Meta-analytic reviews of board composition, leadership
structure, and financial performance.” Strategic
Management Journal 19(3): 269-290.
27. Bosner, K. (2007). “Board Composition, Structure, and
Financial Performance: An Update.” The Journal of
Applied Business Research 23(4): 27-36.
28. McIntyre, M. L., Murphy, S. A. and Mitchell, P. (2007).
“The top team: examining board composition and firm
performance.” Corporate Governance: The International
Journal of Effective Board Performance 7(5): 547-561.
29. Markarian, G. and Parbonetti, A. (2007). “Firm Complexity
and Board of Director Composition.” Corporate
Governance: An International Review 15(6): 1224-1243.
30. Baysinger, B.D., and Zardkoohi, A. (1986). “Technology,
Residual Claimants, and Corporate Control.” Journal of
Law, Economics Organization 2(2): 339-350.
31. Guo, R., Lev, B. and Zhou, N. (2005). “The valuation of
biotech IPOs.” Journal of Accounting, Auditing, and
Finance 20(4): 423-459.
32. These drugs are already approved. The company
continues to maintain and update data on the drugs.
This phase may or may not be FDA mandated. Not all
companies administer PhaseIV trials on their drugs.