Best VIP Call Girls Noida Sector 40 Call Me: 8448380779
The Street Analysis- ASML
1. ASML HOLDING NV
ASMLNASDAQ:
November 1, 2015
BUY HOLD SELL
BUYBUYBUYBUYBUY
RATING SINCE 05/18/2010
TARGET PRICE $107.80A+ A A- B+ B B- C+ C C- D+ D D- E+ E E- F
Annual Dividend Rate
$0.65
Annual Dividend Yield
0.70%
Beta
1.45
Market Capitalization
$39.9 Billion
52-Week Range
$82.07-$114.14
Price as of 10/29/2015
$92.06
Sector: Technology Sub-Industry: Semiconductor Equipment Source: S&P
This report is for information purposes only and should not be considered a solicitation to buy or sell any security. Neither TheStreet Ratings nor any other party guarantees its accuracy
or makes warranties regarding results from its usage. Redistribution is prohibited without the express written consent of TheStreet Ratings. Copyright(c) 2006-2015. All rights reserved.
PAGE 1Report Date: November 1, 2015
ASML BUSINESS DESCRIPTION
ASML Holding N.V. engages in the development,
production, marketing, sale, and servicing of
advanced semiconductor equipment systems with
a focus on lithography related systems worldwide.
STOCK PERFORMANCE (%)
3 Mo. 1 Yr. 3 Yr (Ann)
Price Change -7.03 -4.63 9.26
GROWTH (%)
Last Qtr 12 Mo. 3 Yr CAGR
Revenues 28.59 -14.05 4.51
Net Income 50.60 -14.33 3.22
EPS 49.09 -13.27 -6.83
RETURN ON EQUITY (%)
ASML Ind Avg S&P 500
Q3 2015 16.98 21.24 12.91
Q3 2014 19.48 17.15 14.28
Q3 2013 12.79 13.56 13.75
P/E COMPARISON
26.08
ASML
33.81
Ind Avg
22.01
S&P 500
EPS ANALYSIS¹ ($)
2015
Q30.82
Q20.98
Q11.00
2014
Q40.73
Q30.55
Q21.22
Q10.77
2013
Q41.53
Q30.63
Q20.76
Q10.29
NA = not available NM = not meaningful
1 Compustat fiscal year convention is used for all fundamental
data items.
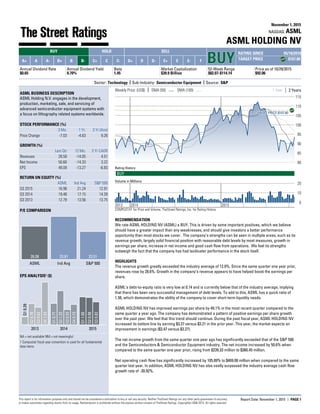
Weekly Price: (US$) SMA (50) SMA (100) 2 Years1 Year
2013 2014 2015
80
85
90
95
100
105
110
115
TARGET PRICE $107.80TARGET PRICE $107.80TARGET PRICE $107.80TARGET PRICE $107.80TARGET PRICE $107.80
Rating History
BUY
0
10
20
Volume in Millions
COMPUSTAT for Price and Volume, TheStreet Ratings, Inc. for Rating History
RECOMMENDATION
We rate ASML HOLDING NV (ASML) a BUY. This is driven by some important positives, which we believe
should have a greater impact than any weaknesses, and should give investors a better performance
opportunity than most stocks we cover. The company's strengths can be seen in multiple areas, such as its
revenue growth, largely solid financial position with reasonable debt levels by most measures, growth in
earnings per share, increase in net income and good cash flow from operations. We feel its strengths
outweigh the fact that the company has had lackluster performance in the stock itself.
HIGHLIGHTS
The revenue growth greatly exceeded the industry average of 12.9%. Since the same quarter one year prior,
revenues rose by 28.6%. Growth in the company's revenue appears to have helped boost the earnings per
share.
ASML's debt-to-equity ratio is very low at 0.14 and is currently below that of the industry average, implying
that there has been very successful management of debt levels. To add to this, ASML has a quick ratio of
1.56, which demonstrates the ability of the company to cover short-term liquidity needs.
ASML HOLDING NV has improved earnings per share by 49.1% in the most recent quarter compared to the
same quarter a year ago. The company has demonstrated a pattern of positive earnings per share growth
over the past year. We feel that this trend should continue. During the past fiscal year, ASML HOLDING NV
increased its bottom line by earning $3.27 versus $3.21 in the prior year. This year, the market expects an
improvement in earnings ($3.47 versus $3.27).
The net income growth from the same quarter one year ago has significantly exceeded that of the S&P 500
and the Semiconductors & Semiconductor Equipment industry. The net income increased by 50.6% when
compared to the same quarter one year prior, rising from $239.33 million to $360.45 million.
Net operating cash flow has significantly increased by 105.89% to $469.08 million when compared to the same
quarter last year. In addition, ASML HOLDING NV has also vastly surpassed the industry average cash flow
growth rate of -30.92%.
2. ASML HOLDING NV
ASMLNASDAQ:
November 1, 2015
Sector: Technology Semiconductor Equipment Source: S&P
Annual Dividend Rate
$0.65
Annual Dividend Yield
0.70%
Beta
1.45
Market Capitalization
$39.9 Billion
52-Week Range
$82.07-$114.14
Price as of 10/29/2015
$92.06
This report is for information purposes only and should not be considered a solicitation to buy or sell any security. Neither TheStreet Ratings nor any other party guarantees its accuracy
or makes warranties regarding results from its usage. Redistribution is prohibited without the express written consent of TheStreet Ratings. Copyright(c) 2006-2015. All rights reserved.
PAGE 2Report Date: November 1, 2015
PEER GROUP ANALYSIS
REVENUE GROWTH AND EBITDA MARGIN*
EBITDA Margin (TTM)
RevenueGrowth(TTM)
-20%40%
70%-10%
FAVORABLE
UNFAVORABLE
TERTERTERTERTER
SUNESUNESUNESUNESUNE AMATAMATAMATAMATAMAT
TSRATSRATSRATSRATSRA
ENTGENTGENTGENTGENTG
ATEATEATEATEATE
AMKRAMKRAMKRAMKRAMKR
LRCXLRCXLRCXLRCXLRCX
KLACKLACKLACKLACKLAC
ASMLASMLASMLASMLASML
Companies with higher EBITDA margins and
revenue growth rates are outperforming companies
with lower EBITDA margins and revenue growth
rates. Companies for this scatter plot have a market
capitalization between $1.5 Billion and $39.9 Billion.
Companies with NA or NM values do not appear.
*EBITDA – Earnings Before Interest, Taxes, Depreciation and
Amortization.
REVENUE GROWTH AND EARNINGS YIELD
Earnings Yield (TTM)
RevenueGrowth(TTM)
-20%40%
20%-50%
FAVORABLE
UNFAVORABLE
TERTERTERTERTER
SUNESUNESUNESUNESUNE AMATAMATAMATAMATAMATMKSIMKSIMKSIMKSIMKSI
TSRATSRATSRATSRATSRA
ENTGENTGENTGENTGENTG
ATEATEATEATEATE
AMKRAMKRAMKRAMKRAMKR
LRCXLRCXLRCXLRCXLRCX
KLACKLACKLACKLACKLAC
ASMLASMLASMLASMLASML
Companies that exhibit both a high earnings yield
and high revenue growth are generally more
attractive than companies with low revenue growth
and low earnings yield. Companies for this scatter
plot have revenue growth rates between -14.1% and
35.7%. Companies with NA or NM values do not
appear.
INDUSTRY ANALYSIS
The US semiconductors and semiconductor equipment industry is known for its technological advancements.
The semiconductor market includes companies that manufacture and sell integrated circuits and discrete
semiconductor devices. The semiconductor equipment market includes companies that manufacture and sell
equipment for the production of semiconductor devices. About 5,000 companies operate in this industry,
which has approximate annual revenue of $150 billion. The top 50 companies hold more than 70% of total
market share. Major players are Intel (INTC), Texas Instruments (TXN), Micron Technology (MU), and
Advanced Micro Devices (AMD).
The industry is cyclical and subject to supply/demand fluctuations and price erosion. After experiencing a
downturn during the recent recessionary period, the semiconductor market is building back on renewed
demand.
Demand for semiconductor products is indirect and driven by sales of personal computers, cell phones,
consumer electronics devices, and other electronic equipment. The industry is capital-intensive and requires
significant investments to advance technology and reduce manufacturing costs. Research and development
expenses form a major part of capital expenditure and the industry spends over $15 billion annually.
The industry is subject to various environmental regulations related to pollutant emissions, waste-water
discharges, and the use of hazardous substances. The European Union’s directives, such as the Restriction
of Use of Certain Hazardous Substances and the Registration, Evaluation, Authorization, and Restriction of
Chemicals are relevant to the manufacturing process. China, which represents the world’s second largest
semiconductor market and is a major importer of US products, also restricts the use of hazardous substances
in electronic products.
Although the industry is the second-largest exporting industry in the US, its global market share in chip
production has eroded due to insufficient research funding, workforce challenges, and foreign incentives.
The demand pattern has shifted production to low cost substitutes and shifted the demand centers to China,
Taiwan, and the rest of Asia. There has also been a lateral shift of capital as research and development
investments move away from the US to Asia.
PEER GROUP: Semiconductors & Semiconductor Equipment
Recent Market Price/ Net Sales Net Income
Ticker Price ($)Company Name Cap ($M) Earnings TTM ($M) TTM ($M)
ASML 92.06ASML HOLDING NV 39,893 26.08 6,995.11 1,543.91
TER 19.38TERADYNE INC 4,086 39.55 1,644.37 103.31
SUNE 8.33SUNEDISON INC 2,962 NM 2,069.70 -1,160.60
AMAT 16.74APPLIED MATERIALS INC 20,098 15.94 9,555.00 1,297.00
MKSI 35.15MKS INSTRUMENTS INC 1,876 14.35 844.16 130.97
TSRA 34.85TESSERA TECHNOLOGIES INC 1,816 9.27 297.30 207.49
ENTG 12.73ENTEGRIS INC 1,789 24.48 1,085.97 72.04
ATE 7.93ADVANTEST CORP 1,583 14.96 1,364.99 103.11
AMKR 6.19AMKOR TECHNOLOGY INC 1,469 18.21 3,067.07 79.67
LRCX 75.84LAM RESEARCH CORP 12,021 16.63 5,706.99 803.18
KLAC 66.32KLA-TENCOR CORP 10,342 26.74 2,813.79 398.82
The peer group comparison is based on Major Semiconductor Equipment companies of comparable size.
3. ASML HOLDING NV
ASMLNASDAQ:
November 1, 2015
Sector: Technology Semiconductor Equipment Source: S&P
Annual Dividend Rate
$0.65
Annual Dividend Yield
0.70%
Beta
1.45
Market Capitalization
$39.9 Billion
52-Week Range
$82.07-$114.14
Price as of 10/29/2015
$92.06
This report is for information purposes only and should not be considered a solicitation to buy or sell any security. Neither TheStreet Ratings nor any other party guarantees its accuracy
or makes warranties regarding results from its usage. Redistribution is prohibited without the express written consent of TheStreet Ratings. Copyright(c) 2006-2015. All rights reserved.
PAGE 3Report Date: November 1, 2015
COMPANY DESCRIPTION
ASML Holding N.V. engages in the development,
production, marketing, sale, and servicing of advanced
semiconductor equipment systems with a focus on
lithography related systems worldwide. It provides PAS
5500 family products, which comprise wafer steppers,
and step and scan systems with i-line, krypton fluoride,
and argon fluoride light sources for processing wafers.
The company also offers TWINSCAN systems, including
immersion lithography systems for manufacturing
environments for which imaging at a resolution down to
38 nanometers are required; TWINSCAN NXT systems,
which enables improved imaging and overlay; and NXE
system, an optical technology that utilizes reflective
mirrors. ASML Holding N.V. markets and sells its
products through its direct sales force. The company was
formerly known as ASM Lithography Holding N.V. and
changed its name to ASML Holding N.V. in 2001. ASML
Holding N.V. was founded in 1984 and is headquartered
in Veldhoven, the Netherlands.
ASML HOLDING NV
De Run 6501
Veldhoven 5504DR
NLD
Phone: 31 40 268 3000
http://www.asml.com
Employees: 14000
STOCK-AT-A-GLANCE
Below is a summary of the major fundamental and technical factors we consider when determining our
overall recommendation of ASML shares. It is provided in order to give you a deeper understanding of our
rating methodology as well as to paint a more complete picture of a stock's strengths and weaknesses. It is
important to note, however, that these factors only tell part of the story. To gain an even more comprehensive
understanding of our stance on the stock, these factors must be assessed in combination with the stock’s
valuation. Please refer to our Valuation section on page 5 for further information.
FACTOR SCORE
Growth out of 5 stars2.5
Measures the growth of both the company's income statement and
cash flow. On this factor, ASML has a growth score better than 40% of
the stocks we rate.
weak strong
Total Return out of 5 stars2.5
Measures the historical price movement of the stock. The stock
performance of this company has beaten 40% of the companies we
cover.
weak strong
Efficiency out of 5 stars5.0
Measures the strength and historic growth of a company's return on
invested capital. The company has generated more income per dollar of
capital than 90% of the companies we review.
weak strong
Price volatility out of 5 stars3.0
Measures the volatility of the company's stock price historically. The
stock is less volatile than 50% of the stocks we monitor.
weak strong
Solvency out of 5 stars4.5
Measures the solvency of the company based on several ratios. The
company is more solvent than 80% of the companies we analyze.
weak strong
Income out of 5 stars3.0
Measures dividend yield and payouts to shareholders. The company's
dividend is higher than 50% of the companies we track.
weak strong
THESTREET RATINGS RESEARCH METHODOLOGY
TheStreet Ratings' stock model projects a stock's total return potential over a 12-month period including both
price appreciation and dividends. Our Buy, Hold or Sell ratings designate how we expect these stocks to
perform against a general benchmark of the equities market and interest rates. While our model is
quantitative, it utilizes both subjective and objective elements. For instance, subjective elements include
expected equities market returns, future interest rates, implied industry outlook and forecasted company
earnings. Objective elements include volatility of past operating revenues, financial strength, and company
cash flows.
Our model gauges the relationship between risk and reward in several ways, including: the pricing drawdown
as compared to potential profit volatility, i.e.how much one is willing to risk in order to earn profits; the level of
acceptable volatility for highly performing stocks; the current valuation as compared to projected earnings
growth; and the financial strength of the underlying company as compared to its stock's valuation as
compared to projected earnings growth; and the financial strength of the underlying company as compared
to its stock's performance. These and many more derived observations are then combined, ranked, weighted,
and scenario-tested to create a more complete analysis. The result is a systematic and disciplined method of
selecting stocks.
4. ASML HOLDING NV
ASMLNASDAQ:
November 1, 2015
Sector: Technology Semiconductor Equipment Source: S&P
Annual Dividend Rate
$0.65
Annual Dividend Yield
0.70%
Beta
1.45
Market Capitalization
$39.9 Billion
52-Week Range
$82.07-$114.14
Price as of 10/29/2015
$92.06
This report is for information purposes only and should not be considered a solicitation to buy or sell any security. Neither TheStreet Ratings nor any other party guarantees its accuracy
or makes warranties regarding results from its usage. Redistribution is prohibited without the express written consent of TheStreet Ratings. Copyright(c) 2006-2015. All rights reserved.
PAGE 4Report Date: November 1, 2015
Consensus EPS Estimates² ($)
IBES consensus estimates are provided by Thomson Financial
0.69
Q4 FY15
3.47 E
2015(E)
4.01 E
2016(E)
INCOME STATEMENT
Q3 FY15 Q3 FY14
Net Sales ($mil) 1,731.91 1,346.82
EBITDA ($mil) 479.73 297.66
EBIT ($mil) 393.11 235.37
Net Income ($mil) 360.45 239.33
BALANCE SHEET
Q3 FY15 Q3 FY14
Cash & Equiv. ($mil) 2,992.42 3,390.11
Total Assets ($mil) 14,181.99 15,275.59
Total Debt ($mil) 1,256.06 1,436.31
Equity ($mil) 9,091.34 9,248.87
PROFITABILITY
Q3 FY15 Q3 FY14
Gross Profit Margin 50.41% 48.09%
EBITDA Margin 27.69% 22.10%
Operating Margin 22.70% 17.48%
Sales Turnover 0.49 0.53
Return on Assets 10.88% 11.79%
Return on Equity 16.98% 19.48%
DEBT
Q3 FY15 Q3 FY14
Current Ratio 2.71 2.45
Debt/Capital 0.12 0.13
Interest Expense NA NA
Interest Coverage NA NA
SHARE DATA
Q3 FY15 Q3 FY14
Shares outstanding (mil) 433 441
Div / share 0.00 0.00
EPS 0.82 0.55
Book value / share 21.00 20.98
Institutional Own % NA NA
Avg Daily Volume 1,298,372 994,459
2 Sum of quarterly figures may not match annual estimates due to
use of median consensus estimates.
FINANCIAL ANALYSIS
ASML HOLDING NV's gross profit margin for the third quarter of its fiscal year 2015 is essentially unchanged
when compared to the same period a year ago. The company has grown sales and net income significantly,
outpacing the average growth rates of competitors within its industry. ASML HOLDING NV has strong
liquidity. Currently, the Quick Ratio is 1.56 which shows the ability to cover short-term cash needs. The
company's liquidity has increased from the same period last year, indicating improving cash flow.
During the same period, stockholders' equity ("net worth") has remained virtually unchanged only decreasing
by 1.70% from the same quarter last year. The key liquidity measurements indicate that the company is
unlikely to face financial difficulties in the near future.
STOCKS TO BUY: TheStreet Quant Ratings has identified a handful of stocks that can potentially TRIPLE in the
next 12-months. To learn more visit www.TheStreetRatings.com.
5. ASML HOLDING NV
ASMLNASDAQ:
November 1, 2015
Sector: Technology Semiconductor Equipment Source: S&P
Annual Dividend Rate
$0.65
Annual Dividend Yield
0.70%
Beta
1.45
Market Capitalization
$39.9 Billion
52-Week Range
$82.07-$114.14
Price as of 10/29/2015
$92.06
This report is for information purposes only and should not be considered a solicitation to buy or sell any security. Neither TheStreet Ratings nor any other party guarantees its accuracy
or makes warranties regarding results from its usage. Redistribution is prohibited without the express written consent of TheStreet Ratings. Copyright(c) 2006-2015. All rights reserved.
PAGE 5Report Date: November 1, 2015
RATINGS HISTORY
Our rating for ASML HOLDING NV has not changed
since 5/18/2010. As of 10/29/2015, the stock was
trading at a price of $92.06 which is 19.4% below its
52-week high of $114.14 and 12.2% above its
52-week low of $82.07.
2 Year Chart
2014
$90
$100
$110
$120
BUY:$94.20
MOST RECENT RATINGS CHANGES
Date Price Action From To
10/29/13 $94.20 No Change Buy Buy
Price reflects the closing price as of the date listed, if available
RATINGS DEFINITIONS &
DISTRIBUTION OF THESTREET RATINGS
(as of 10/29/2015)
39.13% Buy - We believe that this stock has the
opportunity to appreciate and produce a total return of
more than 10% over the next 12 months.
33.26% Hold - We do not believe this stock offers
conclusive evidence to warrant the purchase or sale of
shares at this time and that its likelihood of positive total
return is roughly in balance with the risk of loss.
27.61% Sell - We believe that this stock is likely to
decline by more than 10% over the next 12 months, with
the risk involved too great to compensate for any
possible returns.
TheStreet Ratings
14 Wall Street, 15th Floor
New York, NY 10005
www.thestreet.com
Research Contact: 212-321-5381
Sales Contact: 866-321-8726
VALUATION
BUY. The current P/E ratio indicates a discount compared to an average of 33.81 for the Semiconductors &
Semiconductor Equipment industry and a premium compared to the S&P 500 average of 22.01. For additional
comparison, its price-to-book ratio of 4.38 indicates a significant premium versus the S&P 500 average of 2.78
and a discount versus the industry average of 4.88. The price-to-sales ratio is well above both the S&P 500
average and the industry average, indicating a premium. Upon assessment of these and other key valuation
criteria, ASML HOLDING NV proves to trade at a discount to investment alternatives within the industry.
1 2 3 4 5Price/Earnings
premium discount
ASML 26.08 Peers 33.81
• Discount. A lower P/E ratio than its peers can
signify a less expensive stock or lower growth
expectations.
• ASML is trading at a discount to its peers.
1 2 3 4 5Price/CashFlow
premium discount
ASML 24.33 Peers 14.53
• Premium. The P/CF ratio, a stock’s price divided by
the company's cash flow from operations, is useful
for comparing companies with different capital
requirements or financing structures.
• ASML is trading at a significant premium to its
peers.
1 2 3 4 5Price/Projected Earnings
premium discount
ASML 22.97 Peers 18.55
• Premium. A higher price-to-projected earnings ratio
than its peers can signify a more expensive stock
or higher future growth expectations.
• ASML is trading at a significant premium to its
peers.
1 2 3 4 5Price to Earnings/Growth
premium discount
ASML 4.77 Peers 1.45
• Premium. The PEG ratio is the stock’s P/E divided by
the consensus estimate of long-term earnings
growth. Faster growth can justify higher price
multiples.
• ASML trades at a significant premium to its peers.
1 2 3 4 5Price/Book
premium discount
ASML 4.38 Peers 4.88
• Discount. A lower price-to-book ratio makes a
stock more attractive to investors seeking stocks
with lower market values per dollar of equity on the
balance sheet.
• ASML is trading at a discount to its peers.
1 2 3 4 5Earnings Growth
lower higher
ASML -13.27 Peers 48.61
• Lower. Elevated earnings growth rates can lead to
capital appreciation and justify higher
price-to-earnings ratios.
• However, ASML is expected to significantly trail its
peers on the basis of its earnings growth rate.
1 2 3 4 5Price/Sales
premium discount
ASML 5.70 Peers 4.07
• Premium. In the absence of P/E and P/B multiples,
the price-to-sales ratio can display the value
investors are placing on each dollar of sales.
• ASML is trading at a significant premium to its
industry.
1 2 3 4 5Sales Growth
lower higher
ASML -14.05 Peers 10.81
• Lower. A sales growth rate that trails the industry
implies that a company is losing market share.
• ASML significantly trails its peers on the basis of
sales growth
DISCLAIMER:
The opinions and information contained herein have been obtained or derived from sources believed to be reliable, but
TheStreet Ratings cannot guarantee its accuracy and completeness, and that of the opinions based thereon. Data is provided
via the COMPUSTAT® Xpressfeed product from Standard &Poor's, a division of The McGraw-Hill Companies, Inc., as well as
other third-party data providers.
TheStreet Ratings is a division of TheStreet, Inc., which is a publisher. This research report contains opinions and is provided
for informational purposes only. You should not rely solely upon the research herein for purposes of transacting securities or
other investments, and you are encouraged to conduct your own research and due diligence, and to seek the advice of a
qualified securities professional, before you make any investment. None of the information contained in this report constitutes,
or is intended to constitute a recommendation by TheStreet Ratings of any particular security or trading strategy or a
determination by TheStreet Ratings that any security or trading strategy is suitable for any specific person. To the extent any of
the information contained herein may be deemed to be investment advice, such information is impersonal and not tailored to the
investment needs of any specific person. Your use of this report is governed by TheStreet, Inc.'s Terms of Use found at
http://www.thestreet.com/static/about/terms-of-use.html.