Cannabis Cultivation Business Plan Template
•
38 gefällt mir•36,002 views

CannaCult is a new cannabis cultivation company that plans to operate a 3,600 square foot facility in California. The company will apply for a cultivation license and aims to grow up to 500 plants concurrently across 11 strains from seedling to finished product. CannaCult intends to become a leading cultivator and supplier of high-quality cannabis in California by securing licensing, building its brand, and distributing its products statewide over the next five years.

Empfohlen
Empfohlen
Weitere ähnliche Inhalte
Was ist angesagt?
Was ist angesagt? (20)
Ähnlich wie Cannabis Cultivation Business Plan Template
Ähnlich wie Cannabis Cultivation Business Plan Template (20)
Kürzlich hochgeladen
Kürzlich hochgeladen (20)
Cannabis Cultivation Business Plan Template
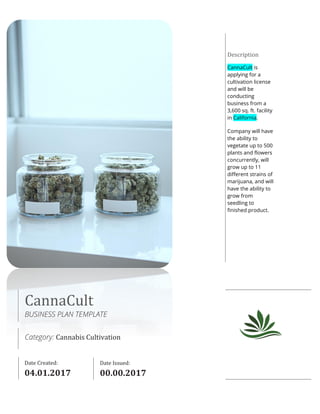
- 1. CannaCult BUSINESS PLAN TEMPLATE Category: Cannabis Cultivation Date Created: 00.00.2017 Date Issued: 00.00.2017 Description CannaCult is applying for a cultivation license and will be conducting business from a 3,600 sq. ft. facility in California. Company will have the ability to vegetate up to 500 plants and flowers concurrently, will grow up to 11 different strains of marijuana, and will have the ability to grow from seedling to finished product.
- 2. CannaCult is a new company which is intending to penetrate into the cannabis cultivation market in California. CannaCult is applying for a Class B license and intends to start with one greenhouse 3,600 sq. ft. California. Main Goals: ✓ Own and operate a cannabis cultivation facility in the state of California. ✓ To build a successful commercial cultivation facility and build a recognizable brand in a rapidly growing industry. ✓ To be fully compliant with all state and local municipalities and be primed and ready for national expansion as federal laws adjust and evolve to the benefit of the cannabis industry. ✓ To be supplying one of the best high-grade cannabis wholesale in the state of California to the dispensaries and manufacturers. Mission: ✓ To grow one of the best medical cannabis products for patients that need this type of medicine in California. Main Objective: ✓ Getting the California Cannabis Grower license, keeping on point with the company goal, acting as a guide line for us to follow as we grow larger. Change the charts below (Income statement and Cash flow projections). Executive Summary Executive Summary - 2,000 4,000 6,000 8,000 10,000 12,000 14,000 16,000 18,000 - 500 1,000 1,500 2,000 2,500 3,000 3,500 4,000 4,500 5,000 Year 1 Year 2 Year 3 Year 4 Year 5 Cash Flow Forecast, $000 Operational Cash Flow Ending Period Cash Flow (2,000) - 2,000 4,000 6,000 8,000 10,000 Year 1 Year 2 Year 3 Year 4 Year 5 Revenue & Profit Forecast, $000 Gross Profit Operating Expense Net Income
- 3. CANNABIS CULTIVATION Business Plan 2 Market Opportunities Nearly 60% of the U.S. population now lives in states that have legalized some form of cannabis use and sales, illustrating the rising acceptance of cannabis nationwide and highlighting the industry’s immense potential for future growth. Arcview Market Research, in partnership with New Frontier Data, have released a special update to the official Arcview Market Research growth projections in light of victories from 8 of the 9 cannabis ballot initiatives. The passage of initiatives in California, Nevada, Massachusetts, Maine, Florida, Arkansas, Montana, and North Dakota will add $7.4 billion to the 2020 market forecast bringing the overall market projection for legal adult-use and medical sales in the U.S. to $21.2 billion by 2020. That brings the compound annual growth rate (CAGR) to 28%. In 2015, California lawmakers and the governor approved legislation creating the Medical Cannabis Regulation and Safety Act (MCRSA) to regulate the state’s MMJ industry, which has been governed by a patchwork of local rules. The MCRSA took effect in January 2016, and the government has until Jan. 1, 2018, to develop statewide rules. 8 November 2016 California voters have approved cannabis for recreational use. The vote means that cannabis will become legal for use from December 15, and cannabis shops can open in 2018. California’s cannabis industry reported $2,692 million in retail sales via nearly 2,800 dispensaries in 2016, that is 10% more than all other MMJ states combined as of 2016 according to Arcview Market Research. Over the next five years they project the total California market to grow at a compounded annual rate of 18.5% to $5.6 billion by 2020. California 38% Washingt on 13% Colorado 11% Florida 15% Massachusetts 8% Ohio 8% Pennsylvania 7% Figure 1. Total cannabis sales, including medical and recreational, top 2025
- 4. Company Summary CannaCult intends to start its growing business from July 2017. Location CannaCult premises will be located in … Products & Services Company will produce up to 2 strains within 5 months of becoming a licensed cultivator. Company will have the ability to vegetate up to 500 plants and flowers concurrently, will grow up to 11 different strains of marijuana, and will have the ability to grow from seedling to finished product. CannaCult will dry and process all cannabis flowers into labeled/inventoried vacuum sealed bags before delivery to compassion centers. Management … Objectives Year 1: Securing the license to start cultivation in state California. Year 3: Brand and distribute our product line throughout California. Year 5: The CannaCult brand is now a trusted and consistent brand, while securing licensing in other states. Year 7: CannaCult is now available in 5 states and we intend to secure manufacture license. Executive Summary
- 5. CANNABIS CULTIVATION Business Plan 4 Start-up Summary The total investment required for the first year that the business starts operating is approximately $250,000. Initial investments would cover start-up costs and fixed expenses until profit stability is achieved during first year. Change figures in the table below (OPEX and CAPEX assumptions). Table 1. Start-up expenses, $ Expenses Quarter 1 Quarter 2 Quarter 3 Quarter 4 CAPEX Land & Development 70,000 0 0 0 Security Equipment 30,000 0 0 0 Office Equipment 10,000 0 0 0 CO2 extraction equipment 0 0 0 0 Green Houses 100,000 0 0 0 Building for MIP Equipment 0 0 0 0 Office building 0 0 0 0 Hoop house 0 0 0 0 TOTAL 210,000 0 0 0 OPEX Direct Costs 0 294,708 2,289,554 3,584,880 Legal Fees & Licensing 30,000 0 0 0 Building maintenance 0 3,000 3,000 3,000 Equipment maintenance 0 0 0 0 Administrative expenses 3,000 3,000 3,000 3,000 Administrative Salaries 30,000 30,000 30,000 30,000 Marketing Campaign 3,000 3,000 3,000 3,000 Brokers and Sellers Fees 0 13,440 120,960 211,200 Community Service, Improvements 0 0 6,000 9,000 Misc. 0 15,000 15,000 15,000 TOTAL 66,000 362,148 2,470,514 3,859,080
- 6. Executive Summary 1 Market Opportunities 2 Company Summary 3 Start-up Summary 4 Market Overview 6 Target Market 9 Pricing Benchmarks 10 SWOT Analyses 11 Online Advertising Obstacles 13 Marketing Plan 13 Sales Forecast 15 Operating Plan 16 Cultivation 17 Greenhouse and Cultivation Design 19 Physical Security Plan 20 Video Surveillance 21 Organizational Structure 22 Ownership 24 Financial Plan 25 Profit & Loss Forecast 26 Cash Flow Statement 27 Balance Sheet 28 Main Ratios 29 Appendix 30 Financial Statements, monthly 31 Table of Contents
- 7. 6 CANNABIS CULTIVATION Business Plan Market Overview
- 8. Although the federal government still considers the use of cannabis a criminal offence, more than half the states of America have legalized it in some form. Most states sell it only for medical purposes, often broadly defined. But eight states – Alaska, California, Colorado, Maine, Nevada, Massachusetts, Oregon and Washington – and the country's capital have gone further, legalizing the recreational use. Legal weed is more high-priced than the black market variety, but it is better value: three times more potent and only about 50% more expensive1. The size of the market for legal marijuana in the United States is projected to grow to $8.1 billion in 2017 and to $11.2 billion in 2018, that represents 21% and 38% growth over the previous years, driven largely by adult recreational sales of cannabis, the researchers found. The passage of initiatives in California, Nevada, Massachusetts, Maine, Florida, Arkansas, Montana, and North Dakota will add $7.4 billion to the 2020 market forecast. According to the 5th edition of Cannabis Market research, the overall market projection for legal adult- use and medical sales in the U.S. will reach $22.6 billion by 2021. That brings the compound annual growth rate (CAGR) to 28%2. 1 http://www.economist.com/blogs/graphicdetail/2016/02/daily-chart-10 2 http://www.arcviewmarketresearch.com/ 4.3 4.9 5.6 7.0 7.0 7.3 7.7 1.4 1.8 2.5 4.2 7.6 10.7 14.9 0 5 10 15 20 25 2015 2016 2017 (projected) 2018 (projected) 2019 (projected) 2020 (projected) 2021 (projected) Market Overview Figure 2. Medical and recreational cannabis sales forecast, billion $
- 9. 8 CANNABIS CULTIVATION Business Plan Twenty-eight states and the District of Columbia currently have laws legalizing marijuana in some form. Nearly 60% of the U.S. population now lives in states that have legalized some form of cannabis use and sales, illustrating the rising acceptance of cannabis nationwide and highlighting the industry’s immense potential for future growth. 9 November 2016 three new states approved cannabis medical using: Arkansas, Florida and North Dakota. Four others that already had medical cannabis laws, legalized recreational. New markets could create $7 billion to $8 billion in additional retail revenue for the industry, according to estimates by Marijuana Business Daily
- 10. Target Market In 1996, California became the first state to allow for medical marijuana use. State voters approved Proposition 215, the law that made it legal for doctors to recommend cannabis to patients. California has 482 cities and 58 counties, all with the power to govern their own medical marijuana industries. The methods they choose vary throughout the state. Some local governments have rules limiting the number of dispensaries and where they can open. Others passed ordinances banning all marijuana cultivation. In California, the weather conditions are ideal for cultivating cannabis outside, while a lot of marijuana is also grown indoors in massive warehouses. The state's marketplace is also known for its decades-long experience developing cannabis strains. Third-generation growers and breeders have some unparalleled knowledge of the plant and of the related regulatory environment compared to other states. In the years since medical legalization, consumers have become more educated and sophisticated about products, and the state's medical market is relatively saturated. Consumers have high expectations for quality, according to ArcView research. In 2015 Gov. Jerry Brown signed three bills that toughened regulations for medical cannabis businesses and sought standards for documentation and testing. The bills are known as the Medical Marijuana Regulation and Safety Act, or MMRSA for short. Collectively, the legislation also paved the way for medical cannabis businesses to turn a profit. The legislation is impacting marijuana business models in other ways. The laws have eliminated the idea of home-based dispensaries. 8 November 2016 California voters have approved cannabis for recreational use. The vote means that cannabis will become legal for use from December 15, and cannabis shops can open in 2018. California’s cannabis industry reported $2,692 million in retail sales via nearly 2,800 dispensaries in 2016, that is 10% more than all other MMJ states combined as of 2016 according to Arcview Market Research. Over the next five years they project the total California market to grow at a compounded annual rate of 18.5% to $5.6 billion by 2020. California 2,692 Washington 1,431 Colorado 1,339 Oregon 571 Michigan 500 Arizona 281 Figure 3. Medical and recreational cannabis sales in top states, 2016 Market Overview
- 11. 10 CANNABIS CULTIVATION Business Plan Pricing Benchmarks The simple average (non-volume weighted) price decreased $18 to $1,789 per pound, with 68% of transactions (one standard deviation) in the $1,059 to $2,518 per pound range. The average deal size decreased 8.8% to 6.5 pounds this week, from 7.1 pounds last week. In grams, the Spot price was $3.65, and the simple average price was $3.94. Indoor flower spanned from $800 to $6,400 per pound; the median price was $2,000/lb. Greenhouse flower spanned from $987 to $3,200 per pound; the median price was $1,305/lb. Outdoor flower spanned from $725 to $2,000 per pound; the median price was $1,400/lb. ✓ Deal sizes for indoor flower ranged from 0.5 to 100 pounds. ✓ Deal sizes for greenhouse flower ranged from 1 to 320 pounds. ✓ Deal sizes for outdoor flower ranged from 1 to 200 pounds. After several weeks of charting largely parallel courses, the movement of pricing for medical and adult- use product diverged this week, with the former rising and the latter experiencing an over 4% week- over-week decline. This week’s premium of $414 commanded by flower designated for sale in medical markets was the second-largest observed this year, behind a $427 premium documented in early February. Pricing for product in adult-use markets has not exceeded that of medical flower since early December 2016. 1000 1100 1200 1300 1400 1500 1600 1700 1800 $/pound Figure 4. Cannabis flower prices, $
- 12. SWOT Analyses S • In California the weather conditions are ideal for cultivating cannabis outside • Diversification of greenhouse cultivation and outdoor cultivation • Greenhouses will alow significantely decrease electricity bills and increase profit while competitive prices W • Product liability / legal issues • Enhanced risk of banking / financial / IRS scrutiny • Crop loss possibility due to pests, heat, human error, etc. • Difficulties with finding employees. Location is a bit remote and not much depth in local workforce • High energy consumption O • High growth industry • Trend toward greater cannabis legalization, including the use of cannabis for recreational purposes • Global Market T • A significant drop in wholesale pricing • Enforcement of federal law • Possible California law changing • Indicators of a slowed global economy Market Overview
- 13. 12 CANNABIS CULTIVATION Business Plan Marketing & Sales Strategy
- 14. Online Advertising Obstacles Because cannabis is illegal under federal law, state governments and online advertising platforms are placing strict rules on how companies can market their products. Google, Facebook and Twitter all have advertising policies that restrict the promotion of the sale of cannabis. Google’s policy prohibits ads that promote “substances that alter mental state for the purpose of recreation.” Facebook restricts any “illegal, prescription, or recreational drugs.” And Twitter bans “illegal drugs” as well as substances that cause “legal highs.” Instagram and Facebook have decided to go a step further by removing pages of cannabis related businesses. Marketing Plan Marketing and advertising campaign includes: - Meeting with whole buyers and dispensaries management - E-mail Marketing - Promotional directly through special platforms, including: o weedmaps.com o leafly.com o stickyguide.com o www.cannasaver.com o cannabiscouponcodes.com o weedealio.com - Advertising and articles in the thematic Magazines, including: o Dope o Cannabis Now o 420 Magazine o Marijuana Venture o MG Magazine - Business events and conferences - Business and industry associations - Website development, Branding appearance development, including mission statement, logo, colors, brochures etc. SEO optimization, focusing on: o Keywords o Adding fresh content o Improving link popularity. Marketing Strategy
- 15. 14 CANNABIS CULTIVATION Business Plan - AdWords. Testing various keywords to select familiar to topic and at the same time acceptable by Google’s algorithm: green, medicine, 502, infused, relaxing, stimulating, enhanced, alternative therapies, alternative medicine, natural, and others. - Mantis, 420 Network, 420 Click. Table 2. Cannabis business directories WEEDMAP https://weedmaps.com/ Marijuana dispensary finder on the planet. With over 7,750 listings throughout the U.S., Canada, and Europe. WeedMaps has 2.8 million unique visitors each month. LEAFY https://www.leafly.com/ Leafy is a cannabis information resource for finding the right strains and products. Services include: cannabis finder, online store, branding, doctors’ portal. 49,950 unique visitors per day. https://www.stickyguide.com/ Medical marijuana dispensary, doctor and medicine directory with reviews. 360,000 unique visitors each month. https://www.cannasaver.com/ Canna-Saver is website for cannabis and related coupons, devoted to medical marijuana deals and savings. Offers a constant flow of deals and savings from the top cannabis and medical marijuana retailers. 12,000 unique visitors each month. http://cannabiscouponcodes.com/ Website with cannabis coupon codes. 21,000 unique visitors each month. https://www.weedealio.com/ Weedealio is one of the known companies in providing the best of the deals related to Marijuana, weed deals and other cannabis products. 53,000 unique visitors each month.
- 16. Sales Forecast Assumptions As growing stage will start from January 2018, sales are projected to be started from the 2018 summer and they will significantly increase from the second year. Company intends to mix outdoor cultivation from April to October period and all around year greenhouse cultivation. Growth rate for revenue is about 550% for the second year and about 10% for the third year. Change figures in the table below and in the chart above (Growing and Revenue assumptions). Table 3. Sales Forecast for first three years, $ 000 1 M 2 M 3 M 4 M 5 M 6 M 7 M 8 M 9 M 10 M 11 M 12 M Year 1 0 0 0 0 0 0 0 0 0 0 112 112 Year 2 224 112 112 112 112 112 112 112 112 112 112 112 Year 3 336 112 112 112 112 112 112 112 112 112 112 112 224,000 1,344,000 1,344,000 1,344,000 1,344,000 - 112,000 224,000 280,000 280,000 - 200,000 400,000 600,000 800,000 1,000,000 1,200,000 1,400,000 1,600,000 1,800,000 Year 1 Year 2 Year 3 Year 4 Year 5 Outdoor Greenhouse Sales Strategy Figure 5. Sales forecast, $
- 18. While most businesses in any industry try to keep startup costs as low as possible, that isn’t necessarily the best way to proceed when opening a grow. Creating a cost-efficient cultivation site often involves investing in technology and processes that may result in a big near-term hit. Cultivation The three primary methods of cultivation - outdoor, greenhouse and indoor - have different production profiles. Outdoor cultivators produce one harvest per year in the fall, whereas indoor cultivators produce year- round and can generate between 4 and 6 harvests per year. Greenhouse cultivators combine elements of both - exploiting natural light, while leveraging infrastructure and technology - to produce between 1 and 4 harvests per year, though sophisticated, well-equipped greenhouses can run year-round on schedules analogous to indoor production. The result of this mix of cultivation methods is that growers approach the market differently at different times of the year. Since outdoor cultivators produce one large harvest in the fall, which drives prices down, they tend to release product into the market in a controlled manner - selling enough in the fall to generate cash flow to cover expenses, but holding back inventory to release later in the year as prices rise. Thus, outdoor cultivators - in general - are price setters in the fall and price takers in late spring and early summer. As noted in the chart, sellers of outdoor grown flower sold lots averaging 33 pounds in January as they were recouping expenses, and then reduced lot sizes to optimize revenue ahead of the next outdoor harvest. What happened next was not characteristic of prior years, and changed the status-quo. Outdoor growers - encumbered with more inventory than in years past - began to sell larger quantities in June and July, as it became apparent that large quantities of greenhouse grown flower from the first light deprived harvests would Operating Plan
- 19. 18 CANNABIS CULTIVATION Business Plan be coming to market, potentially creating an oversupply situation. While it remains to be seen if last year’s fall harvest has been fully liquidated, the race by outdoor cultivators to preserve value drove prices down as the first light-deprivation harvests of the year hit the market; the average greenhouse deal size nearly doubled from June to July. The average deal size for indoor growers appears to reflect the conventional experience of reduced yields in the late spring and summer, as cooling and humidity control costs increase and growers shutter portions of their operations until conditions for 100% capacity utilization return, generally in September. The Cons of outdoor growing include: ▪ Growing location is government regulated ▪ Dry season requires more effort in watering ▪ Deer like to eat and destroy if not tended Main indoor cons include: ▪ Maintaining proper ventilation is difficult ▪ Higher household energy costs ▪ Pumped with fertilizers Due to the high-energy costs and difficulties with water supplying Company intend to develop marijuana growing business in greenhouses. Those structures are showing an average cost savings of 33% - electric costs for growing marijuana for that way can drop to about $350 a pound. We plan to build xxx greenhouses 3600 sq. ft. each during first 2 years. November 2016 February 2017 June 2017 October 2017 February 2018 June 2018 Greenhouses Include your assumptions. Company intends to start with small indoor space, equipped with white-blue vegging light bulbs, for vegetative growth from January 2017 to get first outdoor summer harvest.
- 20. Greenhouse and Cultivation Design Greenhouses combine the latest technology in HVAC, light deprivation, environmental controls, irrigation, insect exclusion, benching systems, hybrid techniques, and much more to create a systematic and efficient growing approach: 1. The biggest advantage Greenhouse Marijuana Growers have is the abundance of natural light coming into the greenhouse. 2. While cannabis likes long daylight during the vegetative stage, a good blackout system is required for the best flowering production. 3. Heating and Cooling Systems are an important component of the marijuana greenhouse. 4. CO2 is essential for maximizing the quality and production of Marijuana. 5. Ventilation is essential as with all greenhouse crops, however marijuana legislation, and local municipality requirements may also impose strict requirements for eliminating exhaust odors. Our integrated growing solutions will include air filtration systems where required. 6. A nutrient management system is essential for maximizing the production yield of the cannabis plants and ensuring consistent and reliable quality. 7. The brains of the complete marijuana growing system whether a greenhouse production facility or a warehouse grow up is our environmental computer. The computer control systems for a marijuana greenhouse controls and monitor all the nutrients, lights, blackout, air circulation, CO2 and irrigation needs of the plants, it is designed to maintain the exact environment needed for as many different growing zones as you want and can handle different environments for propagation, cloning, flowering and for as many different varieties as you want to control. Company will use rolling benches / growing tables which are highly recommended for any commercial cannabis grow operation. They provide up to 50% more plant space by eliminating the need for a dedicated aisle. With a crop as valuable as marijuana, this directly equates to much higher profits and maximum space efficiency. Main features: ▪ Aluminum extruded sides and ends ▪ Miter cut corners ▪ Hot dipped galvanized steel stands ▪ Aluminum cross members ▪ Snap together fittings ▪ Threaded rods for adjustment up to 12" ▪ Top quality plastic or aluminum flood trays ▪ 13 gauge expanded metal bench tops ▪ 2" diameter rolling tubes Operating Plan
- 21. 20 CANNABIS CULTIVATION Business Plan During regular business hours, our premises will be accessible on request to an identified inspector. Outside of regular business hours, our premises will be accessible on request to an identified inspector who has reason to believe a violation has occurred. Physical Security Plan Premises Access ▪ All external doors and gates will be secured by commercial locks rated to ANSI grade 1 or ▪ similar standards and materials will be available on-site for inspection to verify the security ▪ rating. ▪ During not operating hours, all usable marijuana, harvested plants, and finished product will be stored indoors on the premises in a secure area with all entries secured with a steel door in a steel frame or the equivalent and commercial locks. ▪ When not operating, all exterior doors, windows, or other points of ingress/egress will be locked. Premises Alarm & Monitoring ▪ The premises will have an alarm system programmed to activate upon unauthorized breach of any door, window, or other point of entry. ▪ The alarm system will be capable of detecting unauthorized access to any portion of the premises, including any unenclosed portion of an outdoor production operation. ▪ The alarm system will provide notification to an authorized representative in the event of any unauthorized entry to any portion of the premises. ▪ The alarm system will provide a mechanism to contact law enforce by one or more of the following methods: o At least two “panic buttons” are installed on the premises that can trigger the alarm system and immediately notify a security company or law enforcement. o Mobile “panic buttons” are carried by all license representatives on the premises that can trigger the alarm system and immediately notify a security company or law enforcement. o An operational landline telephone is present at all times within the limited access area that is capable of contacting security or law enforcement.
- 22. Video Surveillance 1. The premises will be equipped with a video surveillance system. 2. Cameras will cover all areas where any marijuana items (including plants and waste) will be present at any time including pathways where product will be moved, without any “blind spots” 3. Cameras will cover all areas within 15 feet of all points of entry/exit from the licensed premises in all directions. 4. All cameras will record continuously 24 hours a day at a resolution of 1280 x 720 pixels or better in all lighting conditions. 5. All cameras will cover areas where marijuana items will be present and all cameras covering the surveillance area record at a minimum of 10 frames per second. 6. All cameras will cover exterior non-limited access areas record at a minimum of 5 frames per second. 7. The surveillance room will contain a list of personnel authorized to access the surveillance system. 8. We will keep a log of all maintenance activity for the surveillance equipment including name of the individual, date and time of access, and reason for access. 9. The surveillance system will include a monitor capable of viewing video from any camera, a digital archiving device, and a printer. 10. The surveillance system will have a backup battery that will provide at least one hour of continuous recording in event of any power failure. 11. An authorized representative will receive immediate notification within one hour of the failure of any security camera or portion of the surveillance system. 12. All required recordings, including the backups of the surveillance area recordings kept for 90 days with a method to store video longer than 90 days if requested. Operating Plan
- 23. 22 CANNABIS CULTIVATION Business Plan Organizational Structure
- 24. CannaCult is a business that will be built on a solid foundation. From the outset, we have decided to recruit only qualified people to man various job positions in our company. We are quite aware of the rules and regulations governing the cannabis industry of which medical marijuana growing falls under which is why we decided to recruit experienced and qualify employees as foundational staff of the organization. We hope to leverage on their expertise to build our business brand to be well accepted in the United States. These are the positions that will be available at CannaCult: Managing Director Greenhouse Growers Outdoor Growers Trimmers Packaging Assistants Sales Representatives Correct the figures according to your plans. Table 4. Personnel plan Q1 Y1 Q2 Y1 Q3 Y1 Q4 Y1 Year 1 Year 2 Year 3 Cultivation People 0 4 8 8 4-8 6-10 10 Salaries, $ 0 40,000 110,000 120,000 270,000 490,000 600,000 Board Head Cultivator Assistant Trimmers/Packagers General Manager Maintenance & General Labor Sales Representatives Organizational Structure Figure 6. Organizational structure
- 26. Financial Plan
- 27. 26 CANNABIS CULTIVATION Business Plan Profit & Loss Forecast Copy and Paste the tables from your business pro forma statements. Business’s revenue is projected to grow significantly during first two years’ timeframe. The yearly projections are in the table below: Table 5. Income Statement, $ YEAR 1 YEAR 2 YEAR 3 YEAR 4 YEAR 5 Revenue 690,188 1,441,125 1,522,125 1,603,125 1,684,125 Direct Costs 361,738 651,450 651,450 651,450 651,450 Gross Profit 328,450 789,675 870,675 951,675 1,032,675 % of revenue 48% 55% 57% 59% 61% Operating Expense Initial & General Costs 85,000 35,000 35,000 35,000 35,000 Operating Expenses (cultivation business) 12,000 12,000 12,000 12,000 12,000 Total Sales & Marketing Expenses 23,255 42,028 44,053 46,078 48,103 Total Senior Management Salaries & Benefits 0 0 0 0 0 Total IT Salaries & Benefits 0 0 0 0 0 Total Other Salaries & Benefits 0 0 0 0 0 Misc. 6,000 6,000 6,000 6,000 6,000 Total Operating Expense 126,255 95,028 97,053 99,078 101,103 Operating Income (EBITDA) 202,195 694,647 773,622 852,597 931,572 % of revenue 29% 48% 51% 53% 55% Depreciation and Amortization 19,800 19,800 19,800 19,800 19,800 Earnings Before Interest & Taxes (EBIT) 182,395 674,847 753,822 832,797 911,772 Interest Expense 0 0 0 0 0 Earnings Before Taxes (EBT) 182,395 674,847 753,822 832,797 911,772 Income Tax 72,958 269,939 301,529 333,119 364,709 Net Income 109,437 404,908 452,293 499,678 547,063 % of revenue 16% 28% 30% 31% 32%
- 28. Cash Flow Statement The cash flow projections show that business will have sufficient cash to support the activity. The following table presents a view of projected cash flow of the business. Table 6. Cash Flow Statement, $ YEAR 1 YEAR 2 YEAR 3 YEAR 4 YEAR 5 Net Income 109,437 404,908 452,293 499,678 547,063 Cash Flow from Operations Depreciation 19,800 19,800 19,800 19,800 19,800 Change in Receivables (77,625) (4,500) (4,500) (4,500) (4,500) Change in Inventory 0 0 0 0 0 Change in Accounts Payable 0 0 0 0 0 Change in Accrued Expenses 0 0 0 0 0 Total Cash Flow from Operations 51,612 420,208 467,593 514,978 562,363 Cash Flow from Investing Capital Expenditures (CAPX) (198,000) 0 0 0 0 Other 0 0 0 0 0 Total Cash Flow from Investing (198,000) 0 0 0 0 Cash Flow from Financing Revolver Issuance / (Repayment) 0 0 0 0 0 Long-Term Debt Issuance / (Repayment) 0 0 0 0 0 New Equity Investments 358,000 0 0 0 0 Dividends 0 0 0 0 0 Total Cash Flow from Financing 358,000 0 0 0 0 Total Change in Cash 211,612 420,208 467,593 514,978 562,363 Beginning Period Cash 0 211,612 631,820 1,099,413 1,614,392 Ending Period Cash 211,612 631,820 1,099,413 1,614,392 2,176,755 Financial Plan
- 29. 28 CANNABIS CULTIVATION Business Plan Balance Sheet The balance sheet shows healthy growth of net worth and strong financial position. Table 7. Balance Sheet, $ YEAR 1 YEAR 2 YEAR 3 YEAR 4 YEAR 5 Assets Current Assets Cash 211,612 631,820 1,099,413 1,614,392 2,176,755 Receivables 77,625 82,125 86,625 91,125 95,625 Inventory 0 0 0 0 0 Total Current Assets 289,237 713,945 1,186,038 1,705,517 2,272,380 Long Term Assets Property Plant & Equipment (PPE), gross 198,000 198,000 198,000 198,000 198,000 Accumulated Depreciation of PPE (19,800) (39,600) (59,400) (79,200) (99,000) PP&E, net 178,200 158,400 138,600 118,800 99,000 Total Assets 467,437 872,345 1,324,638 1,824,317 2,371,380 Liabilities Current Liabilities 0 0 0 0 0 Long Term Liabilities 0 0 0 0 0 Total Liabilities 0 0 0 0 0 Equity Founder Common Stock 0 0 0 0 0 Preferred Stock 0 0 0 0 0 Current Period Net Income 467,437 872,345 1,324,638 1,824,317 2,371,380 Plus: Prior Period Retained Earnings 0 0 0 0 0 Current Period Retained Earnings 467,437 872,345 1,324,638 1,824,317 2,371,380 Total Equity 467,437 872,345 1,324,638 1,824,317 2,371,380 Total Liabilities and Equity 467,437 872,345 1,324,638 1,824,317 2,371,380
- 30. Main Ratios The return on equity ratio (ROE) measures how much the owner and investors earn for their investment in the company. The higher the ratio percentage, the better return is. In general, financial analysts consider return on equity ratios in the 15-20% range as representing attractive levels of investment quality. As we can see ROE for our project is higher and in average draw up 40%. Return on assets (ROA) gives an idea as to how efficient management is at using its assets to generate earnings. Profitability ratios are a class of financial metrics that are used to assess a business's ability to generate earnings as compared to its expenses and other relevant costs incurred during a specific period of time. Table 8. Main Ratios for five years Ratio Analysis Year 2 Year 3 Year 4 Year 5 Avg. Return on Equity 60.4% 41.2% 31.7% 26.1% 39.9% Return on Assets Return on Sales 28.1% 29.7% 31.2% 32.5% 30.4% Asset turnover 2.15 1.39 1.02 0.80 1.34 Profitability Gross Margin 54.8% 57.2% 59.4% 61.3% 58.2% SG&A as % of Sales 6.6% 6.4% 6.2% 6.0% 6.3% Operating Margin 46.8% 49.5% 51.9% 54.1% 50.6% Correct the figures with the figures from the spreadsheet “Main Ratios”. Financial Plan