5The Application of Clinical Systems to the Stud.docx
StefaniaButaPoster_48X36_3col_black
1. Psychosocial Correlates of Patterns of Cortical Activity During Four
Electroencephalography Testing Protocols
Stefania Buta, Nadia Amin, Candice Jaimungal, Jessi Barton, Jessica Herbst, and Jeremy Collings
Table 1.
When administering an EEG, the technician follows a special protocol depending
on the presenting symptoms of the patient. For example, alternating 1-min eyes
open and eyes closed (resting baseline) is administered along with a strobe light to
diagnose seizure activity if the disorder is present. In the case of ADHD,
technicians use a brief eyes open baseline with attention fixed at eye level to the
wall (FDA, 2013).
The purpose of this investigation is to explore four testing protocols, two typical
resting protocol conditions plus two experimental conditions. Our aim was to
document patterns of activity that may vary by brain region, by task, and by
measures of attention and psychological health.
Measurement Diagnostic Utility
Somatosensory evoked potentials Integrity of the spinal cord, brain stem, and thalamus
Continuous measurement
Long term monitoring of brain function for sleep disorders, in ICU, for coma
and cerebral death
Intraoperative monitoring Cerebral function under anesthesia during surgery
Abnormal wave forms Neurodegenerative disorders (e.g., Alzheimer’s Disease)
High frequency bursts Seizure disorder
Alpha band (α)
Most research contexts, e.g. emotion, psychological resilience, attention (most
reliable bandwidth)
Theta/Beta ratio (θ/β) Attention Deficit Hyperactivity Disorder (ADHD)
Introduction
Electroencephalography (EEG) measures patterns of electrical activity in the
brain. Caton (1875) was the first to measure electrical activity in the brains of
animals. Later, Berger (1929) discovered that electrical activity could be measured
from the human brain (see Figure 1). Shortly thereafter and still to present day,
EEG has become popular as a diagnostic tool in hospitals and neurology practices
(see Table 1).
Method
Research volunteers included 44 undergraduate students screened for common
exclusion criteria (Boutros, 2013). The study design includes four segments of
protocol, in a within subjects array. After being prepared for an EEG reading,
participants experienced an extended 8-min baseline (1-min segments of
alternating eyes open and eyes closed); a 10-min video segment of a dyadic
interpersonal interaction; and a survey segment, reporting about an individual
appearing in the dyadic interaction. After the participant run concluded, artifact
was removed by the computer and was visually inspected by a research assistant.
EEG (1-100 Hz) was separated into common bandwidths (see Figure 2) using
spectral analysis (fast Fortier transformation). Power in each bandwidth was
normalized using the log10 transformation.
Discussion
In this study we examined four EEG protocols, resting eyes open, resting eyes
closed, a dyadic social interaction video, and a survey segment. We found that
the four protocols differed significantly in both the α band and for the θ/β ratio.
Furthermore, we found significant difference remained after removing the eyes
closed segment. The effect sizes of these results were moderate to strong. Post-
hoc analyses were significant, and are available upon request.
The design of protocols for EEG is an important issue (Yamada & Meng, 2010).
Prior research has shown that elevated θ in the medial frontal, central, and
parietal areas is associated with ADHD (Loo & Makeig, 2012). Surprisingly, NEBA
patented a single site (Cz) EEG diagnostic system for ADHD using a brief eyes
open resting protocol computing the θ/β ratio (FDA, 2013).
The approval of the NEBA system has raised many concerns in the scientific
community, and we will raise two herein. First, there is growing consensus that
using a single site is insufficient. As a contrast, most EEG work currently measures
from 64, 128, or 256 sites for accurate source location. Second, we are concerned
about the ecological validity of NEBA’s fixation point based protocol. Future
research needs to be conducted exploring designs that better represent real
world situations (representative design). This current study is a step in that
direction by exploring the efficacy of social interactions (on video) and a
performance-based measure of personality judgment (survey). We hope that
future research will continue to explore protocol designs that may be more
representative of daily life experiences.
Author’s Note
We would like to thank Dr. Oulette, Chair, Department of Psychology for her generous support of our laboratory. Thank you to Greg Sharer, Vice
President of Student Affairs, who was the source of inspiration for our project. We would like to also thank Amy Henderson-Harr, Sponsored
Programs. Claire Payne, Psychology Department Secretary, for helping us through our registering needs and laboratory orders. We would like to
thank the Dean, Provost, and the President of the College for their support of undergraduate research.
References
Boutros, N. N. (2013). Standard EEG: A research roadmap for neuropsychiatry. Springer International Publishing.
Loo, S. K., & Makeig, S. (2012). Clinical utility of EEG in attention-deficit/hyperactivity disorder: A research update. Neurotherapeutics, 9(3), 569-587.
Snyder, S. M., Rugino, T. A., Hornig, M., & Stein, M. A. (2015). Integration of an EEG biomarker with a clinician’s ADHD evaluation. Brain and behavior, 5(4).
doi:10.1002/brb3.330
U.S. Food and Drug Administration. (2013). FDA permits marketing of first brain wave test to help assess children and teens for ADHD. Retrieved from
http://www.fda.gov/NewsEvents/Newsroom/PressAnnouncements/ucm360811.htm
Yamada, T., & Meng, E. (2012). Practical guide for clinical neurophysiologic testing: EEG. Lippincott Williams & Wilkins.
Figure 4.
Consistent with prior research (Snyder, Rugino, Hornig, & Stein, 2015; Loo &
Makeig, 2012) these data were analyzed in the central-parietal area for the θ/β
ratio using a repeated measures ANOVA F(3,129) =3.14, p=.028, η=.26. Comparing
only the three eyes open segments, the repeated measures ANOVA was still
significant F(2,86)=6.54, p=.002, η= .36 (see Figure 4).
Results
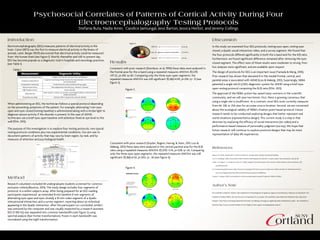
Consistent with prior research (Davidson, et al, 1990) these data were analyzed in
the frontal area for the α band using a repeated measures ANOVA F(3,129)
=97.32, p=.001, η=.83. Comparing only the three eyes open segments, the
repeated measures ANOVA was still significant F(2,86)=4.49, p=.014, η= .31 (see
Figure 3).
Figure 3.