Presentación de Ricky Burdett en Chile: Reevolución Urbana
•
1 gefällt mir•5,362 views

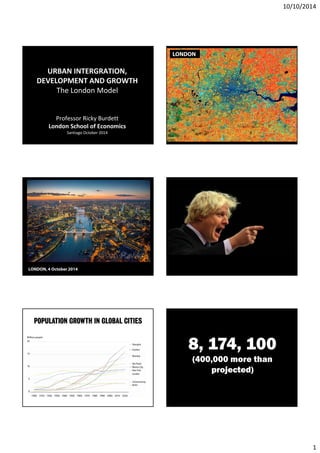
This document discusses urban development and population growth in London. It provides statistics on London's population, which is projected to grow by 400,000 more than originally expected, reaching 8.17 million by 2014. It also notes that 25% of London's growth over the next 20 years is expected to be housed in East London. The document then outlines the powers of the Mayor of London and describes some major transportation and development projects in London, including Crossrail and redevelopments at King's Cross, the Olympic Park, and Canary Wharf.

Empfohlen
Weitere ähnliche Inhalte
Was ist angesagt?
Was ist angesagt? (16)
Andere mochten auch
Andere mochten auch (6)
Ähnlich wie Presentación de Ricky Burdett en Chile: Reevolución Urbana
Ähnlich wie Presentación de Ricky Burdett en Chile: Reevolución Urbana (20)
Kürzlich hochgeladen
Kürzlich hochgeladen (20)
Presentación de Ricky Burdett en Chile: Reevolución Urbana
- 1. 10/10/2014 1 URBAN INTERGRATION, DEVELOPMENT AND GROWTH The London Model Professor Ricky Burdett London School of Economics Santiago October 2014 LONDON LONDON, 4 October 2014 POPULATION GROWTH IN GLOBAL CITIES 8, 174, 100 (400,000 more than projected)
- 2. 10/10/2014 2 Paris REGIONAL DENSITY
- 3. 10/10/2014 3 LONDON GOING EAST 2012‐2030 Central London Olympics/Royal Docks/Thames Gateway 25% of London’s growth is likely to be housed in East London over the next 20 years. LONDON POPULATION OVER TIME GLOBAL FINANCE CIRCUIT GLOBAL CITY RANKING CITY vs. NATIONAL GDP per capita
- 4. 10/10/2014 4 NEW YORK LONDON ADMINISTRATIVE MAP
- 5. 10/10/2014 5 MAYOR OF LONDON POWERS TRANSPORT ENVIRONMENT POLICE/FIRE/AMBULANCE INWARD INVESTMENT PLANNING DIRECTION HOUSING THE ‘LONDON PLAN’ LONDON INDEX OF MULTIPLE DEPRIVATION 2010 Cartography by O’Brien CASA UCL Health Inequalities in London
- 6. 10/10/2014 6 LONDON’S GREEN BELT COMMUTING FLOWS THE LONDON PLAN: Opportunity & Intensification Areas
- 7. 10/10/2014 7 Linking transport to development opportunities: a polycentric city CROSSRAIL £23bn public investment, high-speed rail, opens 2018 $ 23,300m Total Capital Costs 97 System Kilometres 36,000 Capacity [pphpd] Sir Peter Hall (March 1932 – July 2014)
- 8. 10/10/2014 8 Cartography by O’Brien CASA UCL King’s Cross Central THE TRANSPORT STORY …AND INTERNATIONAL TRAVEL *ICE train services to commence soon THE TRANSPORT STORY £2.5 BILLION ON TRANSPORT UPGRADES THE TRANSPORT STORY ...FOR NATIONAL THE TRANSPORT STORY £450M AT KING’S CROSS STATION – KING’S CROSS SQUARE OPENING SEPTEMBER 2013 THE TRANSPORT STORY £200M OF IMPROVEMENTS ON THE UNDERGROUND
- 9. 10/10/2014 9 THE TRANSPORT STORY THE MOST CONNECTED TRANSPORT HUB IN THE CAPITAL…
- 10. 10/10/2014 10 King's Cross ‐ in numbers • 50 new buildings • 2,000 new homes • 20 new streets • 10 new public squares • 67 acres • 8 million square feet • 3.4 million sq ft of workspace • 500,000 sq ft of retail • 26 acres of public space • 45,000 people A NEW DESTINATION REGENT’S CANAL AND THE GRANARY
- 11. 10/10/2014 11 A NEW DESTINATION UNIVERSITY OF THE ARTS LONDON CLICK TO THE SHARD EDIT MASTER SUBTITLE STYLE London Bridge station, 2nd busiest commuter hub in London, before and after construction of The Shard
- 12. 10/10/2014 12 CLICK TO EDIT MASTER SUBTITLE STYLE Cartography by O’Brien CASA UCL City of London Broadgate : redevelopment of Liverpool Street Station, 1985-2000 (Stanhope Properties) Liverpool Street Station, shops and concourse area; Exchange Square above tracks, 1985-1995
- 13. 10/10/2014 13 Richard Rogers, RSH-P, Leadenhall Street, London Cartography by O’Brien CASA UCL Canary Wharf LONDON DOCKLANDS- CANARY WHARF LONDON DOCKLANDS- CANARY WHARF
- 14. 10/10/2014 14 Olympics vs Legacy Planning Olympics: controlled event Legacy: open city
- 15. 10/10/2014 15 Cartography by O’Brien CASA UCL London 2012 The Olympic site in 2003 LONDON 2012: FACTS AND FIGURES CORE BUDGET: £7.8 BN ($13 BN) (30% REGENERATION; 30% VENUES & INFRASTRUCTURE; SECURITY, LAND, ETC) TRANSPORT INVESTMENTS: £5BN ($7 BN) TOTAL INVESTMENT: 1‐2% OF LONDON’S GDP
- 16. 10/10/2014 16 Olympics 2012 Transformation 2014 Legacy 2030 Olympic Games masterplan 2012 Queen Elizabeth II Park £ £ Connections Jobs and homes
- 17. 10/10/2014 17 Permanent/retrofitted venues Velopark Aquatics Centre Media Centre Handball Arena Main Stadium Eton Manor Athletes’ Village Stratford City Temporary or re-locatable venues Training pools Basketball Arena Water Polo Hockey Front‐of‐house Back‐of‐house Warm‐up tracks Athletes’ catering Post‐Games ‘Transformation’ Post‐Games Plan
- 18. 10/10/2014 18 Chobham Manor
- 19. 10/10/2014 19 …a classic London park place Oxford Economics has predicted that by 2030 the area will be one of the UK’s most important growth drivers, and a net contributor to public finances worth £5.4 billion a year. East London is also expected to accommodate half of London’s population growth and nearly a quarter of its growth in jobs to 2031.
- 20. 10/10/2014 20 The Queen Elizabeth Olympic Park The Development Corporation area The Lower Lea Valley East London’s major growth hubs PLAN CREO ANTOFAGASTA Taller 3 Plan Maestro 25 de Septiembre 2014
- 21. 10/10/2014 21 PLAN MAESTRO INTEGRADO - ANTOFAGASTA 2035 668.280 MM 1.215 MM US$ INVERSIÓN { 113 INICIATIVAS 1ERA ETAPA (2018) 45 INICIATIVAS 2DA ETAPA (2025) 41 INICIATIVAS 3ERA ETAPA (2035) 205 INICIATIVAS Thames Estuary ‘Boris Island’ Gatwick 2nd Runway Heathrow 3rd Runway AIRPORTS COMMISSION TO DECIDE ON EXTRA RUNWAY CAPACITY/HUB AIRPORT IN LONDON AND THE SOUTH-EAST X
- 22. 10/10/2014 22 THE HUMANIST CITY THE DIVIDED CITY PARKS AND THE GREAT ESTATES AGGREGATVE AND ORGANIC MERCANTILE AND PRO‐MARKET TOLERANT AND PUBLIC SPIRITED FRAGMENTED URBAN FORM FRAGMENTED GOVERNANCE RESILIENT TO DELIVER SUSTAINABLE URBAN CHANGE: • Long-term vision + short-term projects • Continuity beyond political cycles • Engagement and participation • Consensus and buy-in • Public + Private collaboration • Good design = Value