SlideShare ist ein Scribd-Unternehmen logo
1 von 10
Downloaden Sie, um offline zu lesen
Knowledge. Experience. Integrity.
CALLAN
INSTITUTE
Research
September 2016
Risky Business
	 Interest rates are historically low in the U.S. and abroad. Couple this with modest growth, and fund spon-
sors reluctant to lower return expectations face one of the most difficult investing environments in history.
	 To find out how difficult, Callan experts wondered, “What would an investor need to do to achieve a
7.5% return with the least amount of risk possible?” Using Callan’s proprietary forward-looking capital
market projections, we found that investors in 2015 needed to take on three times as much risk as
they did only 20 years ago.
	 Return-seeking portfolios are now more complex and expensive than ever. Whereas in 1995 a port-
folio made up entirely of fixed income was projected to return 7.5%, by 2015 to achieve comparable
returns that fixed income portion was down to just 12%, with private equity and stocks making up
around three-quarters of the portfolio.
	 The results of our research sent a current through the institutional investing community when they
were first released in The Wall Street Journal. To get the story behind the story, Callan’s Published
Research Group spoke to Jay Kloepfer, head of Capital Market and Alternatives Research at Callan,
and Julia Moriarty, a consultant in our Capital Markets Research group who conducted the analysis,
about the implications of these findings.
Jay Kloepfer
Executive Vice President and Director
Capital Market and Alternatives Research
Julia Moriarty, CFA
Senior Vice President
Capital Markets Research
2
How did this start?
	 Julia	 Jim Callahan, Callan’s Head of Fund Sponsor Consulting, was presenting to a group of public funds. His
purpose was simple: he wanted to show what investors had to do to get a 7.5% return 20 years ago, with
the least amount of risk, versus what they have to do to achieve that same return today. Our hypothesis
was that achieving 7.5% now would require greater risk, complexity, and expense. That turned out to
very much be the case.
How did you prepare the analysis?
	 Julia	 We conduct asset allocation studies for clients in order to determine the risk associated with portfolios that
are designed to generate an expected return. Callan has an optimizing tool that helps us find the “efficient
frontier,” meaning the right combination of assets that provides the highest return for the lowest risk.
In 1995, our expectation for broad U.S. fixed income was exactly 7.5%. We found a 100% fixed income
portfolio was an efficient way to achieve that return, with a standard deviation of just 6% (Exhibit 1).
Ten years later, an investor seeking a 7.5% return would have needed a portfolio containing 48% relatively
risky, return-seeking assets, with just 52% in fixed income. And between 2005 and 2015, an investor had
to risk up the portfolio even more and include 88% in return-seeking assets, with just 12% in fixed income.
Meanwhile, the standard deviation almost doubled from “only” 8.9% in 2005 to 17.2% in 2015.
Standard deviation is a broad measure of risk, so the headline is that in just two decades, the risk required
to achieve a 7.5% return nearly tripled from 6% to 17.2%.
Do these pie charts represent how our clients were actually invested?
	 Jay 	 No, they do not. These asset mixes for 1995, 2005, and 2015 are based on the forward-looking capital
market projections that we created in each of those years. Those projections are our expectations for
risk and return in each asset class, as well as their correlation to one another.
Private
Equity
12%
Non-U.S.
Equity
22%
U.S. Large
Cap
33%
Fixed
Income
12%
Real
Estate
13%
U.S.
Small
Cap
8%
Private Equity 4%
Non-U.S.
Equity
14%
U.S. Large
Cap
20%
Fixed
Income
52%
Real Estate 5%
U.S. Small Cap
5%
Broad U.S.
Fixed Income
100%
Increasing Complexity
Increasing Risk
1995
Expected Return: 7.5%
Standard Deviation: 6.0%
2005
Expected Return: 7.5%
Standard Deviation: 8.9%
2015
Expected Return: 7.5%
Standard Deviation: 17.2%
Exhibit 1
Same Return,
Increasing Risk
Projected portfolio
returns over past
20 years
Source: Callan Capital Market Projections
3Knowledge. Experience. Integrity.
Our projections for virtually all asset classes have come down gradually over the years. The unnerving
consequence of lowering capital market projections is that if an institutional investor does not lower its total
fund return requirement, that investor will have to keep taking on more and more risk. Driving fixed income
allocations down to 12% means investors do not have a lot of protection in a deflationary environment. The
“safe asset” or bedrock against which they take risk gets smaller.
It also means they face a great deal of volatility, as a 17.2% standard deviation represents equity-like
volatility for the total portfolio.
Would you say that investors are taking on more risk, complexity, and expense for lower returns?
	 Jay	 A better way of saying it is that many investors are reaching for risk in order to achieve return expecta-
tions that they are unwilling to lower.
Were you surprised at what you found?
	 Julia 	 Yes and no. We were fairly certain that plans had to increase risk when they were reluctant to lower their
expected return. With the decline in interest rates, and bond yields correspondingly falling, plans have to
take on more risk in the form of equities and illiquid investments to achieve the same expected return.
I think we were surprised at the size of the shift in the model portfolio’s assets. To see the decline from
100% fixed income to 52% to 12%—the magnitude was surprising. The fact that an investor had to take on
three times the risk to achieve the same return was surprising as well.
	 Jay 	 In 2015 fund sponsors would have loved to hold nothing but bonds—if only they returned something.
Now sponsors have to invest in more asset classes, and these asset classes are more complicated and
time-consuming, which results in greater expense.
Are standard deviation and risk synonymous?
	 Jay	 Standard deviation represents a variability of results, which is more or less the broadest definition of
investment risk. It is a measure of how far returns can range. A bigger standard deviation means a
greater range of potential outcomes. It represents how much returns could be over or under expected
results. The typical statistical reading is that one standard deviation around
the expected case captures about 68% of potential results, and two standard
deviations about 96%.
To illustrate this point, assume that in 1995 an investor had a 7.5% return
expectation with a standard deviation of 6.0%. One standard deviation down
would be a +1.5% return and one up would be +13.5%. Two standard devia-
tions would be -4.5% to as high as +19.5%. That is a fairly narrow range.
For a standard deviation of 17.2%, which is what we projected for the 2015
portfolio, the risk is much, much higher: Two standard deviations would yield
a range of -26.9% to +41.9%.
1 SD
34%
2 SD
14%
1 SD
34%
2 SD
14%
96%
Standard Deviation (SD) Bell Curve
4
What would happen to expected returns if standard deviation was held constant?
	 Julia	 We conducted that analysis, holding standard deviation at 6.0%. Based on our capital market projections
in each of those years, expected returns fell from 7.5% in 1995 to 4.8% in 2015 (Exhibit 2).
Private
Equity 3%
Non-U.S.
Equity 8%
U.S. Large
Cap 11%
Fixed
Income
71%
Real Estate
4%
U.S. Small
Cap 3%
Private Equity 2%
Non-U.S.
Equity
9%
U.S. Large
Cap 13%
Fixed
Income
70%
Real Estate 3%
U.S. Small
Cap 3%
Increasing Complexity
Decreasing Returns
1995
Expected Return: 7.5%
Standard Deviation: 6.0%
2005
Expected Return: 6.5%
Standard Deviation: 6.0%
2015
Expected Return: 4.8%
Standard Deviation: 6.0%
Broad U.S.
Fixed Income
100%
Source: Callan Capital Market Projections
Fiscal Year
Latest2013201220112010200920082007200620052004200320022001
8.5%
>8.0% <8.5%
8.0%
>7.5% <8.0%
>7.0% -7.5%
7.0%
<7.0%
>8.5%
8.5%
>8.0% <8.5%
8.0%
>7.5% <8.0%
>7.0% -7.5%
7.0%
Funds’returnexpectations
Exhibit 2
Same Risk,
Decreasing Returns
When target risk is
held at 6.0% expected
returns fall from 7.5% in
1995 to 4.8% in 2015
Exhibit 3
Public Funds
Historical changes
to long-term return
assumptions
Source: Compiled by NASRA based on Public Fund Survey
When did 7.5% become the “Holy Grail” for institutional investors?
	 Julia	 It has evolved. It begins with expected return, which is also known as the “discount rate.” A discount rate
of “X” means the money in the corpus of a pension fund is expected to grow by that amount. Given that
expectation, a fund sponsor needs to figure out how the money should be invested in order to achieve
that rate of return.
The discount rate used to be almost 9% when capital market projections were much higher in the late
1980s and early 1990s. Then the typical rate went down to 8.5%, then 8%, and now 7.5% (Exhibit 3),
which is still a bit optimistic given current expectations.
5Knowledge. Experience. Integrity.
Were you having similar conversations about risk in 2005?
	 Jay	 Yes, although the return bogey was not 7.5%. It was closer to 8.5%.
In the late 1990s there was a lot of pressure from plan sponsors on actuaries and advisors to raise discount
rates because there had been a period of such incredible capital market performance. They would say,
“Why would you put the discount rate at 8%? It will force us to put too much money in the plan. We should
put the discount rate at 10%.”
Then we suffered through the almost three-year-long bear market from spring 2000 to well into 2002. The
S&P lost half its value, and fund sponsors had to reassess because they were no longer at a 120% funding
level. They had to gradually start bringing down assumptions.
What is the culprit in all of this?
	 Julia	 There has been a secular decline in interest rates and bond yields (Exhibit 4). Callan has been doing
capital markets projections since the early 1980s and in 1989 our forward-looking projection for fixed
income was 9.4%. Post-financial crisis, the world financial system entered an era of unprecedented
monetary easing.
	 Jay	 Between 2005 and 2015, we saw the tail end of the real estate boom and a bubble in mortgage-backed
securities. That bubble burst, which launched the global financial crisis.
Governments and central banks around the world embarked on a unified, worldwide fiscal and monetary
response. This response drove interest rates to zero as a way to keep liquidity going, to keep the economy
moving, and to push investors into risk assets, because risk assets were expected to create economic
growth. The thinking was: Don’t let people sit on piles of money; instead, make it so painful that they have
to go invest.
0%
2%
4%
6%
8%
10%
12%
14%
16%
1980 1982 1990198819861984 1992 199819961994 2000 2002 2004 2006 2008 2010 2012 2014 2016
Exhibit 4
A Decades-Long Slide
10-year Treasury yields
(December 1979 to
July 2016)
Source: Federal Reserve System
6
Only in hindsight will it be clear if this policy has been successful. One can argue that this zero-interest rate
policy kept the world financial system from going into a deep, dark tailspin from which it may have not yet
emerged. However, investors have to live with this overhang of historically low interest rates.
Low interest rates are great for borrowers, but they are not so good for savers or investors. In 1995, a saver
could get 7.5% on an account attached to bonds. An investor could live off that yield. Now to get to 7.5%,
an investor must have a portfolio that is much riskier and much more complex. An all-bond portfolio today
would produce a 2.0% return, which is far too low. The investor would have to eat into the corpus or take
a lot more risk.
If you look at this information from the standpoint of a public fund, it appears there are three poten-
tial paths. Path One is to lower return assumptions, leading to increased contributions. Path Two is
to lower benefits. Path Three is to maintain return assumptions and load up on risk. None of these
are particularly appealing. Is there a fourth path anywhere?
	 Julia	 A fourth path is a variation of Path Three, where instead of increasing risk in the form of beta exposure,
plans are attempting to restructure their portfolios to increase alpha. This is a path that many fund spon-
sors are taking.
Finally, funds can also do a little bit of each: lower return assumptions (leading to increased contributions)
and reduce benefits while increasing risk. It is not all-or-nothing.
Why would an investor maintain a 7.5% expectation at this point?
	 Jay	 There are significant real-life implications to lowering that expectation. Take a public pension plan with a
7.5% return target that decides to move its discount rate to 6.5% to lower its risk. When the calculation is
done to see how well-funded the plan is and how much money needs to be put in, the funded status will
go down and the amount of money that must be contributed goes up for a given level of benefits. A higher
required contribution means less spending elsewhere in the sponsor’s budget, or perhaps it means a
tax increase. Alternatively, lower funded status could force a reduction in benefits. Changing the return
target has impacts measured in real dollars, and this is a dilemma that a lot of our clients face.
The other challenge is that the typical public pension is well below 100% funded. They are not really earn-
ing 7.5% relative to their liabilities. They may only be getting 65-75 cents on the dollar, so now that fund is
compelled to have to reach even further and take on more risk, not less.
	 Julia	 There is also a political aspect to pension funding and the setting of the investment return target, which
is why some may be reticent to address it. Some of this is definitely hard news.
What about taking the long view? If an investor averages a return of 7.5% over the long term, do
these lean years matter all that much?
	 Jay	 The path to getting to 7.5% can matter a lot, especially when you attach dollars to it. This phenomenon
is called “return sequencing.” Let’s say there are two public funds with two large pools of money that
average a 7.5% return over 10 years, both of which are distributing cash over that period of time. Pool A
has a couple of bad years up front, whereas Pool B has its bad years interspersed. Pool A may very well
come away with less money.
7Knowledge. Experience. Integrity.
There are time-horizon issues too. What have pensions done over the past 30 to 40 years? Have they
generated 7.5%? Yes, they have. But what were the circumstances under which they achieved this return?
Interest rates were higher. Stock market returns were higher than current forward-looking projections.
What is a reasonable set of expectations going forward? The path forward is not clear because of the
current zero-interest-rate policy. We will enter uncharted territory once interest rates start to go back up.
If an investor has a horizon of 30 or 40 years, it is not unreasonable to expect that returns will revert to their
long-term mean, which is higher than our current projections. These long-term investors think, “I probably
shouldn’t make too big a strategic move with my plan based on the last five years.” That may work out, but
if there are a couple of missteps in the capital markets that are concentrated, and those missteps drive the
funded status into a place where the financial condition of the fund is now in peril, the fund sponsor may
never get to enjoy the benefits of that 7.5%.
We conducted this analysis pre-Brexit. How does the Brexit affect this environment?
	 Jay	 The Brexit just exacerbates the problem. We did this analysis at a point when everyone expected inter-
est rates to rise toward 3% or higher over the next couple of years, and even that did not allow for a lot
of fixed income in a portfolio if the investor had a 7.5% return requirement.
Now interest rates have plummeted even more. It was tough getting to 7.5% before; it is even harder
post-Brexit.
Key questions for investors to consider
Given the nearly three-fold increase in risk required to produce a 7.5% return in 2015 compared to
1995, investors should consider these critical questions in evaluating their portfolios:
1.	 What is the purpose of each asset class in the portfolio?
2.	 Is the fund’s fixed income exposure a sufficient enough anchor against risk?
3.	 Is the fund’s fixed income exposure really “fixed income,” or is it filled with investments that have
a lot of equity-like risks, such as credit?
4.	 How far can the fund go in terms of exposure to fixed income?
5.	 Is there something else the investor can do to lower risk?
6.	 Is the fund still comfortable with its return target, and the resulting risk in the portfolio?
7.	 Is the portfolio truly a reflection of its tolerance for risk?
8.	 Can the fund handle lowering return expectations?
9.	 If not, then what changes can it make?
8
Biographies
Jay V. Kloepfer is an Executive Vice President and the Director of Capital Market and Alternatives
Research. Jay oversees Callan’s Capital Markets, Hedge Fund and Private Markets research groups.
The Capital Markets group helps Callan’s fund sponsor clients with their strategic planning, conducting
asset allocation and asset/liability studies, developing optimal investment manager structures, evaluating
defined contribution plan investment lineups and providing custom research on a variety of investment top-
ics. The Hedge Fund and Private Markets groups are responsible for specialized consulting including asset
class and strategy research, manager searches, portfolio reviews, and performance evaluation.
Jay is the author of the “Callan Periodic Table of Investment Returns,” which he created in 1999. He is
a member of Callan’s Management Committee and is a shareholder of the firm. Jay earned an MA in
Economics from Stanford and a BS with honors in Economics from the University of Oregon.
Julia A. Moriarty, CFA, is a Senior Vice President and a consultant in the Capital Markets Research
group. She is responsible for assisting plan sponsor clients with their strategic planning, conducting asset
allocation studies, developing optimal investment manager structures, and providing custom research on a
variety of investment topics. Julia joined Callan in 1990 as an analyst in the Client Report Services group,
working on the production of comprehensive performance measurement reports and the implementation
and testing of new products. Prior to joining the Capital Markets Research group, she was a Software
Solutions Consultant in the Client Software Department. Julia is a shareholder of the firm.
Julia earned an MBA from the University of California at Berkeley’s Haas School of Business and a BS
in Finance from California Polytechnic State University at San Luis Obispo. She earned the right to use
the Chartered Financial Analyst designation and is a member of the CFA Society of San Francisco and
CFA Institute.
.
9Knowledge. Experience. Integrity.
Certain information herein has been compiled by Callan and is based on information provided by a variety of sources believed to be
reliable for which Callan has not necessarily verified the accuracy or completeness of or updated. This report is for informational pur-
poses only and should not be construed as legal or tax advice on any matter. Any investment decision you make on the basis of this
report is your sole responsibility. You should consult with legal and tax advisers before applying any of this information to your particular
situation. Reference in this report to any product, service or entity should not be construed as a recommendation, approval, affiliation or
endorsement of such product, service or entity by Callan. Past performance is no guarantee of future results. This report may consist
of statements of opinion, which are made as of the date they are expressed and are not statements of fact. The Callan Institute (the
“Institute”) is, and will be, the sole owner and copyright holder of all material prepared or developed by the Institute. No party has the
right to reproduce, revise, resell, disseminate externally, disseminate to subsidiaries or parents, or post on internal web sites any part of
any material prepared or developed by the Institute, without the Institute’s permission. Institute clients only have the right to utilize such
material internally in their business.
If you have any questions or comments, please email institute@callan.com.
About Callan
Callan was founded as an employee-owned investment consulting firm in 1973. Ever since, we have
empowered institutional clients with creative, customized investment solutions that are uniquely backed
by proprietary research, exclusive data, ongoing education and decision support. Today, Callan advises
on more than $2 trillion in total assets, which makes us among the largest independently owned invest-
ment consulting firms in the U.S. We use a client-focused consulting model to serve public and private
pension plan sponsors, endowments, foundations, operating funds, smaller investment consulting firms,
investment managers, and financial intermediaries. For more information, please visit www.callan.com.
About the Callan Institute
The Callan Institute, established in 1980, is a source of continuing education for those in the institutional
investment community. The Institute conducts conferences and workshops and provides published research,
surveys, and newsletters. The Institute strives to present the most timely and relevant research and educa-
tion available so our clients and our associates stay abreast of important trends in the investments industry.
© 2016 Callan Associates Inc.
Corporate Headquarters
Callan Associates
600 Montgomery Street
Suite 800
San Francisco, CA 94111
800.227.3288 / 415.974.5060
www.callan.com
Twitter: @CallanAssoc
Follow us on LinkedIn
Regional Offices
Atlanta
800.522.9782
Chicago
800.999.3536
Denver
855.864.3377
New Jersey
800.274.5878

Weitere ähnliche Inhalte

Was ist angesagt?

Investments For Life
Investments For LifeInvestments For Life
Investments For LifeMBritos
 
Six Sigma Investing
Six Sigma InvestingSix Sigma Investing
Six Sigma Investingkorte925
 
Diversifying Away Equity Exposure
Diversifying Away Equity ExposureDiversifying Away Equity Exposure
Diversifying Away Equity ExposureWindham Labs
 
Beyond the Equity Risk Premia
Beyond the Equity Risk PremiaBeyond the Equity Risk Premia
Beyond the Equity Risk PremiaWindham Labs
 
Class Investing Basics
Class Investing BasicsClass Investing Basics
Class Investing BasicsSocial Thread
 
14 hartford funds hartford balanced income fund
14 hartford funds hartford balanced income fund14 hartford funds hartford balanced income fund
14 hartford funds hartford balanced income fund123jumpad
 
Ashton Global Factsheet - Kijana Mack
Ashton Global Factsheet - Kijana MackAshton Global Factsheet - Kijana Mack
Ashton Global Factsheet - Kijana MackKijana Mack
 
Deep Value and the Aquirer's Multiple by Tobias Carlisle for QuantCon 2016
Deep Value and the Aquirer's Multiple by Tobias Carlisle for QuantCon 2016Deep Value and the Aquirer's Multiple by Tobias Carlisle for QuantCon 2016
Deep Value and the Aquirer's Multiple by Tobias Carlisle for QuantCon 2016Quantopian
 
Investing for a lifetime
Investing for a lifetimeInvesting for a lifetime
Investing for a lifetimetubesock
 
Market Perspectives June 2014
Market Perspectives June 2014Market Perspectives June 2014
Market Perspectives June 2014David Berger
 
Investor Worries
Investor WorriesInvestor Worries
Investor Worrieskamlesh2008
 

Was ist angesagt? (18)

5 smart-investing-strategies
5 smart-investing-strategies 5 smart-investing-strategies
5 smart-investing-strategies
 
Investments For Life
Investments For LifeInvestments For Life
Investments For Life
 
Six Sigma Investing
Six Sigma InvestingSix Sigma Investing
Six Sigma Investing
 
Diversifying Away Equity Exposure
Diversifying Away Equity ExposureDiversifying Away Equity Exposure
Diversifying Away Equity Exposure
 
Beyond the Equity Risk Premia
Beyond the Equity Risk PremiaBeyond the Equity Risk Premia
Beyond the Equity Risk Premia
 
Class Investing Basics
Class Investing BasicsClass Investing Basics
Class Investing Basics
 
14 hartford funds hartford balanced income fund
14 hartford funds hartford balanced income fund14 hartford funds hartford balanced income fund
14 hartford funds hartford balanced income fund
 
Ashton Global Factsheet - Kijana Mack
Ashton Global Factsheet - Kijana MackAshton Global Factsheet - Kijana Mack
Ashton Global Factsheet - Kijana Mack
 
The Seventh Generation Paradox
The Seventh Generation ParadoxThe Seventh Generation Paradox
The Seventh Generation Paradox
 
Assessing Your Risk Appetite
Assessing Your Risk AppetiteAssessing Your Risk Appetite
Assessing Your Risk Appetite
 
An Abundant Retirement
An Abundant RetirementAn Abundant Retirement
An Abundant Retirement
 
Elmwood quarterly insights
Elmwood quarterly insightsElmwood quarterly insights
Elmwood quarterly insights
 
Deep Value and the Aquirer's Multiple by Tobias Carlisle for QuantCon 2016
Deep Value and the Aquirer's Multiple by Tobias Carlisle for QuantCon 2016Deep Value and the Aquirer's Multiple by Tobias Carlisle for QuantCon 2016
Deep Value and the Aquirer's Multiple by Tobias Carlisle for QuantCon 2016
 
Investing for a lifetime
Investing for a lifetimeInvesting for a lifetime
Investing for a lifetime
 
2010 Investment Outlook
2010 Investment Outlook2010 Investment Outlook
2010 Investment Outlook
 
Inheritance, Retirement & Cash Flow
Inheritance, Retirement & Cash FlowInheritance, Retirement & Cash Flow
Inheritance, Retirement & Cash Flow
 
Market Perspectives June 2014
Market Perspectives June 2014Market Perspectives June 2014
Market Perspectives June 2014
 
Investor Worries
Investor WorriesInvestor Worries
Investor Worries
 

Andere mochten auch

Momentum: The Trend Is Your Friend
Momentum: The Trend Is Your FriendMomentum: The Trend Is Your Friend
Momentum: The Trend Is Your FriendCallan
 
Ethics 101 for Investment Professionals
Ethics 101 for Investment ProfessionalsEthics 101 for Investment Professionals
Ethics 101 for Investment ProfessionalsCallan
 
2017 Capital Market Projections (Callan)
2017 Capital Market Projections (Callan)2017 Capital Market Projections (Callan)
2017 Capital Market Projections (Callan)Callan
 
Asset Managers and ESG
Asset Managers and ESGAsset Managers and ESG
Asset Managers and ESGCallan
 
DC Fiduciary Handbook 2016
DC Fiduciary Handbook 2016DC Fiduciary Handbook 2016
DC Fiduciary Handbook 2016Callan
 
2016 ESG Interest and Implementation Survey
2016 ESG Interest and Implementation Survey2016 ESG Interest and Implementation Survey
2016 ESG Interest and Implementation SurveyCallan
 
Callan 2017-2026 Capital Market Projections
Callan 2017-2026 Capital Market ProjectionsCallan 2017-2026 Capital Market Projections
Callan 2017-2026 Capital Market ProjectionsCallan
 
Callan Periodic Table of Investment Returns 2017
Callan Periodic Table of Investment Returns 2017Callan Periodic Table of Investment Returns 2017
Callan Periodic Table of Investment Returns 2017Callan
 
Callan NDT Study 2016
Callan NDT Study 2016Callan NDT Study 2016
Callan NDT Study 2016Callan
 
2013 Callan Cost of Doing Business Survey: U.S. Funds and Trusts
2013 Callan Cost of Doing Business Survey: U.S. Funds and Trusts2013 Callan Cost of Doing Business Survey: U.S. Funds and Trusts
2013 Callan Cost of Doing Business Survey: U.S. Funds and TrustsCallan
 
The Outsourced Chief Investment Officer Model: One Size Does Not Fit All
The Outsourced Chief Investment Officer Model: One Size Does Not Fit AllThe Outsourced Chief Investment Officer Model: One Size Does Not Fit All
The Outsourced Chief Investment Officer Model: One Size Does Not Fit AllCallan
 
2016 Defined Contribution Trends Survey
2016 Defined Contribution Trends Survey2016 Defined Contribution Trends Survey
2016 Defined Contribution Trends SurveyCallan
 
Callan DC Survey Key Findings 2017
Callan DC Survey Key Findings 2017Callan DC Survey Key Findings 2017
Callan DC Survey Key Findings 2017Callan
 
2014 Callan Investment Manager Fee Survey
2014 Callan Investment Manager Fee Survey2014 Callan Investment Manager Fee Survey
2014 Callan Investment Manager Fee SurveyCallan
 
Technology Content Marketing 2017 - Benchmarks, Budgets & Trends - North America
Technology Content Marketing 2017 - Benchmarks, Budgets & Trends - North AmericaTechnology Content Marketing 2017 - Benchmarks, Budgets & Trends - North America
Technology Content Marketing 2017 - Benchmarks, Budgets & Trends - North AmericaContent Marketing Institute
 

Andere mochten auch (15)

Momentum: The Trend Is Your Friend
Momentum: The Trend Is Your FriendMomentum: The Trend Is Your Friend
Momentum: The Trend Is Your Friend
 
Ethics 101 for Investment Professionals
Ethics 101 for Investment ProfessionalsEthics 101 for Investment Professionals
Ethics 101 for Investment Professionals
 
2017 Capital Market Projections (Callan)
2017 Capital Market Projections (Callan)2017 Capital Market Projections (Callan)
2017 Capital Market Projections (Callan)
 
Asset Managers and ESG
Asset Managers and ESGAsset Managers and ESG
Asset Managers and ESG
 
DC Fiduciary Handbook 2016
DC Fiduciary Handbook 2016DC Fiduciary Handbook 2016
DC Fiduciary Handbook 2016
 
2016 ESG Interest and Implementation Survey
2016 ESG Interest and Implementation Survey2016 ESG Interest and Implementation Survey
2016 ESG Interest and Implementation Survey
 
Callan 2017-2026 Capital Market Projections
Callan 2017-2026 Capital Market ProjectionsCallan 2017-2026 Capital Market Projections
Callan 2017-2026 Capital Market Projections
 
Callan Periodic Table of Investment Returns 2017
Callan Periodic Table of Investment Returns 2017Callan Periodic Table of Investment Returns 2017
Callan Periodic Table of Investment Returns 2017
 
Callan NDT Study 2016
Callan NDT Study 2016Callan NDT Study 2016
Callan NDT Study 2016
 
2013 Callan Cost of Doing Business Survey: U.S. Funds and Trusts
2013 Callan Cost of Doing Business Survey: U.S. Funds and Trusts2013 Callan Cost of Doing Business Survey: U.S. Funds and Trusts
2013 Callan Cost of Doing Business Survey: U.S. Funds and Trusts
 
The Outsourced Chief Investment Officer Model: One Size Does Not Fit All
The Outsourced Chief Investment Officer Model: One Size Does Not Fit AllThe Outsourced Chief Investment Officer Model: One Size Does Not Fit All
The Outsourced Chief Investment Officer Model: One Size Does Not Fit All
 
2016 Defined Contribution Trends Survey
2016 Defined Contribution Trends Survey2016 Defined Contribution Trends Survey
2016 Defined Contribution Trends Survey
 
Callan DC Survey Key Findings 2017
Callan DC Survey Key Findings 2017Callan DC Survey Key Findings 2017
Callan DC Survey Key Findings 2017
 
2014 Callan Investment Manager Fee Survey
2014 Callan Investment Manager Fee Survey2014 Callan Investment Manager Fee Survey
2014 Callan Investment Manager Fee Survey
 
Technology Content Marketing 2017 - Benchmarks, Budgets & Trends - North America
Technology Content Marketing 2017 - Benchmarks, Budgets & Trends - North AmericaTechnology Content Marketing 2017 - Benchmarks, Budgets & Trends - North America
Technology Content Marketing 2017 - Benchmarks, Budgets & Trends - North America
 

Ähnlich wie Risky Business

Jeff Pesta, LUTCF – Proactive Advisor Magazine – Volume 5 Issue 11
Jeff Pesta, LUTCF – Proactive Advisor Magazine – Volume 5 Issue 11Jeff Pesta, LUTCF – Proactive Advisor Magazine – Volume 5 Issue 11
Jeff Pesta, LUTCF – Proactive Advisor Magazine – Volume 5 Issue 11Proactive Advisor Magazine
 
Chapter7 an introduction to risk and return
Chapter7 an introduction to risk and returnChapter7 an introduction to risk and return
Chapter7 an introduction to risk and returnRodel Falculan
 
Measuring risk in 2018
Measuring risk in 2018Measuring risk in 2018
Measuring risk in 2018Windham Labs
 
Market Volatility - Fight or Flight
Market Volatility - Fight or FlightMarket Volatility - Fight or Flight
Market Volatility - Fight or FlightIan Po
 
iPlanner Investment Philosophy
iPlanner Investment PhilosophyiPlanner Investment Philosophy
iPlanner Investment PhilosophyEd Sotiri
 
Cardinal quarterly october 2012
Cardinal quarterly   october 2012Cardinal quarterly   october 2012
Cardinal quarterly october 2012KimGibson
 
11 eaton vance volatility - the black widow returns
11 eaton vance volatility - the black widow returns11 eaton vance volatility - the black widow returns
11 eaton vance volatility - the black widow returns123jumpad
 
Guideto Asset Allocation
Guideto Asset AllocationGuideto Asset Allocation
Guideto Asset Allocationsreising
 
Guideto Asset Allocation
Guideto Asset AllocationGuideto Asset Allocation
Guideto Asset Allocationsreising
 
Sprung investment management commentary 4th quarter, 2013
Sprung investment management commentary   4th quarter, 2013Sprung investment management commentary   4th quarter, 2013
Sprung investment management commentary 4th quarter, 2013Robert Champion
 
New perspectives on asset class investing
New perspectives on asset class investingNew perspectives on asset class investing
New perspectives on asset class investingRobUgiansky
 
Abacus Weath Partners Investment slideshow
Abacus Weath Partners Investment slideshowAbacus Weath Partners Investment slideshow
Abacus Weath Partners Investment slideshowAbacus Wealth Partners
 
Target Retirement Income Planning
Target Retirement Income PlanningTarget Retirement Income Planning
Target Retirement Income PlanningMartin Andelman
 
NEW PRESENTATION
NEW PRESENTATIONNEW PRESENTATION
NEW PRESENTATIONPaul Fraker
 
Perspectives Winter-2015-2016
Perspectives Winter-2015-2016Perspectives Winter-2015-2016
Perspectives Winter-2015-2016Jeff Snyder
 
Chapter 7Finding the Required Rate of Return for an Invest.docx
Chapter 7Finding the Required Rate of Return for an Invest.docxChapter 7Finding the Required Rate of Return for an Invest.docx
Chapter 7Finding the Required Rate of Return for an Invest.docxmccormicknadine86
 
Income Matching Using Bonds NorCal 2011
Income Matching Using Bonds NorCal 2011Income Matching Using Bonds NorCal 2011
Income Matching Using Bonds NorCal 2011Brent Burns
 

Ähnlich wie Risky Business (20)

Jeff Pesta, LUTCF – Proactive Advisor Magazine – Volume 5 Issue 11
Jeff Pesta, LUTCF – Proactive Advisor Magazine – Volume 5 Issue 11Jeff Pesta, LUTCF – Proactive Advisor Magazine – Volume 5 Issue 11
Jeff Pesta, LUTCF – Proactive Advisor Magazine – Volume 5 Issue 11
 
Chapter7 an introduction to risk and return
Chapter7 an introduction to risk and returnChapter7 an introduction to risk and return
Chapter7 an introduction to risk and return
 
Measuring risk in 2018
Measuring risk in 2018Measuring risk in 2018
Measuring risk in 2018
 
Market Volatility - Fight or Flight
Market Volatility - Fight or FlightMarket Volatility - Fight or Flight
Market Volatility - Fight or Flight
 
iPlanner Investment Philosophy
iPlanner Investment PhilosophyiPlanner Investment Philosophy
iPlanner Investment Philosophy
 
Cardinal quarterly october 2012
Cardinal quarterly   october 2012Cardinal quarterly   october 2012
Cardinal quarterly october 2012
 
11 eaton vance volatility - the black widow returns
11 eaton vance volatility - the black widow returns11 eaton vance volatility - the black widow returns
11 eaton vance volatility - the black widow returns
 
Guideto Asset Allocation
Guideto Asset AllocationGuideto Asset Allocation
Guideto Asset Allocation
 
Guideto Asset Allocation
Guideto Asset AllocationGuideto Asset Allocation
Guideto Asset Allocation
 
New World
New WorldNew World
New World
 
Sprung investment management commentary 4th quarter, 2013
Sprung investment management commentary   4th quarter, 2013Sprung investment management commentary   4th quarter, 2013
Sprung investment management commentary 4th quarter, 2013
 
New perspectives on asset class investing
New perspectives on asset class investingNew perspectives on asset class investing
New perspectives on asset class investing
 
Abacus Weath Partners Investment slideshow
Abacus Weath Partners Investment slideshowAbacus Weath Partners Investment slideshow
Abacus Weath Partners Investment slideshow
 
Target Retirement Income Planning
Target Retirement Income PlanningTarget Retirement Income Planning
Target Retirement Income Planning
 
NEW PRESENTATION
NEW PRESENTATIONNEW PRESENTATION
NEW PRESENTATION
 
Investment Presentation August 2010
Investment Presentation August 2010Investment Presentation August 2010
Investment Presentation August 2010
 
Perspectives Winter-2015-2016
Perspectives Winter-2015-2016Perspectives Winter-2015-2016
Perspectives Winter-2015-2016
 
Chapter 7Finding the Required Rate of Return for an Invest.docx
Chapter 7Finding the Required Rate of Return for an Invest.docxChapter 7Finding the Required Rate of Return for an Invest.docx
Chapter 7Finding the Required Rate of Return for an Invest.docx
 
Risk and Return
Risk and ReturnRisk and Return
Risk and Return
 
Income Matching Using Bonds NorCal 2011
Income Matching Using Bonds NorCal 2011Income Matching Using Bonds NorCal 2011
Income Matching Using Bonds NorCal 2011
 

Mehr von Callan

The Renaissance of Stable Value: Capital Preservation in Defined Contribution
The Renaissance of Stable Value: Capital Preservation in Defined ContributionThe Renaissance of Stable Value: Capital Preservation in Defined Contribution
The Renaissance of Stable Value: Capital Preservation in Defined ContributionCallan
 
Grading the Pensions Protection Act, 10 Years Later
Grading the Pensions Protection Act, 10 Years LaterGrading the Pensions Protection Act, 10 Years Later
Grading the Pensions Protection Act, 10 Years LaterCallan
 
Target Date Funds - Finding the Right Vehicle for the Road to Retirement
Target Date Funds - Finding the Right Vehicle for the Road to RetirementTarget Date Funds - Finding the Right Vehicle for the Road to Retirement
Target Date Funds - Finding the Right Vehicle for the Road to RetirementCallan
 
Defined Contribution Plans and Fee Lawsuits: Stuck in the Mud or the Road to ...
Defined Contribution Plans and Fee Lawsuits: Stuck in the Mud or the Road to ...Defined Contribution Plans and Fee Lawsuits: Stuck in the Mud or the Road to ...
Defined Contribution Plans and Fee Lawsuits: Stuck in the Mud or the Road to ...Callan
 
Active Share and Product Pairs Analysis
Active Share and Product Pairs AnalysisActive Share and Product Pairs Analysis
Active Share and Product Pairs AnalysisCallan
 
Emerging Managers: Small Firms with Big Ideas
Emerging Managers: Small Firms with Big IdeasEmerging Managers: Small Firms with Big Ideas
Emerging Managers: Small Firms with Big IdeasCallan
 
Managing Defined Contribution Plan Investments: A Fiduciary Handbook
Managing Defined Contribution Plan Investments: A Fiduciary HandbookManaging Defined Contribution Plan Investments: A Fiduciary Handbook
Managing Defined Contribution Plan Investments: A Fiduciary HandbookCallan
 
What do Money Market Reforms Mean for Investors? A Roundtable Discussion with...
What do Money Market Reforms Mean for Investors? A Roundtable Discussion with...What do Money Market Reforms Mean for Investors? A Roundtable Discussion with...
What do Money Market Reforms Mean for Investors? A Roundtable Discussion with...Callan
 
Are Defined Contribution Plans Ready for Alternative Investments?
Are Defined Contribution Plans Ready for Alternative Investments?Are Defined Contribution Plans Ready for Alternative Investments?
Are Defined Contribution Plans Ready for Alternative Investments?Callan
 
2013 Callan Risk Management Survey
2013 Callan Risk Management Survey2013 Callan Risk Management Survey
2013 Callan Risk Management SurveyCallan
 
Risk Factors as Building Blocks for Portfolio Diversification
Risk Factors as Building Blocks for Portfolio DiversificationRisk Factors as Building Blocks for Portfolio Diversification
Risk Factors as Building Blocks for Portfolio DiversificationCallan
 
Going Global: U.S. Domestic Bias vs. The World
Going Global: U.S. Domestic Bias vs. The WorldGoing Global: U.S. Domestic Bias vs. The World
Going Global: U.S. Domestic Bias vs. The WorldCallan
 

Mehr von Callan (12)

The Renaissance of Stable Value: Capital Preservation in Defined Contribution
The Renaissance of Stable Value: Capital Preservation in Defined ContributionThe Renaissance of Stable Value: Capital Preservation in Defined Contribution
The Renaissance of Stable Value: Capital Preservation in Defined Contribution
 
Grading the Pensions Protection Act, 10 Years Later
Grading the Pensions Protection Act, 10 Years LaterGrading the Pensions Protection Act, 10 Years Later
Grading the Pensions Protection Act, 10 Years Later
 
Target Date Funds - Finding the Right Vehicle for the Road to Retirement
Target Date Funds - Finding the Right Vehicle for the Road to RetirementTarget Date Funds - Finding the Right Vehicle for the Road to Retirement
Target Date Funds - Finding the Right Vehicle for the Road to Retirement
 
Defined Contribution Plans and Fee Lawsuits: Stuck in the Mud or the Road to ...
Defined Contribution Plans and Fee Lawsuits: Stuck in the Mud or the Road to ...Defined Contribution Plans and Fee Lawsuits: Stuck in the Mud or the Road to ...
Defined Contribution Plans and Fee Lawsuits: Stuck in the Mud or the Road to ...
 
Active Share and Product Pairs Analysis
Active Share and Product Pairs AnalysisActive Share and Product Pairs Analysis
Active Share and Product Pairs Analysis
 
Emerging Managers: Small Firms with Big Ideas
Emerging Managers: Small Firms with Big IdeasEmerging Managers: Small Firms with Big Ideas
Emerging Managers: Small Firms with Big Ideas
 
Managing Defined Contribution Plan Investments: A Fiduciary Handbook
Managing Defined Contribution Plan Investments: A Fiduciary HandbookManaging Defined Contribution Plan Investments: A Fiduciary Handbook
Managing Defined Contribution Plan Investments: A Fiduciary Handbook
 
What do Money Market Reforms Mean for Investors? A Roundtable Discussion with...
What do Money Market Reforms Mean for Investors? A Roundtable Discussion with...What do Money Market Reforms Mean for Investors? A Roundtable Discussion with...
What do Money Market Reforms Mean for Investors? A Roundtable Discussion with...
 
Are Defined Contribution Plans Ready for Alternative Investments?
Are Defined Contribution Plans Ready for Alternative Investments?Are Defined Contribution Plans Ready for Alternative Investments?
Are Defined Contribution Plans Ready for Alternative Investments?
 
2013 Callan Risk Management Survey
2013 Callan Risk Management Survey2013 Callan Risk Management Survey
2013 Callan Risk Management Survey
 
Risk Factors as Building Blocks for Portfolio Diversification
Risk Factors as Building Blocks for Portfolio DiversificationRisk Factors as Building Blocks for Portfolio Diversification
Risk Factors as Building Blocks for Portfolio Diversification
 
Going Global: U.S. Domestic Bias vs. The World
Going Global: U.S. Domestic Bias vs. The WorldGoing Global: U.S. Domestic Bias vs. The World
Going Global: U.S. Domestic Bias vs. The World
 

Kürzlich hochgeladen

《加拿大本地办假证-寻找办理Dalhousie毕业证和达尔豪斯大学毕业证书的中介代理》
《加拿大本地办假证-寻找办理Dalhousie毕业证和达尔豪斯大学毕业证书的中介代理》《加拿大本地办假证-寻找办理Dalhousie毕业证和达尔豪斯大学毕业证书的中介代理》
《加拿大本地办假证-寻找办理Dalhousie毕业证和达尔豪斯大学毕业证书的中介代理》rnrncn29
 
BPPG response - Options for Defined Benefit schemes - 19Apr24.pdf
BPPG response - Options for Defined Benefit schemes - 19Apr24.pdfBPPG response - Options for Defined Benefit schemes - 19Apr24.pdf
BPPG response - Options for Defined Benefit schemes - 19Apr24.pdfHenry Tapper
 
Classical Theory of Macroeconomics by Adam Smith
Classical Theory of Macroeconomics by Adam SmithClassical Theory of Macroeconomics by Adam Smith
Classical Theory of Macroeconomics by Adam SmithAdamYassin2
 
Monthly Market Risk Update: April 2024 [SlideShare]
Monthly Market Risk Update: April 2024 [SlideShare]Monthly Market Risk Update: April 2024 [SlideShare]
Monthly Market Risk Update: April 2024 [SlideShare]Commonwealth
 
原版1:1复刻堪萨斯大学毕业证KU毕业证留信学历认证
原版1:1复刻堪萨斯大学毕业证KU毕业证留信学历认证原版1:1复刻堪萨斯大学毕业证KU毕业证留信学历认证
原版1:1复刻堪萨斯大学毕业证KU毕业证留信学历认证jdkhjh
 
Governor Olli Rehn: Dialling back monetary restraint
Governor Olli Rehn: Dialling back monetary restraintGovernor Olli Rehn: Dialling back monetary restraint
Governor Olli Rehn: Dialling back monetary restraintSuomen Pankki
 
(办理学位证)加拿大萨省大学毕业证成绩单原版一比一
(办理学位证)加拿大萨省大学毕业证成绩单原版一比一(办理学位证)加拿大萨省大学毕业证成绩单原版一比一
(办理学位证)加拿大萨省大学毕业证成绩单原版一比一S SDS
 
Quantitative Analysis of Retail Sector Companies
Quantitative Analysis of Retail Sector CompaniesQuantitative Analysis of Retail Sector Companies
Quantitative Analysis of Retail Sector Companiesprashantbhati354
 
NO1 WorldWide Love marriage specialist baba ji Amil Baba Kala ilam powerful v...
NO1 WorldWide Love marriage specialist baba ji Amil Baba Kala ilam powerful v...NO1 WorldWide Love marriage specialist baba ji Amil Baba Kala ilam powerful v...
NO1 WorldWide Love marriage specialist baba ji Amil Baba Kala ilam powerful v...Amil baba
 
Economic Risk Factor Update: April 2024 [SlideShare]
Economic Risk Factor Update: April 2024 [SlideShare]Economic Risk Factor Update: April 2024 [SlideShare]
Economic Risk Factor Update: April 2024 [SlideShare]Commonwealth
 
magnetic-pensions-a-new-blueprint-for-the-dc-landscape.pdf
magnetic-pensions-a-new-blueprint-for-the-dc-landscape.pdfmagnetic-pensions-a-new-blueprint-for-the-dc-landscape.pdf
magnetic-pensions-a-new-blueprint-for-the-dc-landscape.pdfHenry Tapper
 
call girls in Nand Nagri (DELHI) 🔝 >༒9953330565🔝 genuine Escort Service 🔝✔️✔️
call girls in  Nand Nagri (DELHI) 🔝 >༒9953330565🔝 genuine Escort Service 🔝✔️✔️call girls in  Nand Nagri (DELHI) 🔝 >༒9953330565🔝 genuine Escort Service 🔝✔️✔️
call girls in Nand Nagri (DELHI) 🔝 >༒9953330565🔝 genuine Escort Service 🔝✔️✔️9953056974 Low Rate Call Girls In Saket, Delhi NCR
 
Interimreport1 January–31 March2024 Elo Mutual Pension Insurance Company
Interimreport1 January–31 March2024 Elo Mutual Pension Insurance CompanyInterimreport1 January–31 March2024 Elo Mutual Pension Insurance Company
Interimreport1 January–31 March2024 Elo Mutual Pension Insurance CompanyTyöeläkeyhtiö Elo
 
Call Girls Near Me WhatsApp:+91-9833363713
Call Girls Near Me WhatsApp:+91-9833363713Call Girls Near Me WhatsApp:+91-9833363713
Call Girls Near Me WhatsApp:+91-9833363713Sonam Pathan
 
212MTAMount Durham University Bachelor's Diploma in Technology
212MTAMount Durham University Bachelor's Diploma in Technology212MTAMount Durham University Bachelor's Diploma in Technology
212MTAMount Durham University Bachelor's Diploma in Technologyz xss
 
Bladex 1Q24 Earning Results Presentation
Bladex 1Q24 Earning Results PresentationBladex 1Q24 Earning Results Presentation
Bladex 1Q24 Earning Results PresentationBladex
 
fca-bsps-decision-letter-redacted (1).pdf
fca-bsps-decision-letter-redacted (1).pdffca-bsps-decision-letter-redacted (1).pdf
fca-bsps-decision-letter-redacted (1).pdfHenry Tapper
 
NO1 WorldWide online istikhara for love marriage vashikaran specialist love p...
NO1 WorldWide online istikhara for love marriage vashikaran specialist love p...NO1 WorldWide online istikhara for love marriage vashikaran specialist love p...
NO1 WorldWide online istikhara for love marriage vashikaran specialist love p...Amil Baba Dawood bangali
 
The Triple Threat | Article on Global Resession | Harsh Kumar
The Triple Threat | Article on Global Resession | Harsh KumarThe Triple Threat | Article on Global Resession | Harsh Kumar
The Triple Threat | Article on Global Resession | Harsh KumarHarsh Kumar
 
Bladex Earnings Call Presentation 1Q2024
Bladex Earnings Call Presentation 1Q2024Bladex Earnings Call Presentation 1Q2024
Bladex Earnings Call Presentation 1Q2024Bladex
 

Kürzlich hochgeladen (20)

《加拿大本地办假证-寻找办理Dalhousie毕业证和达尔豪斯大学毕业证书的中介代理》
《加拿大本地办假证-寻找办理Dalhousie毕业证和达尔豪斯大学毕业证书的中介代理》《加拿大本地办假证-寻找办理Dalhousie毕业证和达尔豪斯大学毕业证书的中介代理》
《加拿大本地办假证-寻找办理Dalhousie毕业证和达尔豪斯大学毕业证书的中介代理》
 
BPPG response - Options for Defined Benefit schemes - 19Apr24.pdf
BPPG response - Options for Defined Benefit schemes - 19Apr24.pdfBPPG response - Options for Defined Benefit schemes - 19Apr24.pdf
BPPG response - Options for Defined Benefit schemes - 19Apr24.pdf
 
Classical Theory of Macroeconomics by Adam Smith
Classical Theory of Macroeconomics by Adam SmithClassical Theory of Macroeconomics by Adam Smith
Classical Theory of Macroeconomics by Adam Smith
 
Monthly Market Risk Update: April 2024 [SlideShare]
Monthly Market Risk Update: April 2024 [SlideShare]Monthly Market Risk Update: April 2024 [SlideShare]
Monthly Market Risk Update: April 2024 [SlideShare]
 
原版1:1复刻堪萨斯大学毕业证KU毕业证留信学历认证
原版1:1复刻堪萨斯大学毕业证KU毕业证留信学历认证原版1:1复刻堪萨斯大学毕业证KU毕业证留信学历认证
原版1:1复刻堪萨斯大学毕业证KU毕业证留信学历认证
 
Governor Olli Rehn: Dialling back monetary restraint
Governor Olli Rehn: Dialling back monetary restraintGovernor Olli Rehn: Dialling back monetary restraint
Governor Olli Rehn: Dialling back monetary restraint
 
(办理学位证)加拿大萨省大学毕业证成绩单原版一比一
(办理学位证)加拿大萨省大学毕业证成绩单原版一比一(办理学位证)加拿大萨省大学毕业证成绩单原版一比一
(办理学位证)加拿大萨省大学毕业证成绩单原版一比一
 
Quantitative Analysis of Retail Sector Companies
Quantitative Analysis of Retail Sector CompaniesQuantitative Analysis of Retail Sector Companies
Quantitative Analysis of Retail Sector Companies
 
NO1 WorldWide Love marriage specialist baba ji Amil Baba Kala ilam powerful v...
NO1 WorldWide Love marriage specialist baba ji Amil Baba Kala ilam powerful v...NO1 WorldWide Love marriage specialist baba ji Amil Baba Kala ilam powerful v...
NO1 WorldWide Love marriage specialist baba ji Amil Baba Kala ilam powerful v...
 
Economic Risk Factor Update: April 2024 [SlideShare]
Economic Risk Factor Update: April 2024 [SlideShare]Economic Risk Factor Update: April 2024 [SlideShare]
Economic Risk Factor Update: April 2024 [SlideShare]
 
magnetic-pensions-a-new-blueprint-for-the-dc-landscape.pdf
magnetic-pensions-a-new-blueprint-for-the-dc-landscape.pdfmagnetic-pensions-a-new-blueprint-for-the-dc-landscape.pdf
magnetic-pensions-a-new-blueprint-for-the-dc-landscape.pdf
 
call girls in Nand Nagri (DELHI) 🔝 >༒9953330565🔝 genuine Escort Service 🔝✔️✔️
call girls in  Nand Nagri (DELHI) 🔝 >༒9953330565🔝 genuine Escort Service 🔝✔️✔️call girls in  Nand Nagri (DELHI) 🔝 >༒9953330565🔝 genuine Escort Service 🔝✔️✔️
call girls in Nand Nagri (DELHI) 🔝 >༒9953330565🔝 genuine Escort Service 🔝✔️✔️
 
Interimreport1 January–31 March2024 Elo Mutual Pension Insurance Company
Interimreport1 January–31 March2024 Elo Mutual Pension Insurance CompanyInterimreport1 January–31 March2024 Elo Mutual Pension Insurance Company
Interimreport1 January–31 March2024 Elo Mutual Pension Insurance Company
 
Call Girls Near Me WhatsApp:+91-9833363713
Call Girls Near Me WhatsApp:+91-9833363713Call Girls Near Me WhatsApp:+91-9833363713
Call Girls Near Me WhatsApp:+91-9833363713
 
212MTAMount Durham University Bachelor's Diploma in Technology
212MTAMount Durham University Bachelor's Diploma in Technology212MTAMount Durham University Bachelor's Diploma in Technology
212MTAMount Durham University Bachelor's Diploma in Technology
 
Bladex 1Q24 Earning Results Presentation
Bladex 1Q24 Earning Results PresentationBladex 1Q24 Earning Results Presentation
Bladex 1Q24 Earning Results Presentation
 
fca-bsps-decision-letter-redacted (1).pdf
fca-bsps-decision-letter-redacted (1).pdffca-bsps-decision-letter-redacted (1).pdf
fca-bsps-decision-letter-redacted (1).pdf
 
NO1 WorldWide online istikhara for love marriage vashikaran specialist love p...
NO1 WorldWide online istikhara for love marriage vashikaran specialist love p...NO1 WorldWide online istikhara for love marriage vashikaran specialist love p...
NO1 WorldWide online istikhara for love marriage vashikaran specialist love p...
 
The Triple Threat | Article on Global Resession | Harsh Kumar
The Triple Threat | Article on Global Resession | Harsh KumarThe Triple Threat | Article on Global Resession | Harsh Kumar
The Triple Threat | Article on Global Resession | Harsh Kumar
 
Bladex Earnings Call Presentation 1Q2024
Bladex Earnings Call Presentation 1Q2024Bladex Earnings Call Presentation 1Q2024
Bladex Earnings Call Presentation 1Q2024
 

Risky Business

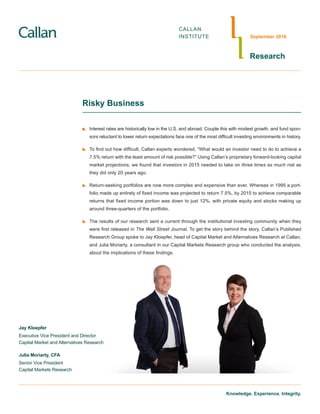
  • 1. Knowledge. Experience. Integrity. CALLAN INSTITUTE Research September 2016 Risky Business Interest rates are historically low in the U.S. and abroad. Couple this with modest growth, and fund spon- sors reluctant to lower return expectations face one of the most difficult investing environments in history. To find out how difficult, Callan experts wondered, “What would an investor need to do to achieve a 7.5% return with the least amount of risk possible?” Using Callan’s proprietary forward-looking capital market projections, we found that investors in 2015 needed to take on three times as much risk as they did only 20 years ago. Return-seeking portfolios are now more complex and expensive than ever. Whereas in 1995 a port- folio made up entirely of fixed income was projected to return 7.5%, by 2015 to achieve comparable returns that fixed income portion was down to just 12%, with private equity and stocks making up around three-quarters of the portfolio. The results of our research sent a current through the institutional investing community when they were first released in The Wall Street Journal. To get the story behind the story, Callan’s Published Research Group spoke to Jay Kloepfer, head of Capital Market and Alternatives Research at Callan, and Julia Moriarty, a consultant in our Capital Markets Research group who conducted the analysis, about the implications of these findings. Jay Kloepfer Executive Vice President and Director Capital Market and Alternatives Research Julia Moriarty, CFA Senior Vice President Capital Markets Research
  • 2. 2 How did this start? Julia Jim Callahan, Callan’s Head of Fund Sponsor Consulting, was presenting to a group of public funds. His purpose was simple: he wanted to show what investors had to do to get a 7.5% return 20 years ago, with the least amount of risk, versus what they have to do to achieve that same return today. Our hypothesis was that achieving 7.5% now would require greater risk, complexity, and expense. That turned out to very much be the case. How did you prepare the analysis? Julia We conduct asset allocation studies for clients in order to determine the risk associated with portfolios that are designed to generate an expected return. Callan has an optimizing tool that helps us find the “efficient frontier,” meaning the right combination of assets that provides the highest return for the lowest risk. In 1995, our expectation for broad U.S. fixed income was exactly 7.5%. We found a 100% fixed income portfolio was an efficient way to achieve that return, with a standard deviation of just 6% (Exhibit 1). Ten years later, an investor seeking a 7.5% return would have needed a portfolio containing 48% relatively risky, return-seeking assets, with just 52% in fixed income. And between 2005 and 2015, an investor had to risk up the portfolio even more and include 88% in return-seeking assets, with just 12% in fixed income. Meanwhile, the standard deviation almost doubled from “only” 8.9% in 2005 to 17.2% in 2015. Standard deviation is a broad measure of risk, so the headline is that in just two decades, the risk required to achieve a 7.5% return nearly tripled from 6% to 17.2%. Do these pie charts represent how our clients were actually invested? Jay No, they do not. These asset mixes for 1995, 2005, and 2015 are based on the forward-looking capital market projections that we created in each of those years. Those projections are our expectations for risk and return in each asset class, as well as their correlation to one another. Private Equity 12% Non-U.S. Equity 22% U.S. Large Cap 33% Fixed Income 12% Real Estate 13% U.S. Small Cap 8% Private Equity 4% Non-U.S. Equity 14% U.S. Large Cap 20% Fixed Income 52% Real Estate 5% U.S. Small Cap 5% Broad U.S. Fixed Income 100% Increasing Complexity Increasing Risk 1995 Expected Return: 7.5% Standard Deviation: 6.0% 2005 Expected Return: 7.5% Standard Deviation: 8.9% 2015 Expected Return: 7.5% Standard Deviation: 17.2% Exhibit 1 Same Return, Increasing Risk Projected portfolio returns over past 20 years Source: Callan Capital Market Projections
  • 3. 3Knowledge. Experience. Integrity. Our projections for virtually all asset classes have come down gradually over the years. The unnerving consequence of lowering capital market projections is that if an institutional investor does not lower its total fund return requirement, that investor will have to keep taking on more and more risk. Driving fixed income allocations down to 12% means investors do not have a lot of protection in a deflationary environment. The “safe asset” or bedrock against which they take risk gets smaller. It also means they face a great deal of volatility, as a 17.2% standard deviation represents equity-like volatility for the total portfolio. Would you say that investors are taking on more risk, complexity, and expense for lower returns? Jay A better way of saying it is that many investors are reaching for risk in order to achieve return expecta- tions that they are unwilling to lower. Were you surprised at what you found? Julia Yes and no. We were fairly certain that plans had to increase risk when they were reluctant to lower their expected return. With the decline in interest rates, and bond yields correspondingly falling, plans have to take on more risk in the form of equities and illiquid investments to achieve the same expected return. I think we were surprised at the size of the shift in the model portfolio’s assets. To see the decline from 100% fixed income to 52% to 12%—the magnitude was surprising. The fact that an investor had to take on three times the risk to achieve the same return was surprising as well. Jay In 2015 fund sponsors would have loved to hold nothing but bonds—if only they returned something. Now sponsors have to invest in more asset classes, and these asset classes are more complicated and time-consuming, which results in greater expense. Are standard deviation and risk synonymous? Jay Standard deviation represents a variability of results, which is more or less the broadest definition of investment risk. It is a measure of how far returns can range. A bigger standard deviation means a greater range of potential outcomes. It represents how much returns could be over or under expected results. The typical statistical reading is that one standard deviation around the expected case captures about 68% of potential results, and two standard deviations about 96%. To illustrate this point, assume that in 1995 an investor had a 7.5% return expectation with a standard deviation of 6.0%. One standard deviation down would be a +1.5% return and one up would be +13.5%. Two standard devia- tions would be -4.5% to as high as +19.5%. That is a fairly narrow range. For a standard deviation of 17.2%, which is what we projected for the 2015 portfolio, the risk is much, much higher: Two standard deviations would yield a range of -26.9% to +41.9%. 1 SD 34% 2 SD 14% 1 SD 34% 2 SD 14% 96% Standard Deviation (SD) Bell Curve
  • 4. 4 What would happen to expected returns if standard deviation was held constant? Julia We conducted that analysis, holding standard deviation at 6.0%. Based on our capital market projections in each of those years, expected returns fell from 7.5% in 1995 to 4.8% in 2015 (Exhibit 2). Private Equity 3% Non-U.S. Equity 8% U.S. Large Cap 11% Fixed Income 71% Real Estate 4% U.S. Small Cap 3% Private Equity 2% Non-U.S. Equity 9% U.S. Large Cap 13% Fixed Income 70% Real Estate 3% U.S. Small Cap 3% Increasing Complexity Decreasing Returns 1995 Expected Return: 7.5% Standard Deviation: 6.0% 2005 Expected Return: 6.5% Standard Deviation: 6.0% 2015 Expected Return: 4.8% Standard Deviation: 6.0% Broad U.S. Fixed Income 100% Source: Callan Capital Market Projections Fiscal Year Latest2013201220112010200920082007200620052004200320022001 8.5% >8.0% <8.5% 8.0% >7.5% <8.0% >7.0% -7.5% 7.0% <7.0% >8.5% 8.5% >8.0% <8.5% 8.0% >7.5% <8.0% >7.0% -7.5% 7.0% Funds’returnexpectations Exhibit 2 Same Risk, Decreasing Returns When target risk is held at 6.0% expected returns fall from 7.5% in 1995 to 4.8% in 2015 Exhibit 3 Public Funds Historical changes to long-term return assumptions Source: Compiled by NASRA based on Public Fund Survey When did 7.5% become the “Holy Grail” for institutional investors? Julia It has evolved. It begins with expected return, which is also known as the “discount rate.” A discount rate of “X” means the money in the corpus of a pension fund is expected to grow by that amount. Given that expectation, a fund sponsor needs to figure out how the money should be invested in order to achieve that rate of return. The discount rate used to be almost 9% when capital market projections were much higher in the late 1980s and early 1990s. Then the typical rate went down to 8.5%, then 8%, and now 7.5% (Exhibit 3), which is still a bit optimistic given current expectations.
  • 5. 5Knowledge. Experience. Integrity. Were you having similar conversations about risk in 2005? Jay Yes, although the return bogey was not 7.5%. It was closer to 8.5%. In the late 1990s there was a lot of pressure from plan sponsors on actuaries and advisors to raise discount rates because there had been a period of such incredible capital market performance. They would say, “Why would you put the discount rate at 8%? It will force us to put too much money in the plan. We should put the discount rate at 10%.” Then we suffered through the almost three-year-long bear market from spring 2000 to well into 2002. The S&P lost half its value, and fund sponsors had to reassess because they were no longer at a 120% funding level. They had to gradually start bringing down assumptions. What is the culprit in all of this? Julia There has been a secular decline in interest rates and bond yields (Exhibit 4). Callan has been doing capital markets projections since the early 1980s and in 1989 our forward-looking projection for fixed income was 9.4%. Post-financial crisis, the world financial system entered an era of unprecedented monetary easing. Jay Between 2005 and 2015, we saw the tail end of the real estate boom and a bubble in mortgage-backed securities. That bubble burst, which launched the global financial crisis. Governments and central banks around the world embarked on a unified, worldwide fiscal and monetary response. This response drove interest rates to zero as a way to keep liquidity going, to keep the economy moving, and to push investors into risk assets, because risk assets were expected to create economic growth. The thinking was: Don’t let people sit on piles of money; instead, make it so painful that they have to go invest. 0% 2% 4% 6% 8% 10% 12% 14% 16% 1980 1982 1990198819861984 1992 199819961994 2000 2002 2004 2006 2008 2010 2012 2014 2016 Exhibit 4 A Decades-Long Slide 10-year Treasury yields (December 1979 to July 2016) Source: Federal Reserve System
  • 6. 6 Only in hindsight will it be clear if this policy has been successful. One can argue that this zero-interest rate policy kept the world financial system from going into a deep, dark tailspin from which it may have not yet emerged. However, investors have to live with this overhang of historically low interest rates. Low interest rates are great for borrowers, but they are not so good for savers or investors. In 1995, a saver could get 7.5% on an account attached to bonds. An investor could live off that yield. Now to get to 7.5%, an investor must have a portfolio that is much riskier and much more complex. An all-bond portfolio today would produce a 2.0% return, which is far too low. The investor would have to eat into the corpus or take a lot more risk. If you look at this information from the standpoint of a public fund, it appears there are three poten- tial paths. Path One is to lower return assumptions, leading to increased contributions. Path Two is to lower benefits. Path Three is to maintain return assumptions and load up on risk. None of these are particularly appealing. Is there a fourth path anywhere? Julia A fourth path is a variation of Path Three, where instead of increasing risk in the form of beta exposure, plans are attempting to restructure their portfolios to increase alpha. This is a path that many fund spon- sors are taking. Finally, funds can also do a little bit of each: lower return assumptions (leading to increased contributions) and reduce benefits while increasing risk. It is not all-or-nothing. Why would an investor maintain a 7.5% expectation at this point? Jay There are significant real-life implications to lowering that expectation. Take a public pension plan with a 7.5% return target that decides to move its discount rate to 6.5% to lower its risk. When the calculation is done to see how well-funded the plan is and how much money needs to be put in, the funded status will go down and the amount of money that must be contributed goes up for a given level of benefits. A higher required contribution means less spending elsewhere in the sponsor’s budget, or perhaps it means a tax increase. Alternatively, lower funded status could force a reduction in benefits. Changing the return target has impacts measured in real dollars, and this is a dilemma that a lot of our clients face. The other challenge is that the typical public pension is well below 100% funded. They are not really earn- ing 7.5% relative to their liabilities. They may only be getting 65-75 cents on the dollar, so now that fund is compelled to have to reach even further and take on more risk, not less. Julia There is also a political aspect to pension funding and the setting of the investment return target, which is why some may be reticent to address it. Some of this is definitely hard news. What about taking the long view? If an investor averages a return of 7.5% over the long term, do these lean years matter all that much? Jay The path to getting to 7.5% can matter a lot, especially when you attach dollars to it. This phenomenon is called “return sequencing.” Let’s say there are two public funds with two large pools of money that average a 7.5% return over 10 years, both of which are distributing cash over that period of time. Pool A has a couple of bad years up front, whereas Pool B has its bad years interspersed. Pool A may very well come away with less money.
  • 7. 7Knowledge. Experience. Integrity. There are time-horizon issues too. What have pensions done over the past 30 to 40 years? Have they generated 7.5%? Yes, they have. But what were the circumstances under which they achieved this return? Interest rates were higher. Stock market returns were higher than current forward-looking projections. What is a reasonable set of expectations going forward? The path forward is not clear because of the current zero-interest-rate policy. We will enter uncharted territory once interest rates start to go back up. If an investor has a horizon of 30 or 40 years, it is not unreasonable to expect that returns will revert to their long-term mean, which is higher than our current projections. These long-term investors think, “I probably shouldn’t make too big a strategic move with my plan based on the last five years.” That may work out, but if there are a couple of missteps in the capital markets that are concentrated, and those missteps drive the funded status into a place where the financial condition of the fund is now in peril, the fund sponsor may never get to enjoy the benefits of that 7.5%. We conducted this analysis pre-Brexit. How does the Brexit affect this environment? Jay The Brexit just exacerbates the problem. We did this analysis at a point when everyone expected inter- est rates to rise toward 3% or higher over the next couple of years, and even that did not allow for a lot of fixed income in a portfolio if the investor had a 7.5% return requirement. Now interest rates have plummeted even more. It was tough getting to 7.5% before; it is even harder post-Brexit. Key questions for investors to consider Given the nearly three-fold increase in risk required to produce a 7.5% return in 2015 compared to 1995, investors should consider these critical questions in evaluating their portfolios: 1. What is the purpose of each asset class in the portfolio? 2. Is the fund’s fixed income exposure a sufficient enough anchor against risk? 3. Is the fund’s fixed income exposure really “fixed income,” or is it filled with investments that have a lot of equity-like risks, such as credit? 4. How far can the fund go in terms of exposure to fixed income? 5. Is there something else the investor can do to lower risk? 6. Is the fund still comfortable with its return target, and the resulting risk in the portfolio? 7. Is the portfolio truly a reflection of its tolerance for risk? 8. Can the fund handle lowering return expectations? 9. If not, then what changes can it make?
  • 8. 8 Biographies Jay V. Kloepfer is an Executive Vice President and the Director of Capital Market and Alternatives Research. Jay oversees Callan’s Capital Markets, Hedge Fund and Private Markets research groups. The Capital Markets group helps Callan’s fund sponsor clients with their strategic planning, conducting asset allocation and asset/liability studies, developing optimal investment manager structures, evaluating defined contribution plan investment lineups and providing custom research on a variety of investment top- ics. The Hedge Fund and Private Markets groups are responsible for specialized consulting including asset class and strategy research, manager searches, portfolio reviews, and performance evaluation. Jay is the author of the “Callan Periodic Table of Investment Returns,” which he created in 1999. He is a member of Callan’s Management Committee and is a shareholder of the firm. Jay earned an MA in Economics from Stanford and a BS with honors in Economics from the University of Oregon. Julia A. Moriarty, CFA, is a Senior Vice President and a consultant in the Capital Markets Research group. She is responsible for assisting plan sponsor clients with their strategic planning, conducting asset allocation studies, developing optimal investment manager structures, and providing custom research on a variety of investment topics. Julia joined Callan in 1990 as an analyst in the Client Report Services group, working on the production of comprehensive performance measurement reports and the implementation and testing of new products. Prior to joining the Capital Markets Research group, she was a Software Solutions Consultant in the Client Software Department. Julia is a shareholder of the firm. Julia earned an MBA from the University of California at Berkeley’s Haas School of Business and a BS in Finance from California Polytechnic State University at San Luis Obispo. She earned the right to use the Chartered Financial Analyst designation and is a member of the CFA Society of San Francisco and CFA Institute. .
  • 9. 9Knowledge. Experience. Integrity. Certain information herein has been compiled by Callan and is based on information provided by a variety of sources believed to be reliable for which Callan has not necessarily verified the accuracy or completeness of or updated. This report is for informational pur- poses only and should not be construed as legal or tax advice on any matter. Any investment decision you make on the basis of this report is your sole responsibility. You should consult with legal and tax advisers before applying any of this information to your particular situation. Reference in this report to any product, service or entity should not be construed as a recommendation, approval, affiliation or endorsement of such product, service or entity by Callan. Past performance is no guarantee of future results. This report may consist of statements of opinion, which are made as of the date they are expressed and are not statements of fact. The Callan Institute (the “Institute”) is, and will be, the sole owner and copyright holder of all material prepared or developed by the Institute. No party has the right to reproduce, revise, resell, disseminate externally, disseminate to subsidiaries or parents, or post on internal web sites any part of any material prepared or developed by the Institute, without the Institute’s permission. Institute clients only have the right to utilize such material internally in their business. If you have any questions or comments, please email institute@callan.com. About Callan Callan was founded as an employee-owned investment consulting firm in 1973. Ever since, we have empowered institutional clients with creative, customized investment solutions that are uniquely backed by proprietary research, exclusive data, ongoing education and decision support. Today, Callan advises on more than $2 trillion in total assets, which makes us among the largest independently owned invest- ment consulting firms in the U.S. We use a client-focused consulting model to serve public and private pension plan sponsors, endowments, foundations, operating funds, smaller investment consulting firms, investment managers, and financial intermediaries. For more information, please visit www.callan.com. About the Callan Institute The Callan Institute, established in 1980, is a source of continuing education for those in the institutional investment community. The Institute conducts conferences and workshops and provides published research, surveys, and newsletters. The Institute strives to present the most timely and relevant research and educa- tion available so our clients and our associates stay abreast of important trends in the investments industry. © 2016 Callan Associates Inc.
  • 10. Corporate Headquarters Callan Associates 600 Montgomery Street Suite 800 San Francisco, CA 94111 800.227.3288 / 415.974.5060 www.callan.com Twitter: @CallanAssoc Follow us on LinkedIn Regional Offices Atlanta 800.522.9782 Chicago 800.999.3536 Denver 855.864.3377 New Jersey 800.274.5878