SlideShare ist ein Scribd-Unternehmen logo
1 von 4
Downloaden Sie, um offline zu lesen
YTD
completion (s.f.) Inventory (s.f.)
Direct net
absorption (s.f.)
YTD
direct net
absorption (s.f.)
Total net
absorption
(s.f.)
YTD total net
absorption
(s.f.)
YTD total net
absorption
(% of stock)
Direct
vacancy (s.f.)
Direct
vacancy (%)
Total vacancy
(s.f.)
Total vacancy
(%)
Average asking
rent ($ p.s.f.)
Under
construction /
renovation (s.f.)
Urban
Class A 0 40,379,759 302,869 590,560 291,075 558,347 1.4% 7,242,602 17.9% 7,520,992 18.6% $23.25 612,034
Class B 0 6,111,951 48,857 126,224 52,010 130,232 2.1% 1,480,964 24.2% 1,529,111 25.0% $18.51 0
Totals 0 46,491,710 351,726 716,784 343,085 688,579 1.5% 8,723,566 18.8% 9,050,103 19.5% $22.48 612,034
Suburban
Class A 0 52,592,576 -33,572 299,539 -105,213 214,621 0.4% 8,126,134 15.5% 8,676,454 16.5% $22.20 218,904
Class B 0 33,908,654 329,467 779,774 322,322 774,659 2.3% 8,710,941 25.7% 8,860,153 26.1% $16.27 0
Totals 0 86,501,230 295,895 1,079,313 217,109 989,280 1.1% 16,837,075 19.5% 17,536,607 20.3% $19.36 218,904
Market Totals
Class A 0 92,972,335 269,297 890,099 185,862 772,968 0.8% 15,368,736 16.5% 16,197,446 17.4% $22.65 830,938
Class B 0 40,020,605 378,324 905,998 374,332 904,891 2.3% 10,191,905 25.5% 10,389,264 26.0% $16.57 0
Totals 0 132,992,940 647,621 1,796,097 560,194 1,677,859 1.3% 25,560,641 19.2% 26,586,710 20.0% $20.36 830,938
Office Statistics
Atlanta | Q2 2014
© 2014 Jones Lang LaSalle IP, Inc. All rights reserved.
Ryan Harchar, Senior Research Analyst
3344 Peachtree Road NE Suite 1100 Atlanta GA 30326 tel +1 404 995 6509 fax +1 404 995 2184 ryan.harchar@am.jll.com
Urban
YTD
completion (s.f.) Inventory (s.f.)
Direct net
absorption (s.f.)
YTD
direct net
absorption (s.f.)
Total net
absorption
(s.f.)
YTD total net
absorption
(s.f.)
YTD total net
absorption
(% of stock)
Direct
vacancy (s.f.)
Direct
vacancy (%)
Total vacancy
(s.f.)
Total vacancy
(%)
Average asking
rent ($ p.s.f.)
Under
construction /
renovation (s.f.)
Buckhead
Class A 0 14,419,248 76,014 118,558 56,203 75,675 0.5% 2,343,184 16.3% 2,441,624 16.9% $26.09 125,000
Class B 0 1,824,060 11,551 41,433 16,298 47,885 2.6% 320,924 17.6% 326,227 17.9% $18.96 0
Totals 0 16,243,308 87,565 159,991 72,501 123,560 0.8% 2,664,108 16.4% 2,767,851 17.0% $25.29 125,000
Downtown
Class A 0 12,733,018 72,987 197,787 52,498 180,068 1.4% 2,534,928 19.9% 2,650,048 20.8% $18.54 0
Class B 0 2,328,544 9,525 56,253 9,525 55,403 2.4% 601,929 25.9% 604,089 25.9% $17.58 0
Totals 0 15,061,562 82,512 254,040 62,023 235,471 1.6% 3,136,857 20.8% 3,254,137 21.6% $18.38 0
Midtown
Class A 0 13,227,493 153,868 274,215 182,374 302,604 2.3% 2,364,490 17.9% 2,429,320 18.4% $26.08 487,034
Class B 0 1,959,347 27,781 28,538 26,187 26,944 1.4% 558,111 28.5% 598,795 30.6% $19.13 0
Totals 0 15,186,840 181,649 302,753 208,561 329,548 2.2% 2,922,601 19.2% 3,028,115 19.9% $24.53 487,034
Urban Totals
Class A 0 40,379,759 302,869 590,560 291,075 558,347 1.4% 7,242,602 17.9% 7,520,992 18.6% $23.25 612,034
Class B 0 6,111,951 48,857 126,224 52,010 130,232 2.1% 1,480,964 24.2% 1,529,111 25.0% $18.51 0
Totals 0 46,491,710 351,726 716,784 343,085 688,579 1.5% 8,723,566 18.8% 9,050,103 19.5% $22.48 612,034
© 2014 Jones Lang LaSalle IP, Inc. All rights reserved.
Ryan Harchar, Senior Research Analyst
3344 Peachtree Road NE Suite 1100 Atlanta GA 30326 tel +1 404 995 6509 fax +1 404 995 2184 ryan.harchar@am.jll.com
Atlanta Office Statistics - Q2 2014 • 2
Suburban
YTD
completion (s.f.) Inventory (s.f.)
Direct net
absorption (s.f.)
YTD
direct net
absorption (s.f.)
Total net
absorption
(s.f.)
YTD total net
absorption
(s.f.)
YTD total net
absorption
(% of stock)
Direct
vacancy (s.f.)
Direct
vacancy (%)
Total vacancy
(s.f.)
Total vacancy
(%)
Average asking
rent ($ p.s.f.)
Under
construction /
renovation (s.f.)
Central Perimeter
Class A 0 17,170,445 -9,818 267,183 -41,941 264,564 1.5% 1,874,129 10.9% 2,079,041 12.1% $24.39 0
Class B 0 4,598,498 196,153 222,634 185,570 216,723 4.7% 1,497,010 32.6% 1,535,132 33.4% $18.42 0
Totals 0 21,768,943 186,335 489,817 143,629 481,287 2.2% 3,371,139 15.5% 3,614,173 16.6% $22.00 0
North Fulton
Class A 0 12,071,916 54,938 103,827 16,662 64,952 0.5% 2,290,439 19.0% 2,416,921 20.0% $21.41 218,904
Class B 0 4,926,149 33,707 67,213 33,707 67,213 1.4% 949,312 19.3% 955,177 19.4% $15.65 0
Totals 0 16,998,065 88,645 171,040 50,369 132,165 0.8% 3,239,751 19.1% 3,372,098 19.8% $19.78 218,904
Northlake
Class A 0 2,719,374 -23,828 67,669 -24,679 75,763 2.8% 238,411 8.8% 344,254 12.7% $20.60 0
Class B 0 6,522,754 17,140 -9,683 43,930 17,107 0.3% 1,487,718 22.8% 1,490,812 22.9% $17.46 0
Totals 0 9,242,128 -6,688 57,986 19,251 92,870 1.0% 1,726,129 18.7% 1,835,066 19.9% $17.87 0
Northeast
Class A 0 5,754,263 93,835 -19,968 89,603 -41,848 -0.7% 1,299,773 22.6% 1,325,521 23.0% $19.65 0
Class B 0 8,298,758 39,425 227,850 17,044 202,827 2.4% 2,487,732 30.0% 2,531,601 30.5% $14.70 0
Totals 0 14,053,021 133,260 207,882 106,647 160,979 1.1% 3,787,505 27.0% 3,857,122 27.4% $16.56 0
Northwest
Class A 0 14,095,815 -166,844 -133,701 -163,003 -163,339 -1.2% 2,188,940 15.5% 2,276,275 16.1% $22.75 0
Class B 0 7,097,245 59,332 294,266 58,361 293,295 4.1% 1,841,702 25.9% 1,898,528 26.8% $16.04 0
Totals 0 21,193,060 -107,512 160,565 -104,642 129,956 0.6% 4,030,642 19.0% 4,174,803 19.7% $19.87 0
South Atlanta
Class A 0 780,763 18,145 14,529 18,145 14,529 1.9% 234,442 30.0% 234,442 30.0% $18.32 0
Class B 0 2,264,218 -15,412 -20,711 -15,412 -20,711 -0.9% 375,252 16.6% 376,688 16.6% $17.45 0
Totals 0 3,044,981 2,733 -6,182 2,733 -6,182 -0.2% 609,694 20.0% 611,130 20.1% $17.73 0
Atlanta Office Statistics - Q2 2014 • 3
Ryan Harchar, Senior Research Analyst
3344 Peachtree Road NE Suite 1100 Atlanta GA 30326 tel +1 404 995 6509 fax +1 404 995 2184 ryan.harchar@am.jll.com
© 2014 Jones Lang LaSalle IP, Inc. All rights reserved.
Suburban
YTD
completion (s.f.) Inventory (s.f.)
Direct net
absorption (s.f.)
YTD
direct net
absorption (s.f.)
Total net
absorption
(s.f.)
YTD total net
absorption
(s.f.)
YTD total net
absorption
(% of stock)
Direct
vacancy (s.f.)
Direct
vacancy (%)
Total vacancy
(s.f.)
Total vacancy
(%)
Average asking
rent ($ p.s.f.)
Under
construction /
renovation (s.f.)
West Atlanta
Class A 0 0 0 0 0 0 0.0% 0 0.0% 0 0.0% $0.00 0
Class B 0 201,032 -878 -1,795 -878 -1,795 -0.9% 72,215 35.9% 72,215 35.9% $11.99 0
Totals 0 201,032 -878 -1,795 -878 -1,795 -0.9% 72,215 35.9% 72,215 35.9% $11.99 0
Suburban Totals
Class A 0 52,592,576 -33,572 299,539 -105,213 214,621 0.4% 8,126,134 15.5% 8,676,454 16.5% $22.20 218,904
Class B 0 33,908,654 329,467 779,774 322,322 774,659 2.3% 8,710,941 25.7% 8,860,153 26.1% $16.27 0
Totals 0 86,501,230 295,895 1,079,313 217,109 989,280 1.1% 16,837,075 19.5% 17,536,607 20.3% $19.36 218,904
© 2014 Jones Lang LaSalle IP, Inc. All rights reserved.
Ryan Harchar, Senior Research Analyst
3344 Peachtree Road NE Suite 1100 Atlanta GA 30326 tel +1 404 995 6509 fax +1 404 995 2184 ryan.harchar@am.jll.com
Atlanta Office Statistics - Q2 2014 • 4

Weitere ähnliche Inhalte

Empfohlen

PEPSICO Presentation to CAGNY Conference Feb 2024
PEPSICO Presentation to CAGNY Conference Feb 2024PEPSICO Presentation to CAGNY Conference Feb 2024
PEPSICO Presentation to CAGNY Conference Feb 2024Neil Kimberley
 
Content Methodology: A Best Practices Report (Webinar)
Content Methodology: A Best Practices Report (Webinar)Content Methodology: A Best Practices Report (Webinar)
Content Methodology: A Best Practices Report (Webinar)contently
 
How to Prepare For a Successful Job Search for 2024
How to Prepare For a Successful Job Search for 2024How to Prepare For a Successful Job Search for 2024
How to Prepare For a Successful Job Search for 2024Albert Qian
 
Social Media Marketing Trends 2024 // The Global Indie Insights
Social Media Marketing Trends 2024 // The Global Indie InsightsSocial Media Marketing Trends 2024 // The Global Indie Insights
Social Media Marketing Trends 2024 // The Global Indie InsightsKurio // The Social Media Age(ncy)
 
Trends In Paid Search: Navigating The Digital Landscape In 2024
Trends In Paid Search: Navigating The Digital Landscape In 2024Trends In Paid Search: Navigating The Digital Landscape In 2024
Trends In Paid Search: Navigating The Digital Landscape In 2024Search Engine Journal
 
5 Public speaking tips from TED - Visualized summary
5 Public speaking tips from TED - Visualized summary5 Public speaking tips from TED - Visualized summary
5 Public speaking tips from TED - Visualized summarySpeakerHub
 
ChatGPT and the Future of Work - Clark Boyd
ChatGPT and the Future of Work - Clark Boyd ChatGPT and the Future of Work - Clark Boyd
ChatGPT and the Future of Work - Clark Boyd Clark Boyd
 
Getting into the tech field. what next
Getting into the tech field. what next Getting into the tech field. what next
Getting into the tech field. what next Tessa Mero
 
Google's Just Not That Into You: Understanding Core Updates & Search Intent
Google's Just Not That Into You: Understanding Core Updates & Search IntentGoogle's Just Not That Into You: Understanding Core Updates & Search Intent
Google's Just Not That Into You: Understanding Core Updates & Search IntentLily Ray
 
Time Management & Productivity - Best Practices
Time Management & Productivity -  Best PracticesTime Management & Productivity -  Best Practices
Time Management & Productivity - Best PracticesVit Horky
 
The six step guide to practical project management
The six step guide to practical project managementThe six step guide to practical project management
The six step guide to practical project managementMindGenius
 
Beginners Guide to TikTok for Search - Rachel Pearson - We are Tilt __ Bright...
Beginners Guide to TikTok for Search - Rachel Pearson - We are Tilt __ Bright...Beginners Guide to TikTok for Search - Rachel Pearson - We are Tilt __ Bright...
Beginners Guide to TikTok for Search - Rachel Pearson - We are Tilt __ Bright...RachelPearson36
 
Unlocking the Power of ChatGPT and AI in Testing - A Real-World Look, present...
Unlocking the Power of ChatGPT and AI in Testing - A Real-World Look, present...Unlocking the Power of ChatGPT and AI in Testing - A Real-World Look, present...
Unlocking the Power of ChatGPT and AI in Testing - A Real-World Look, present...Applitools
 
12 Ways to Increase Your Influence at Work
12 Ways to Increase Your Influence at Work12 Ways to Increase Your Influence at Work
12 Ways to Increase Your Influence at WorkGetSmarter
 
Ride the Storm: Navigating Through Unstable Periods / Katerina Rudko (Belka G...
Ride the Storm: Navigating Through Unstable Periods / Katerina Rudko (Belka G...Ride the Storm: Navigating Through Unstable Periods / Katerina Rudko (Belka G...
Ride the Storm: Navigating Through Unstable Periods / Katerina Rudko (Belka G...DevGAMM Conference
 

Empfohlen (20)

Skeleton Culture Code
Skeleton Culture CodeSkeleton Culture Code
Skeleton Culture Code
 
PEPSICO Presentation to CAGNY Conference Feb 2024
PEPSICO Presentation to CAGNY Conference Feb 2024PEPSICO Presentation to CAGNY Conference Feb 2024
PEPSICO Presentation to CAGNY Conference Feb 2024
 
Content Methodology: A Best Practices Report (Webinar)
Content Methodology: A Best Practices Report (Webinar)Content Methodology: A Best Practices Report (Webinar)
Content Methodology: A Best Practices Report (Webinar)
 
How to Prepare For a Successful Job Search for 2024
How to Prepare For a Successful Job Search for 2024How to Prepare For a Successful Job Search for 2024
How to Prepare For a Successful Job Search for 2024
 
Social Media Marketing Trends 2024 // The Global Indie Insights
Social Media Marketing Trends 2024 // The Global Indie InsightsSocial Media Marketing Trends 2024 // The Global Indie Insights
Social Media Marketing Trends 2024 // The Global Indie Insights
 
Trends In Paid Search: Navigating The Digital Landscape In 2024
Trends In Paid Search: Navigating The Digital Landscape In 2024Trends In Paid Search: Navigating The Digital Landscape In 2024
Trends In Paid Search: Navigating The Digital Landscape In 2024
 
5 Public speaking tips from TED - Visualized summary
5 Public speaking tips from TED - Visualized summary5 Public speaking tips from TED - Visualized summary
5 Public speaking tips from TED - Visualized summary
 
ChatGPT and the Future of Work - Clark Boyd
ChatGPT and the Future of Work - Clark Boyd ChatGPT and the Future of Work - Clark Boyd
ChatGPT and the Future of Work - Clark Boyd
 
Getting into the tech field. what next
Getting into the tech field. what next Getting into the tech field. what next
Getting into the tech field. what next
 
Google's Just Not That Into You: Understanding Core Updates & Search Intent
Google's Just Not That Into You: Understanding Core Updates & Search IntentGoogle's Just Not That Into You: Understanding Core Updates & Search Intent
Google's Just Not That Into You: Understanding Core Updates & Search Intent
 
How to have difficult conversations
How to have difficult conversations How to have difficult conversations
How to have difficult conversations
 
Introduction to Data Science
Introduction to Data ScienceIntroduction to Data Science
Introduction to Data Science
 
Time Management & Productivity - Best Practices
Time Management & Productivity -  Best PracticesTime Management & Productivity -  Best Practices
Time Management & Productivity - Best Practices
 
The six step guide to practical project management
The six step guide to practical project managementThe six step guide to practical project management
The six step guide to practical project management
 
Beginners Guide to TikTok for Search - Rachel Pearson - We are Tilt __ Bright...
Beginners Guide to TikTok for Search - Rachel Pearson - We are Tilt __ Bright...Beginners Guide to TikTok for Search - Rachel Pearson - We are Tilt __ Bright...
Beginners Guide to TikTok for Search - Rachel Pearson - We are Tilt __ Bright...
 
Unlocking the Power of ChatGPT and AI in Testing - A Real-World Look, present...
Unlocking the Power of ChatGPT and AI in Testing - A Real-World Look, present...Unlocking the Power of ChatGPT and AI in Testing - A Real-World Look, present...
Unlocking the Power of ChatGPT and AI in Testing - A Real-World Look, present...
 
12 Ways to Increase Your Influence at Work
12 Ways to Increase Your Influence at Work12 Ways to Increase Your Influence at Work
12 Ways to Increase Your Influence at Work
 
ChatGPT webinar slides
ChatGPT webinar slidesChatGPT webinar slides
ChatGPT webinar slides
 
More than Just Lines on a Map: Best Practices for U.S Bike Routes
More than Just Lines on a Map: Best Practices for U.S Bike RoutesMore than Just Lines on a Map: Best Practices for U.S Bike Routes
More than Just Lines on a Map: Best Practices for U.S Bike Routes
 
Ride the Storm: Navigating Through Unstable Periods / Katerina Rudko (Belka G...
Ride the Storm: Navigating Through Unstable Periods / Katerina Rudko (Belka G...Ride the Storm: Navigating Through Unstable Periods / Katerina Rudko (Belka G...
Ride the Storm: Navigating Through Unstable Periods / Katerina Rudko (Belka G...
 

JLL #Atlanta research shows the local #office market continued tightening throughout Q2 2014, w/ an increasingly landlord-driven leasing environment. Atlanta office-statistics-q2-2014 final

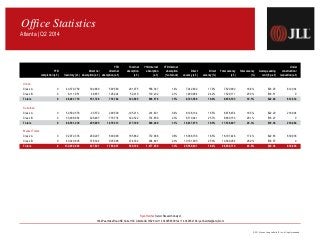
  • 1. YTD completion (s.f.) Inventory (s.f.) Direct net absorption (s.f.) YTD direct net absorption (s.f.) Total net absorption (s.f.) YTD total net absorption (s.f.) YTD total net absorption (% of stock) Direct vacancy (s.f.) Direct vacancy (%) Total vacancy (s.f.) Total vacancy (%) Average asking rent ($ p.s.f.) Under construction / renovation (s.f.) Urban Class A 0 40,379,759 302,869 590,560 291,075 558,347 1.4% 7,242,602 17.9% 7,520,992 18.6% $23.25 612,034 Class B 0 6,111,951 48,857 126,224 52,010 130,232 2.1% 1,480,964 24.2% 1,529,111 25.0% $18.51 0 Totals 0 46,491,710 351,726 716,784 343,085 688,579 1.5% 8,723,566 18.8% 9,050,103 19.5% $22.48 612,034 Suburban Class A 0 52,592,576 -33,572 299,539 -105,213 214,621 0.4% 8,126,134 15.5% 8,676,454 16.5% $22.20 218,904 Class B 0 33,908,654 329,467 779,774 322,322 774,659 2.3% 8,710,941 25.7% 8,860,153 26.1% $16.27 0 Totals 0 86,501,230 295,895 1,079,313 217,109 989,280 1.1% 16,837,075 19.5% 17,536,607 20.3% $19.36 218,904 Market Totals Class A 0 92,972,335 269,297 890,099 185,862 772,968 0.8% 15,368,736 16.5% 16,197,446 17.4% $22.65 830,938 Class B 0 40,020,605 378,324 905,998 374,332 904,891 2.3% 10,191,905 25.5% 10,389,264 26.0% $16.57 0 Totals 0 132,992,940 647,621 1,796,097 560,194 1,677,859 1.3% 25,560,641 19.2% 26,586,710 20.0% $20.36 830,938 Office Statistics Atlanta | Q2 2014 © 2014 Jones Lang LaSalle IP, Inc. All rights reserved. Ryan Harchar, Senior Research Analyst 3344 Peachtree Road NE Suite 1100 Atlanta GA 30326 tel +1 404 995 6509 fax +1 404 995 2184 ryan.harchar@am.jll.com
  • 2. Urban YTD completion (s.f.) Inventory (s.f.) Direct net absorption (s.f.) YTD direct net absorption (s.f.) Total net absorption (s.f.) YTD total net absorption (s.f.) YTD total net absorption (% of stock) Direct vacancy (s.f.) Direct vacancy (%) Total vacancy (s.f.) Total vacancy (%) Average asking rent ($ p.s.f.) Under construction / renovation (s.f.) Buckhead Class A 0 14,419,248 76,014 118,558 56,203 75,675 0.5% 2,343,184 16.3% 2,441,624 16.9% $26.09 125,000 Class B 0 1,824,060 11,551 41,433 16,298 47,885 2.6% 320,924 17.6% 326,227 17.9% $18.96 0 Totals 0 16,243,308 87,565 159,991 72,501 123,560 0.8% 2,664,108 16.4% 2,767,851 17.0% $25.29 125,000 Downtown Class A 0 12,733,018 72,987 197,787 52,498 180,068 1.4% 2,534,928 19.9% 2,650,048 20.8% $18.54 0 Class B 0 2,328,544 9,525 56,253 9,525 55,403 2.4% 601,929 25.9% 604,089 25.9% $17.58 0 Totals 0 15,061,562 82,512 254,040 62,023 235,471 1.6% 3,136,857 20.8% 3,254,137 21.6% $18.38 0 Midtown Class A 0 13,227,493 153,868 274,215 182,374 302,604 2.3% 2,364,490 17.9% 2,429,320 18.4% $26.08 487,034 Class B 0 1,959,347 27,781 28,538 26,187 26,944 1.4% 558,111 28.5% 598,795 30.6% $19.13 0 Totals 0 15,186,840 181,649 302,753 208,561 329,548 2.2% 2,922,601 19.2% 3,028,115 19.9% $24.53 487,034 Urban Totals Class A 0 40,379,759 302,869 590,560 291,075 558,347 1.4% 7,242,602 17.9% 7,520,992 18.6% $23.25 612,034 Class B 0 6,111,951 48,857 126,224 52,010 130,232 2.1% 1,480,964 24.2% 1,529,111 25.0% $18.51 0 Totals 0 46,491,710 351,726 716,784 343,085 688,579 1.5% 8,723,566 18.8% 9,050,103 19.5% $22.48 612,034 © 2014 Jones Lang LaSalle IP, Inc. All rights reserved. Ryan Harchar, Senior Research Analyst 3344 Peachtree Road NE Suite 1100 Atlanta GA 30326 tel +1 404 995 6509 fax +1 404 995 2184 ryan.harchar@am.jll.com Atlanta Office Statistics - Q2 2014 • 2
  • 3. Suburban YTD completion (s.f.) Inventory (s.f.) Direct net absorption (s.f.) YTD direct net absorption (s.f.) Total net absorption (s.f.) YTD total net absorption (s.f.) YTD total net absorption (% of stock) Direct vacancy (s.f.) Direct vacancy (%) Total vacancy (s.f.) Total vacancy (%) Average asking rent ($ p.s.f.) Under construction / renovation (s.f.) Central Perimeter Class A 0 17,170,445 -9,818 267,183 -41,941 264,564 1.5% 1,874,129 10.9% 2,079,041 12.1% $24.39 0 Class B 0 4,598,498 196,153 222,634 185,570 216,723 4.7% 1,497,010 32.6% 1,535,132 33.4% $18.42 0 Totals 0 21,768,943 186,335 489,817 143,629 481,287 2.2% 3,371,139 15.5% 3,614,173 16.6% $22.00 0 North Fulton Class A 0 12,071,916 54,938 103,827 16,662 64,952 0.5% 2,290,439 19.0% 2,416,921 20.0% $21.41 218,904 Class B 0 4,926,149 33,707 67,213 33,707 67,213 1.4% 949,312 19.3% 955,177 19.4% $15.65 0 Totals 0 16,998,065 88,645 171,040 50,369 132,165 0.8% 3,239,751 19.1% 3,372,098 19.8% $19.78 218,904 Northlake Class A 0 2,719,374 -23,828 67,669 -24,679 75,763 2.8% 238,411 8.8% 344,254 12.7% $20.60 0 Class B 0 6,522,754 17,140 -9,683 43,930 17,107 0.3% 1,487,718 22.8% 1,490,812 22.9% $17.46 0 Totals 0 9,242,128 -6,688 57,986 19,251 92,870 1.0% 1,726,129 18.7% 1,835,066 19.9% $17.87 0 Northeast Class A 0 5,754,263 93,835 -19,968 89,603 -41,848 -0.7% 1,299,773 22.6% 1,325,521 23.0% $19.65 0 Class B 0 8,298,758 39,425 227,850 17,044 202,827 2.4% 2,487,732 30.0% 2,531,601 30.5% $14.70 0 Totals 0 14,053,021 133,260 207,882 106,647 160,979 1.1% 3,787,505 27.0% 3,857,122 27.4% $16.56 0 Northwest Class A 0 14,095,815 -166,844 -133,701 -163,003 -163,339 -1.2% 2,188,940 15.5% 2,276,275 16.1% $22.75 0 Class B 0 7,097,245 59,332 294,266 58,361 293,295 4.1% 1,841,702 25.9% 1,898,528 26.8% $16.04 0 Totals 0 21,193,060 -107,512 160,565 -104,642 129,956 0.6% 4,030,642 19.0% 4,174,803 19.7% $19.87 0 South Atlanta Class A 0 780,763 18,145 14,529 18,145 14,529 1.9% 234,442 30.0% 234,442 30.0% $18.32 0 Class B 0 2,264,218 -15,412 -20,711 -15,412 -20,711 -0.9% 375,252 16.6% 376,688 16.6% $17.45 0 Totals 0 3,044,981 2,733 -6,182 2,733 -6,182 -0.2% 609,694 20.0% 611,130 20.1% $17.73 0 Atlanta Office Statistics - Q2 2014 • 3 Ryan Harchar, Senior Research Analyst 3344 Peachtree Road NE Suite 1100 Atlanta GA 30326 tel +1 404 995 6509 fax +1 404 995 2184 ryan.harchar@am.jll.com © 2014 Jones Lang LaSalle IP, Inc. All rights reserved.
  • 4. Suburban YTD completion (s.f.) Inventory (s.f.) Direct net absorption (s.f.) YTD direct net absorption (s.f.) Total net absorption (s.f.) YTD total net absorption (s.f.) YTD total net absorption (% of stock) Direct vacancy (s.f.) Direct vacancy (%) Total vacancy (s.f.) Total vacancy (%) Average asking rent ($ p.s.f.) Under construction / renovation (s.f.) West Atlanta Class A 0 0 0 0 0 0 0.0% 0 0.0% 0 0.0% $0.00 0 Class B 0 201,032 -878 -1,795 -878 -1,795 -0.9% 72,215 35.9% 72,215 35.9% $11.99 0 Totals 0 201,032 -878 -1,795 -878 -1,795 -0.9% 72,215 35.9% 72,215 35.9% $11.99 0 Suburban Totals Class A 0 52,592,576 -33,572 299,539 -105,213 214,621 0.4% 8,126,134 15.5% 8,676,454 16.5% $22.20 218,904 Class B 0 33,908,654 329,467 779,774 322,322 774,659 2.3% 8,710,941 25.7% 8,860,153 26.1% $16.27 0 Totals 0 86,501,230 295,895 1,079,313 217,109 989,280 1.1% 16,837,075 19.5% 17,536,607 20.3% $19.36 218,904 © 2014 Jones Lang LaSalle IP, Inc. All rights reserved. Ryan Harchar, Senior Research Analyst 3344 Peachtree Road NE Suite 1100 Atlanta GA 30326 tel +1 404 995 6509 fax +1 404 995 2184 ryan.harchar@am.jll.com Atlanta Office Statistics - Q2 2014 • 4