Grenada -Trade Profile UWI's Shridath Ramphal Centre
•
0 gefällt mir•393 views


Empfohlen
Empfohlen
Weitere ähnliche Inhalte
Was ist angesagt?
Was ist angesagt? (18)
Andere mochten auch
Andere mochten auch (9)
Ähnlich wie Grenada -Trade Profile UWI's Shridath Ramphal Centre
Ähnlich wie Grenada -Trade Profile UWI's Shridath Ramphal Centre (20)
Mehr von Office of Trade Negotiations (OTN), CARICOM Secretariat
Mehr von Office of Trade Negotiations (OTN), CARICOM Secretariat (20)
Grenada -Trade Profile UWI's Shridath Ramphal Centre
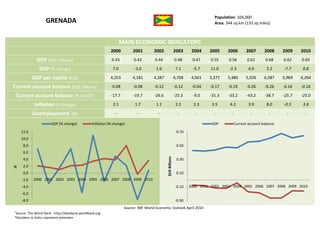
- 1. Population: 104,000 GRENADA Area: 344 sq km (133 sq miles) MAIN ECONOMIC INDICATORS 2000 2001 2002 2003 2004 2005 2006 2007 2008 2009 2010 GDP ($US, billions) 0.43 0.42 0.44 0.48 0.47 0.55 0.56 0.61 0.68 0.62 0.65 GDP (% change) 7.0 -3.0 1.6 7.1 -5.7 11.0 -2.3 4.9 2.2 -7.7 0.8 GDP per capita ($US) 4,253 4,181 4,287 4,708 4,601 5,377 5,480 5,926 6,587 5,969 6,264 Current account balance ($US, billions) -0.08 -0.08 -0.12 -0.12 -0.04 -0.17 -0.19 -0.26 -0.26 -0.16 -0.16 Current account balance (% of GDP) -17.7 -19.7 -26.6 -25.3 -9.0 -31.3 -33.2 -43.2 -38.7 -25.7 -25.0 Inflation (% change) 2.1 1.7 1.1 2.2 2.3 3.5 4.2 3.9 8.0 -0.3 3.6 Unemployment+ (%) - - - - - - - - - - - GDP (% change) Inflation (% change) GDP Current account balance 12.0 0.70 10.0 8.0 0.50 6.0 $US Billions 4.0 0.30 % 2.0 0.0 0.10 -2.0 2000 2001 2002 2003 2004 2005 2006 2007 2008 2009 2010 -4.0 -0.10 2000 2001 2002 2003 2004 2005 2006 2007 2008 2009 2010 -6.0 -8.0 -0.30 Source: IMF World Economic Outlook April 2010 + Source: The World Bank - http://databank.worldbank.org *Numbers in italics represent estimates
- 2. Population: 104,000 GRENADA Area: 344 sq km (133 sq miles) MAIN TRADE INDICATORS – GOODS 2004 2005 2006 2007 2008 Trade Balance ($US thousands) -218,908 -306,389 -273,537 -331,714 -265,809 Total Exported Value ($US thousands) 31,574 27,645 25,371 33,411 37,685 Total Imported Value ($US thousands) 250,482 334,034 298,908 365,125 303,494 Top 10 Markets by % of Total Exported Value (2007) Top 10 Markets by % of Total Imported Value (2007) Japan 19% United States of America 36% United States of America 17% Trinidad and Tobago 28% France 14% Japan 5% Saint Lucia 8% United Kingdom 4% Dominica 7% China 3% Barbados 5% Canada 2% Netherlands 5% Venezuela 2% Saint Kitts and Nevis 5% Brazil 2% Trinidad and Tobago 4% Netherlands 2% St Vincent & the Grenadines 3% Barbados 2% Paper & Top 5 Exports by % of Total Exported Value (2008) Top 5 Imports by % of Total Imported Value (2008) paperboard, articles of pulp, Milling Cereals, 5% 6% products, malt, Ships, boats starches, wheat and other gluten, 7% Vehicles other floating Mineral fuels, than railway, structures, 29% oils, distillation tramway, 5% Coffee, tea, products, 20% Fish, Nuclear mate and crustaceans, reactors, spices, 14% molluscs, boilers, aquatic Electrical, machinery, 6% invertebrates, electronic 16% equipment, 8% Source: International Trade Centre – www.trademap.org
- 3. Population: 104,000 GRENADA Area: 344 sq km (133 sq miles) MAIN TRADE INDICATORS – SERVICES 2004 2005 2006 2007 2008 Trade Balance ($US thousands) 68,470 19,610 28,840 36,560 35,659 Total Exported Value ($US thousands) 160,220 116,000 130,010 147,440 149,036 Total Imported Value ($US thousands) 91,750 96,390 101,170 110,880 113,377 Top Exports by % of Total Exported Value (2008) Top Imports by % of Total Imported Value (2008) Travel 70% Transportation 48% Insurance services 13% Transportation 9% Other business services 11% Communications services 9% Travel 10% Other business services 7% Government services 6% Construction services 5% Insurance services 4% Communications services 3% Government services 1% Royalties and license fees 3% Royalties and license fees 0.001% Computer & information services 0.01% Source: International Trade Centre – www.trademap.org